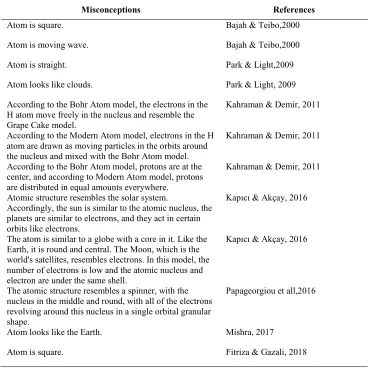
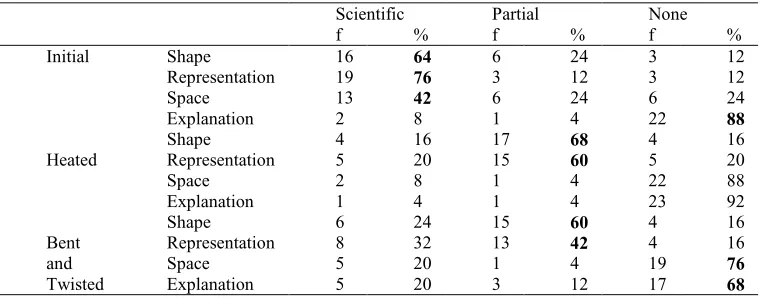
How the seventh grade students visualize atomic structure and models
Full text
Figure


Related documents
Extracting related data from various data sources, establishing distributed data warehouse, and data mining with the support of data warehouse can find out the
Results showed that increase in urban waste compost and manure increased corn dry matter, height, stem diameter, leaf area, leaf number, SPAD meter readings and leaf N..
The offset characterization of the two magnetic sensors components was performed inside a three-layer magnetic shielded chamber of 2.5 m 3 , previously characterized (at dif-
However, instead of simply using the maximum and minimum ground speeds around a circle, all GPS derived heading and ground speed measurements from around the circle are used to
In the gross debt approach, we assume that the gross debt to capital ratio that we compute for the firm by dividing the gross debt ($500) by the market value of the firm (1500)
National Conference on Technical Vocational Education, Training and Skills Development: A Roadmap for Empowerment (Dec. 2008): Ministry of Human Resource Development, Department