R E S E A R C H
Open Access
Functional hemodynamic tests: a
systematic review and a metanalysis on the
reliability of the end-expiratory occlusion
test and of the mini-fluid challenge in
predicting fluid responsiveness
Antonio Messina
1*, Antonio Dell
’
Anna
2,3, Marta Baggiani
4, Flavia Torrini
2,3, Gian Marco Maresca
2,3,
Victoria Bennett
5, Laura Saderi
6, Giovanni Sotgiu
6, Massimo Antonelli
2,3and Maurizio Cecconi
1,7Abstract
Background:Bedside functional hemodynamic assessment has gained in popularity in the last years to overcome the limitations of static or dynamic indexes in predicting fluid responsiveness. The aim of this systematic review and metanalysis of studies is to investigate the reliability of the functional hemodynamic tests (FHTs) used to assess fluid responsiveness in adult patients in the intensive care unit (ICU) and operating room (OR).
Methods:MEDLINE, EMBASE, and Cochrane databases were screened for relevant articles using a FHT, with the exception of the passive leg raising. The QUADAS-2 scale was used to assess the risk of bias of the included studies. In-between study heterogeneity was assessed through theI2indicator. Bias assessment graphs were plotted, and Egger’s regression analysis was used to evaluate the publication bias. The metanalysis determined the pooled area under the receiving operating characteristic (ROC) curve, sensitivity, specificity, and threshold for two FHTs: the end-expiratory occlusion test (EEOT) and the mini-fluid challenge (FC).
Results:After text selection, 21 studies met the inclusion criteria, 7 performed in the OR, and 14 in the ICU between 2005 and 2018. The search included 805 patients and 870 FCs with a median (IQR) of 39 (25–50) patients and 41 (30–52) FCs per study. The median fluid responsiveness was 54% (45–59). Ten studies (47.6%) adopted a gray zone analysis of the ROC curve, and a median (IQR) of 20% (15–51) of the enrolled patients was included in the gray zone. The pooled area under the ROC curve for the end-expiratory occlusion test (EEOT) was 0.96 (95%CI 0.92–1.00). The pooled sensitivity and specificity were 0.86 (95%CI 0.74–0.94) and 0.91 (95%CI 0.85–0.95), respectively, with a best threshold of
5% (4.0–8.0%). The pooled area under the ROC curve for the mini-FC was 0.91 (95%CI 0.85–0.97). The pooled
sensitivity and specificity were 0.82 (95%CI 0.76–0.88) and 0.83 (95%CI 0.77–0.89), respectively, with a best threshold of 5% (3.0–7.0%).
Conclusions: The EEOT and the mini-FC reliably predict fluid responsiveness in the ICU and OR. Other FHTs have been tested insofar in heterogeneous clinical settings and, despite promising results, warrant further investigations.
Keywords:Functional hemodynamic test, Fluid responsiveness, End-expiratory occlusion test, Mini-fluid challenge
© The Author(s). 2019Open AccessThis article is distributed under the terms of the Creative Commons Attribution 4.0 International License (http://creativecommons.org/licenses/by/4.0/), which permits unrestricted use, distribution, and reproduction in any medium, provided you give appropriate credit to the original author(s) and the source, provide a link to the Creative Commons license, and indicate if changes were made. The Creative Commons Public Domain Dedication waiver (http://creativecommons.org/publicdomain/zero/1.0/) applies to the data made available in this article, unless otherwise stated. * Correspondence:[email protected];[email protected]
1Department of Anesthesia and Intensive Care Medicine, Humanitas Clinical
and Research Center–IRCCS, Via Alessandro Manzoni, 56, 20089 Rozzano, MI, Italy
Introduction
Tailored fluid therapy has received increasing attention in the management of patients with acute circulatory failure in both the intensive care unit (ICU) and operating room (OR). The aim is to try and prevent both inadequate tissue perfusion and fluid overload [1]. Unnecessary fluid admin-istration has been associated with increased morbidity, mortality, and hospital length of stay in both critically ill and surgical patients [2–10].
The only physiological reason to give a fluid challenge (FC) to a patient with acute circulatory failure is to increase the stroke volume (SV) ultimately leading to an increase in oxygen transport [11–13]. However, this is only achieved in approximately 50% of ICU and OR patients [14, 15]. The prediction of fluid responsiveness prior to FC administra-tion is a topic of interest, which has been extensively inves-tigated, but remains challenging [1, 13, 16–18]. Bedside clinical signs, systemic pressures, and static volumetric variables poorly predict fluid responsiveness [17]. More-over, the values of the ventilator-induced dynamic changes in pulse pressure and stroke volume [pulse pressure vari-ation (PPV) and stroke volume varivari-ation (SVV), respect-ively] are often unreliable in a significant number of ICU and OR patients [19–21].
To overcome these limitations, bedside functional hemodynamic assessment has gained in popularity [17,
18, 22]. A functional hemodynamic test (FHT) consists of a maneuver that affects cardiac function and/or heart-lung interactions, with a subsequent hemodynamic re-sponse, the extent of which varies between fluid responders and non-responders [17,18,22].
The FHT called passive leg raise (PLR) has been success-fully used since 2009 to assess fluid responsiveness in ICU patients [23], as confirmed by three metanalyses [24–26]. Some conditions, however, including abdominal or intra-cranial hypertension and traumatic hip or lower limb frac-tures, limit the use of a PLR [27], and it is often unfeasible in the OR.
A number of different FHTs have been proposed as alternatives to the PLR, for use in both the ICU and more recently the OR. These tests can be subdivided into two groups. One subgroup of FHTs is based on the assessment of changes in systemic PPV and SVV or left ventricular SV in response to a predefined alteration in ventilatory settings. These tests rely on physiological heart-lung inter-actions, which can affect several cardiac properties. A change in respiratory dynamics alters venous return, lead-ing to changes in right ventricular preload, afterload, and subsequently left ventricular function. [23, 28]. A second subgroup of tests aims at testing the increase in SV after the rapid administration of a small aliquot of a predefined FC [29,30].
Since the reliability and the limits of PPV, SVV, and PLR in predicting fluid responsiveness have been already
extensively investigated in different clinical settings [15,
24–26, 31], we conducted a systematic review of the literature and performed a metanalysis aimed at asses-sing the overall quality, external validation, consistency, and risk of bias of the other FHTs available in both the ICU and OR.
Material and methods
Study selection and inclusion criteria
We included articles published in the English language, in indexed scientific journals, from 1966 to June 2018. Reviews, case reports, and studies published in abstract form were not included. Only studies performed in adults were eligible for inclusion.
Only studies that compared the reliability of the FHT to a FC, as the gold standard for assessing fluid responsiveness, were included. The definition of a FHT was a standardized hemodynamic maneuver af-fecting cardiac function and/or heart-lung interactions and used to assess fluid responsiveness. The definition of a FC was a fixed quantity of fluid administered in a defined time to change a hemodynamic variable by a predetermined threshold. We included only the follow-ing hemodynamic variables as potential indicators of a positive FC: cardiac output (CO); SV; their indexed values (CI and SVI) or SV surrogates, i.e., aortic velocity-time in-tegrals; and aortic blood flow, as assessed by either trans-thoracic or trans-esophageal echocardiography.
We excluded those studies in which FHTs were performed in patients with an open chest or with atrial fibrillation. We did not impose exclusion criteria re-garding the modality or the absence of mechanical ventilation.
Search strategy and data extraction
We independently searched the MEDLINE, EMBASE, and Cochrane Database of Systematic Reviews using the following search criteria: (fluid AND responsiveness) OR passive AND leg AND raising) OR end-expiratory AND occlusion AND test) OR pulse AND pressure AND variation) OR stroke AND volume AND variation) OR (dy-namic AND indices OR indexes)) OR mini-fluid challenge) OR functional AND hemodynamic AND monitoring) OR (fluid AND challenge). Filters: Humans; English; Adult: 19+ years.
further examination was performed by an expert (AM) and a conclusive decision was made.
We used a standardized data form to extract the data from all included studies, recording (1) the characteris-tics of the investigated population, (2) the methods used to perform the FHT test and to assess its hemodynamic effect, (3) the modalities of FC administration and the definition of fluid responsiveness, and (4) the area under the receiver operating characteristic (ROC) curve (AUC) and all the statistical data obtained by the ROC curve analysis (i.e., sensitivity, specificity, Youden index, positive and negative predictive values, positive and negative likelihood ratios). For those studies in which more than one method of hemodynamic monitoring was used to estimate flow parameters, we reported only the data obtained by the technique considered to be the most reliable, according to the following scale: pulmonary artery catheter or calibrated technique > cardiac echocardiog-raphy performed by experts (both transthoracic or trans-esophageal) > uncalibrated technique or esophageal Doppler probes > bioimpedance or bioreactance.
Assessment of risk of bias in the included studies
The QUADAS-2 scale was used to assess the risk of bias of the included studies [32]. Two expert authors (AM and MC) independently examined the studies using pre-defined criteria, which are reported in Additional file 1: Table S1.
For each criterion, the risk of bias was judged as high (3 points), unclear (2 points), or low (1 point). If the answers to all signaling questions for a domain were“yes,”then the risk of bias was judged as“low.”If any signaling question was answered“no,”the potential risk of bias was defined as indicated in Additional file1: Table S1. The sum of these points was used to calculate the global risk of bias.
Studies were included in the highest risk of bias group if the sum of the points obtained by the risk of bias and applicability judgment assessment was higher than the median value for all the studies.
Statistical analysis
Statistical analysis was conducted on the summary statis-tics described in the selected articles (e.g., means, me-dians, proportions), and therefore, the statistical unit of observation for all the selected variables was the single study and not the individual patients.
The descriptive statistics of individual studies used different statistical indicators for central tendency and variability, whereas absolute and relative frequencies were adopted for qualitative variables. Quantitative variables were summarized with means (standard deviation, SD) or medians (25th–75th interquartile range, IQR) according to their distribution.
For the selected studies, we planned to perform (1) a metanalysis in order to determine the pooled AUC and the pooled sensitivity and specificity of the FHT as a predictor of fluid responsiveness and (2) a metanalysis in order to determine the pooled correlation between the changes in the flow hemodynamic parameters after FHT and the changes after FC administration. The FC was the exposure variable, and clinical and hemodynamic charac-teristics were considered as the outcome variables. Fixed effect models were used. In-between study heterogeneity was assessed through the I2 indicator. Bias assessment graphs were plotted, and Egger’s regression analysis was used to evaluate the publication bias. Student’s t test or Mann-Whitney test for parametric or non-parametric distributions were respectively used to assess a difference in mean values between responders and non-responders.
Statistical analyses were conducted using GraphPad PRISM V6 (GraphPad Software Inc., San Diego, CA, USA) and STATA®13 (StataCorp, College Station, TX, USA). For all comparisons, we consideredpvalues < 0.05 significant.
Results
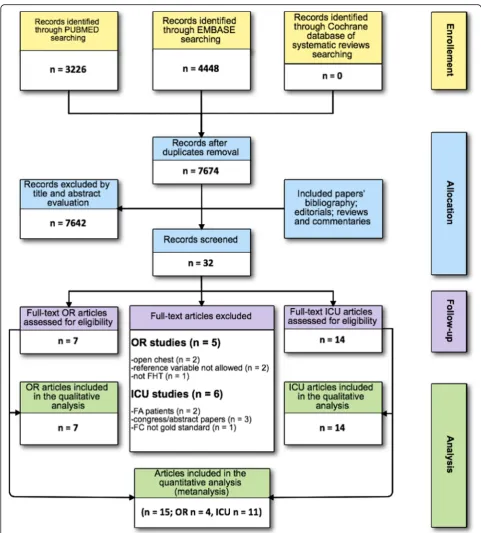
The electronic search identified 7674 titles. After the first assessment by two authors, 32 full-text manuscripts were included in the secondary analysis and 21 met the inclusion criteria: 7 performed in OR and 14 in ICU between 2005 and 2018. The senior examiner evaluated 177 of the 7524 (2%) potentially relevant studies because of disagreement between the two authors. A detailed description of the selection process flow is provided in Fig.1. We did not find any further relevant publications by reviewing the references of the selected studies, review articles, commentaries, or editorials regarding the use of FHTs.
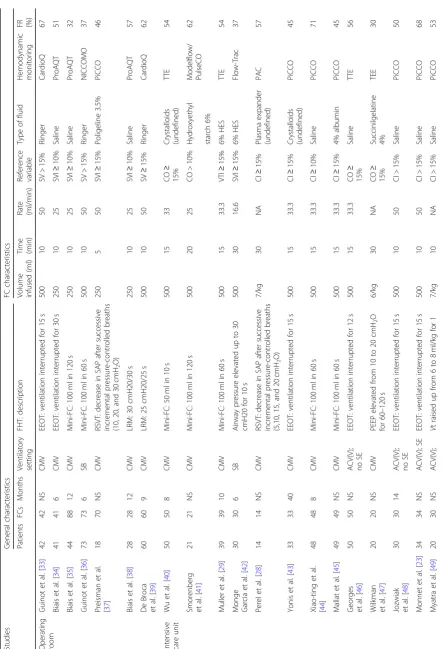
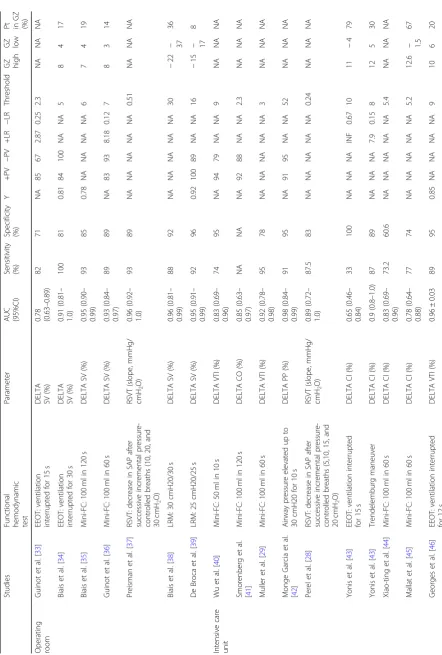
According to the search criteria, we identified seven different types of FHTs (see Table1):
1. An interruption of the mechanical ventilation for few seconds to determine an increase in right ventricle preload (the end-expiratory occlusion test EEOT) 2. A quick administration of an aliquot of 50–100 ml
of fluid to increase the SV (the mini-FC test) 3. The use of a lung recruitment maneuver (LRM) of
25–30 cmH20 to affect the hemodynamic response
of the right ventricle
4. The assessment of the systolic arterial pressure decrease after the use of successive incremental pressure-controlled breaths [the respiratory systolic variation test (RSVT)]
5. The assessment of the arterial pressure response during a Valsalva maneuver
7. An increase of the tidal volume from 6 to 8 ml/kg for 1 min to enhance the baseline reliability of the dynamic indexes of fluid responsiveness
All the studies were monocentric and, overall, included 805 patients and 870 FCs with a median (IQR) of 39 (25–50) patients and 41 (30–52) FCs per study. The
median (IQR) fluid responsiveness was 54% (45–60) and was not different between the OR and ICU studies [51% (37–62) vs. 54% (45–58), respectively; p= 0.81]. The hemodynamic values of responders and non-responders before FHT application in both the OR and ICU studies did not differ (see Additional file1: Table S2). Ten stud-ies (48%) adopted a gray zone analysis of the ROC curve,
[image:4.595.56.538.84.618.2]Table
1
Characteristics
of
the
functional
hemodynamic
tests
and
of
the
fluid
challenges
(Continued)
Studie
s
Gener
al
char
acteris
tics
FC
char
acte
ristics
Patients
FCs
Mont
hs
Venti
latory
setting
FHT:
desc
ription
Volu
me
inf
used
(ml)
Time (min)
Rat
e
(m
l/min)
Refere
nce
variable
Type
of
fluid
Hem
odynami
c
mon
itoring
FR (%)
no
SE
min
Monne
t
et
al.
[
50
]
54
54
NS
ACV(V)
;
no
SE
EEOT:
ventilation
interru
pted
for
15
s
50
0
20
25
CI
≥
15%
Sal
ine
PiCCO
55
FC
fluid
challenge,
CMV
controlled
mechanical
ventilation,
ACV(V)
volume-assist
controlled
mechanical
ventilation,
SB
spontaneously
breathing
patients,
SE
spontaneous
efforts,
EEOT
end-expiratory
occlusion
test,
Vt
tidal
volume,
MV
mechanical
ventilation,
LRM
lung
recruitment
maneuver,
RSVT
respiratory
systolic
variation
test,
SAP
systolic
arterial
pressure,
PEEP
positive
end-expiratory
pressure,
CO
cardiac
output,
CI
cardiac
index,
SV
stroke
volume,
SVI
stroke
volume
index,
FR
fluid
responsiveness,
HES
6%
hydroxyethyl
starch
6%,
TEE
trans-esophageal
echocardiograph
y,
TEE
transthoracic
echocardiograph
y,
PAC
pulmonary
artery
catheter;
NA
not
applicable;
CardioQ
,
Deltex
Medical
Ltd.,
Chichester,
UK;
PiCCO/ProAQT
,
PULSION
Medical
Systems;
FloTrac
,
Edwards
Lifesciences,
Irvine,
CA,
USA;
NICCOMO
,
non-invasive
continuous
cardiac
output,
Imedex,
France;
PulseCO
,
LiDCOltg,
Cambridge,
UK;
Modelflow
,
FMS,
Amsterdam,
the
and a median (IQR) of 20% (15–51) of the enrolled patients was included in the gray zone.
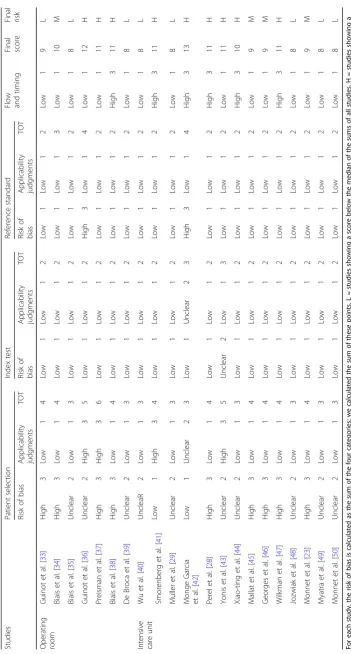
Overall, the median (IQR) QUADAS-2 score of the included studies was 9 (8–11) and was not different between the OR and ICU [10 (8–11) vs. 9 (8–11), respect-ively;p= 0.67]. Three OR studies (43%) and six ICU stud-ies (43%) were classified in the subgroup with the highest risk of bias (see Table2).
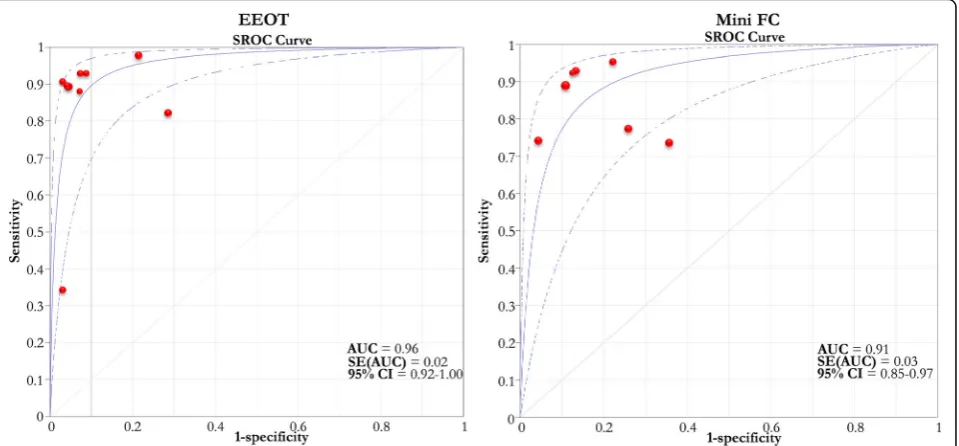
Metanalysis of the included studies (see Figs.2,3, and4) The pooled AUC of the EEOT from two studies conducted in the OR [33,34] and six [23, 43,46, 48–50] in the ICU was 0.96 (95%CI 0.92–1.00). The pooled sensitivity of the test was 0.86 (95%CI 0.74–0.94), withI2of 75% (95%CI 43–85%), and the pooled specificity was 0.91 (95%CI 0.85–0.95), withI2of 35% (95%CI 0–69%). The median threshold identified was a 5% (4–8%) increase in the
Fig. 2Pooled ROC curves of EEOT and mini-FC. Pooled receiver operating characteristic (ROC) curves of end-expiratory occlusion test (EEOT) [left panel,
eight studies, area under the ROC curve = 0.96 (solid blue line) (95%CI 0.92–1.00; dashed blue lines)] and mini-fluid challenge (mini-FC) [right panel, seven
studies, area under the ROC curve = 0.91 (solid blue line) (95%CI 0.85–0.97; dashed blue lines)] constructed by considering the hemodynamic effects of
the EEOT or mini-FC on stroke volume or its surrogates and those induced by fluid challenge administration. Red circles represent each study included
in the metanalysis and the size of each solid circle indicates the size of each study (software MetaDiSC®, version 1.4, see text and Table3for details)
Fig. 3EEOT forest plot of included studies. Forest plot reporting the pooled sensitivity and specificity (green diamonds) of the end-expiratory
occlusion test (EEOT) in predicting of fluid responsiveness by considering the changes in stroke volume or its surrogates after the test and those induced by fluid challenge administration. Black squares represent the values of sensitivity and specificity (with 95% confidence intervals; black
lines) of each study included in the metanalysis, and the size of each square indicates the size of each study. The definitions Monnet et al.“a”
[image:8.595.60.540.89.312.2] [image:8.595.54.540.493.675.2]considered variable. The funnel plot of the included studies testing the EEOT shows a significant likelihood of publication bias (see Additional file 1: Figures S1 and S2).
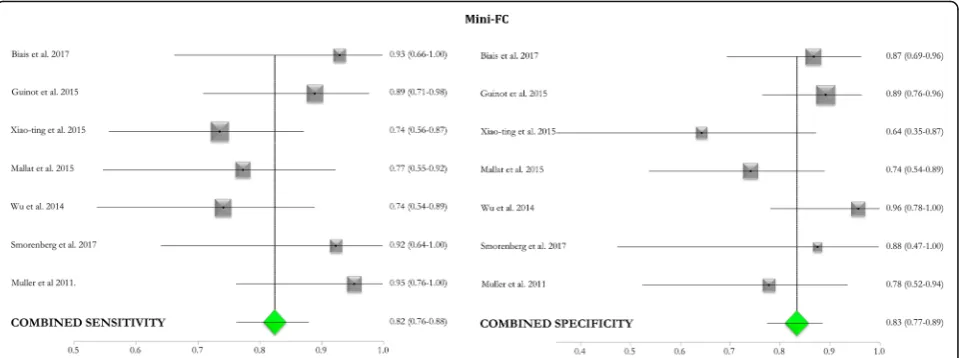
The pooled AUC of the mini-FC obtained from two studies conducted in the OR [35, 36] and five [29, 40,
41,44, 45] in the ICU was 0.91 (95%CI 0.85–0.97). The pooled sensitivity of the test was 0.82 (95%CI 0.76–0.88), withI2of 26.9% (95%CI 0–69%), and pooled specificity was 0.83 (95%CI 0.77–0.89), with I2 of 34% (95%CI 0–71%). The median threshold identified was a 5% (3.0–7.0%) increase in the considered variable.
The funnel plot for the included studies testing the mini-FC shows a small likelihood of publication bias (see Additional file 1: Figures S3 and S4). Moreover, it was possible to calculate a pooled correlation of r= 0.68 (95%CI 0.41–0.84) between the changes in the cardiac flow parameters after mini-FC application and after FC administration from data obtained from 6 studies [29,
36,40,41,44,45].
Discussion
The main findings of this systematic review conducted in ICU and OR patients are as follows: (1) the EEOT and the mini-FC have been tested in the OR and ICU and shown good sensitivity and specificity for predicting fluid responsiveness; (2) currently, the literature provides insufficient data regarding the other FHTs to assess a pooled quantification of their reliability in predicting fluid responsiveness; and (3) publication bias, small-sized study effects, and methodological heterogeneity of the individual studies should be considered.
EEOT
Of the tests studied, the EEOT showed the highest sensitivity and specificity [pooled AUC of 0.96 (95%CI 0.92–1.00); pooled sensitivity and specificity of 0.86 (95%CI 0.74–0.94) and 0.91 (95%CI 0.85–0.95), respect-ively, with a best threshold of 5% (4.0–8.0%) of increase in SV or its surrogates; see Fig. 3 and Table 3]. In the two studies reporting an AUC higher than 0.90, the percentage of patients included in the gray zone was 17–20% [34,46] (see Table3).
This FHT was first proposed by Monnet et al. [23] and predicts fluid responsiveness by assessing changes in CO, or its surrogates, following a few second interruption to mechanical ventilation. In preload-dependent patients, this maneuver increases venous return and right ventricu-lar and then subsequently left ventricuventricu-lar stroke volume. The potential drawbacks of this FHT include that it may be limited by patient positioning, the baseline tidal volume ventilation adopted, and the hemodynamic effects of residual spontaneous breathing efforts. Only one study used the EEOT to assess fluid responsiveness in prone ICU patients with moderate ARDS, reporting an AUC of 0.65 (0.46–0.84) [43]. Prone positioning affects the venous return by compressing the inferior cava vein and changing the intra-abdominal pressure [51–53], which may reduce the changes in CO and SV seen in response to the ventila-tory challenge and limit the reliability of the EEOT.
The change in intrathoracic pressure may be insufficient to adequately increase right ventricular preload when a lung-protective ventilation strategy is used. Also, if the neural trigger for ventilation is preserved, a 15- to 30-s expiratory hold would result in a progressive increase in inspiratory pressure [54], affecting the venous return and
Fig. 4Mini-FC forest plot of included studies. Forest plot reporting the pooled sensitivity and specificity (green diamonds) of the mini-fluid
[image:9.595.59.539.88.267.2]the reliability of the FHT. Unfortunately, data regarding these issues is limited and contradictory.
In the OR, the EEOT performed better in a study using a mean tidal volume of 6.8 ml/kg [34], when compared to another study using 8.2 ml/kg [33]. In the ICU, the median tidal volume in those studies enrolling supine patients was 6.8 ml/kg (6.1–7.3). The EEOT failed to predict fluid responsiveness in the study of Myatra et al. using a 6-ml/ kg ventilation [49], whereas Jozwiak et al. reported an AUC of 0.98 (0.85–1.0) using a 6.2-ml/kg ventilation. Interestingly, these two latter studies reported a compar-able mean total respiratory system compliance in the enrolled patients (28 vs. 36 ml/cmH2O, respectively).
Monnet et al. reported an EEOT failure as high as 22.5%, due to the patient effort against an occluded airway [23]. However, none of the other studies using this FHT re-ported this failure rate. Four of the five studies rere-ported no spontaneous breathing activity during assisted-controlled ventilation (see Table1), implying the level of sedation was inhibiting neural triggering. None of these studies reported a flowchart showing the overall number of excluded pa-tients, limiting the assessment of EEOT reliability during visible spontaneous breathing activity, which is a potential drawback for assessing fluid responsiveness.
Mini-FC
The mini-FC showed a pooled AUC of 0.91 (95%CI 0.85–0.97). The pooled sensitivity and specificity were 0.82 (95%CI 0.76–0.88) and 0.83 (95%CI 0.77–0.89), respectively, with a best threshold of 5% (3.0–7.0%) increase in SV or its surrogates, see Fig. 4and Table3. These values of the pooled ROC curve imply a moder-ate overlap in the distribution of responders and non-responders.
In the two studies reporting an AUC higher than 0.90, the percentage of patients included in the gray zone was approximately 14–19% [35,36] (see Table3). Moreover, the performance of this FHT was comparable under stable con-ditions in the OR (using uncalibrated tools) and in more unstable ICU patients (using calibrated tools) (see Table1).
The dose of the mini-FC was not fixed. Most of the studies used a bolus of 100 ml infused over 60 s, but Wu et al. demonstrated that a 10% of change in SV following the infusion of a 50-ml bolus in 10 s reliably predicted fluid responsiveness [40].
Some may argue that the mini-FC should not be consid-ered an appropriate FHT, since the response to the first small aliquot of fluids is actually included into the response to the final volume administered, therefore not predicting the response to the whole FC, but only to a part of it. How-ever, recent studies have shown different components of FC, related to the response (the extent of SV increase) and sustainability of the hemodynamic effect (the effect of SV over time) [55–57]. The mini-FC allows a dynamic
evaluation of fluid administration, preventing inappropriate administration and allowing a tailored infusion. Moreover, this FHT has been also used in a different functional man-ner. In fact, Mallat et al. [45] demonstrated that a reduc-tion in PPV [AUC = 0.92 (0.81–0.98)] or SVV [AUC = 0.91 (0.80–0.97)] following a mini-FC test was a better predictor of fluid responsiveness than an increase in CO. The cut-offs identified by the ROC curve for the changes in PPV and SVV are even smaller (2.0%) than the changes in CO (5.2%), implying a high precision of measurement, which-ever hemodynamic tool is used.
Other FTHs
All the other FHTs reported in the literature affect both right ventricular preload and afterload, by briefly altering intrathoracic pressure and, as a consequence, venous return and pulmonary vascular resistance.
The RSVT is based on the delivery of consecutive pres-sure-controlled inspiratory breaths, using incremental peak inspiratory pressures (up to 30 cmH2O) and plotting the minimal values of the systolic arterial pressure recorded after each breath against the related airway pressures (off-line slope calculation) [28, 37]. Despite promising results obtained in both the OR and ICU [28,37], the integration of respiratory and hemodynamic signals required to allow an online computation of the RSVT has never been achieved at the bedside.
Raising intrathoracic pressure by increasing peak inspira-tory pressure using either a Valsalva maneuver [42]or the end-expiratory occlusion pressure [47] or by performing a LRM are all FHTs that induce a sudden change in right ventricular preload and afterload. LRMs have been success-fully applied in the OR, showing a comparable AUC in neurosurgery [38] and general abdominal surgery [39]. However, Biais et al. found that the best threshold to define fluid responsiveness was a 30% reduction in SV, but De Broca et al. showed only a 16% reduction was required [39], suggesting caution in the interpretation on this FHT.
Finally, more recently, Myatra et al. successfully enhanced the reliability of baseline indexes of fluid responsiveness by increasing the tidal volume from 6 to 8 ml/kg for 1 min (the tidal volume challenge) [49]. This simple and quick FHT could be used in patients undergoing protective venti-lation but should be tested in larger ICU popuventi-lations both with and without spontaneous breathing activity.
Bedside application
Limitations
The comparability of the included studies is limited by the heterogeneity of FC administration used as the reference point (see Table 1). Aya et al. have previously demon-strated that a FC should be at least 4 ml/kg [55]. For this reason, some patients enrolled in those studies adopting a smaller dose of FC (3.7 ml/kg [34]; 3.3 ml/kg [35,38]) may be underchallenged, which may have affected the observed rate of fluid responsiveness and, in turn, the ROC curve construction.
Another potential source of bias is related to the differ-ent hemodynamic tools used to assess both fluid respon-siveness and FHT reliability. In fact, when considering the median cutoff value identifying responders from non-re-sponders (about 5% for both the EEOT and the mini-FC), the accuracy of measurement of the changes in CO, or its surrogates, is of pivotal importance. For example, the nega-tive results of Guinot et al. [33], conducted in the OR, have been questioned as the esophageal Doppler does not meas-ure the change in aortic diameter and could therefore underestimate the change in SV during either the EEOT or the FC [59].
Additionally, the reliability of different calibrated and un-calibrated tools in tracking the dynamic trends of CO may not be consistent and may be below the boundaries of the accuracy and precision of the Critchley-Critchley criteria [60,61]. For instance, the reproducibility of the measure-ments obtained by the different hemodynamic tools has never been reported in the included studies. This implies that small changes in CO, or its surrogates, after a FHT
may be inaccurately detected in the OR, where the hemodynamic monitoring is usually performed with un-calibrated tools, whereas the use of un-calibrated techniques by means of thermodilution could reduce the risk of im-precise measurements in ICU.
All the included studies had a small-sized single-cen-ter design and enrolled a median number of patients rather small [39 (IQR 25–50)], and about 43% of the included studies were classified in the subgroup with the highest risk of bias, mainly because of the draw-backs related to the patient selection, according to the QUADAS-2 score (see Table 2). This limitation along with the use of different cutoff values, thresholds, and measurement techniques to assess fluid responsiveness potentially produced heterogeneity in the response to the FC administration. As confirmed, the proportion of responders ranged between 30 and 71% across the included studies. The bedside application is also limited in those potentially misclassified patients (roughly 20% in the reported studies) included in the gray zone of the ROC curve, where the predictive power of the FHT is rather low. Another source of heterogeneity may be related to the different sample sizes of the included studies, as confirmed by the large interquartile ranges of theI2
. Finally, we did not include non-full-text stud-ies, studies not in English, and unpublished studstud-ies, and this systematic review was not prospectively registered in PROSPERO, an international database of systematic reviews in health and social care, increasing the overall risk of reporting bias.
Fig. 5Clinical algorithm for EEOT and mini-FC application in the ICU and the OR. In the OR, FHTs can be added to the dynamic indexes evaluation,
considering the gray zone reported in the literature [21]. When PPV or SVV values range within the gray zone, we suggest the use of the EEOT, as the
first step. A clear positive response (SV increase > 5%) suggests fluid responsiveness, whereas a negative/uncertain response could be further investigated by the consequent use of the mini-FC, as indicated. In critically ill patients, the need of FC administration is often evaluated combining different signs
and measurements [58]. In this context, the EEOT (in patient undergoing controlled mechanical ventilation) and the mini-FC (in patients retaining to
some extent a spontaneous breathing effort) can be useful when the PLR is unsuitable.*We suggest a FC of 4 ml/kg [55] over 10 min. **Intra-abdominal
[image:13.595.59.538.88.258.2]For all these key aforementioned reasons, despite the in-creasing number of studies in this field, the clinical applic-ability and utility of the FTHs should be assessed by a large multicentric trial. Although pooling a few data from studies carried out in different settings could bias the interpret-ation of the findings, the identificinterpret-ation of the current evidence, associated to a careful assessment of the con-founding factors, could help in designing future studies.
Conclusions
Both the EEOT and the mini-FC showed good sensitiv-ity and specificsensitiv-ity in predicting fluid responsiveness in the OR and ICU. The different methods of FC admin-istration used as the reference standard and the differ-ent hemodynamic tools used to track hemodynamic changes with each FHT limit the comparability of the studies. Other promising FHTs should be tested in larger populations.
Additional files
Additional file 1:Table S1.Definition of potential bias for the enrolled
studies.Table S2.Baseline hemodynamic parameters before FHT application
in responders and non-responders.Figure S1.Funnel plot for publication bias
analysis of sensitivity of the end-expiratory occlusion test (EEOT).Figure S2.
Funnel plot for publication bias analysis of specificity of the end-expiratory
occlusion test (EEOT).Figure S3.Funnel plot for publication bias analysis of
sensitivity of the mini-fluid challenge test (mini-FC).Figure S4.Funnel plot for
publication bias analysis of specificity of the mini-fluid challenge test (Mini-FC) (DOCX 3448 kb)
Abbreviations
AUC:Area under the ROC curve; CI: Cardiac index; EEO: End-expiratory
occlusion test; FC: Fluid challenge; FHT: Functional hemodynamic test;
ICU: Intensive care unit; IQR: 25th–75th interquartile range; LRM: Lung
recruitment maneuver; OR: Operating room; PLR: Passive leg raising; PPV: pulse pressure variation; ROC: Receiver operating characteristic; RSVT: Respiratory systolic variation test; SD: Standard deviation; SV: Stroke volume; SVI: Stroke volume index; SVV: Stroke pressure variation
Acknowledgements
Not applicable.
Authors’contributions
AM designed the study, conducted the data collection, and drafted the
manuscript; AD’A, BM, TF, and MG performed the data collection and helped
in the manuscript preparation and data analysis. VB helped in the manuscript preparation, grammatical revision, and data analysis. GS and LS performed the statistical analysis and helped in the data collection and in the manuscript preparation. MA and MC helped in the data analysis and in the manuscript preparation. All the authors approved the final version of the paper and agree to be accountable for all aspects of the work thereby ensuring that questions related to the accuracy or integrity of any part of the work are appropriately investigated and resolved.
Funding
This work has not been funded by an external source.
Availability of data and materials
The datasets used and/or analyzed during the current study are available from the corresponding author on reasonable request.
Ethics approval and consent to participate
Not applicable.
Consent for publication
Not applicable.
Competing interests
The authors declare that they have no competing interests.
Author details
1Department of Anesthesia and Intensive Care Medicine, Humanitas Clinical
and Research Center–IRCCS, Via Alessandro Manzoni, 56, 20089 Rozzano, MI, Italy.2Department of Anesthesiology and Intensive Care Medicine,
Catholic University of the Sacred Heart, Fondazione“Policlinico Universitario A. Gemelli”, Rome, Italy.3Fondazione Policlinico Universitario A. Gemelli
IRCCS, Rome, Italy.4Department of Anesthesiology and Intensive Care
Medicine, A.O.U. Maggiore della Carità, Novara, Italy.5Department of
Intensive Care Medicine, St George’s University Hospital NHS Foundation Trust, London, UK.6Clinical Epidemiology and Medical Statistics Unit,
Department of Biomedical Sciences, University of Sassari, Research, Medical Education and Professional Development Unit, AOU Sassari, Sassari, Italy.
7
Department of Biomedical Sciences, Humanitas University, Pieve Emanuele, MI, Italy.
Received: 22 March 2019 Accepted: 17 July 2019
References
1. Cecconi M, De Backer D, Antonelli M, Beale R, Bakker J, Hofer C, et al.
Consensus on circulatory shock and hemodynamic monitoring. Task Force of the European Society of Intensive Care Medicine. Intensive Care Med.
2014;40:1795–815.
2. Holte K, Kehlet H. Fluid therapy and surgical outcomes in elective
surgery: a need for reassessment in fast-track surgery. J Am Coll Surg.
2006;202:971–89.
3. Boyd JH, Forbes J, Nakada TA, Walley KR, Russell JA. Fluid resuscitation in
septic shock: a positive fluid balance and elevated central venous pressure
are associated with increased mortality. Crit Care Med. 2011;39:259–65.
4. National Heart L, Blood Institute Acute Respiratory Distress Syndrome
Clinical Trials N, Wiedemann HP, Wheeler AP, Bernard GR, Thompson BT, et al. Comparison of two fluid-management strategies in acute lung injury.
NEJM. 2006;354:2564–75.
5. Cecconi M, Corredor C, Arulkumaran N, Abuella G, Ball J, Grounds RM, et al.
Clinical review: goal-directed therapy-what is the evidence in surgical patients? The effect on different risk groups. Crit care. 2013;17:209.
6. Hamilton MA, Cecconi M, Rhodes A. A systematic review and meta-analysis
on the use of preemptive hemodynamic intervention to improve postoperative outcomes in moderate and high-risk surgical patients. Anesth
Analg. 2011;112:1392–402.
7. Lobo SM, de Oliveira NE. Clinical review: what are the best hemodynamic
targets for noncardiac surgical patients? Crit Care. 2013;17:210.
8. Marik PE. Perioperative hemodynamic optimization: a revised approach. J
Clin Anesth. 2014;26:500–5.
9. Voldby AW, Brandstrup B. Fluid therapy in the perioperative setting-a
clinical review. J Intensive Care. 2016;4:27.
10. Thacker JK, Mountford WK, Ernst FR, Krukas MR, Mythen MM. Perioperative
fluid utilization variability and association with outcomes: considerations for enhanced recovery efforts in sample us surgical populations. Ann Surg.
2016;263:502–10.
11. Cecconi M, Hofer C, Teboul JL, Pettila V, Wilkman E, Molnar Z, et al. Fluid
challenges in intensive care: the FENICE study: a global inception cohort
study. Intensive Care Med. 2015;41:1529–37.
12. Cecconi M, Parsons AK, Rhodes A. What is a fluid challenge? Curr Opin Crit
Care. 2011;17:290–5.
13. Vincent JL, Weil MH. Fluid challenge revisited. Crit Care Med. 2006;34:
1333–7.
14. Messina A, Longhini F, Coppo C, Pagni A, Lungu R, Ronco C, et al. Use of
the fluid challenge in critically ill adult patients: a systematic review. Anesth
Analg. 2017;125(5):1532–43.
15. Messina A, Pelaia C, Bruni A, Garofalo E, Bonicolini E, Longhini F, et al. Fluid
challenge during anesthesia: a systematic review and meta-analysis. Anesth
Analg. 2018;127:1353–64.
16. Vincent JL.“Let’s give some fluid and see what happens”versus the“
17. Pinsky MR. Functional hemodynamic monitoring. Crit Care Clin. 2015;
31:89–111.
18. Pinsky MR, Payen D. Functional hemodynamic monitoring. Crit Care. 2005;9:
566–72.
19. Biais M, Ehrmann S, Mari A, Conte B, Mahjoub Y, Desebbe O, et al.
Clinical relevance of pulse pressure variations for predicting fluid responsiveness in mechanically ventilated intensive care unit patients: the grey zone approach. Crit Care. 2014;18:587.
20. Mahjoub Y, Lejeune V, Muller L, Perbet S, Zieleskiewicz L, Bart F, et al.
Evaluation of pulse pressure variation validity criteria in critically ill patients: a prospective observational multicentre point-prevalence study. Br J
Anaesth. 2014;112:681–5.
21. Cannesson M, Le Manach Y, Hofer CK, Goarin JP, Lehot JJ, Vallet B, et al.
Assessing the diagnostic accuracy of pulse pressure variations for the
prediction of fluid responsiveness: a“gray zone”approach. Anesthesiology.
2011;115:231–41.
22. Hadian M, Pinsky MR. Functional hemodynamic monitoring. Curr Opin Crit
Care. 2007;13:318–23.
23. Monnet X, Osman D, Ridel C, Lamia B, Richard C, Teboul JL. Predicting
volume responsiveness by using the end-expiratory occlusion in mechanically ventilated intensive care unit patients. Crit Care Med.
2009;37:951–6.
24. Cherpanath TG, Hirsch A, Geerts BF, Lagrand WK, Leeflang MM, Schultz
MJ, et al. Predicting fluid responsiveness by passive leg raising: a systematic review and meta-analysis of 23 clinical trials. Crit Care Med.
2016;44:981–91.
25. Monnet X, Marik P, Teboul JL. Passive leg raising for predicting fluid
responsiveness: a systematic review and meta-analysis. Intensive Care Med.
2016;42:1935–47.
26. Cavallaro F, Sandroni C, Marano C, La Torre G, Mannocci A, De Waure C, et
al. Diagnostic accuracy of passive leg raising for prediction of fluid responsiveness in adults: systematic review and meta-analysis of clinical
studies. Intensive Care Med. 2010;36:1475–83.
27. Monnet X, Teboul JL. Passive leg raising: five rules, not a drop of fluid! Crit
Care. 2015;19:18.
28. Perel A, Minkovich L, Preisman S, Abiad M, Segal E, Coriat P. Assessing
fluid-responsiveness by a standardized ventilatory maneuver: the respiratory
systolic variation test. Anesth Analg. 2005;100:942–5.
29. Muller L, Toumi M, Bousquet PJ, Riu-Poulenc B, Louart G, Candela D, et al.
An increase in aortic blood flow after an infusion of 100 ml colloid over 1 minute can predict fluid responsiveness: the mini-fluid challenge study.
Anesthesiology. 2011;115:541–7.
30. Marik PE. Fluid therapy in 2015 and beyond: the mini-fluid challenge and
mini-fluid bolus approach. Br J Anaesth. 2015;115:347–9.
31. Marik PE, Cavallazzi R, Vasu T, Hirani A. Dynamic changes in arterial
waveform derived variables and fluid responsiveness in mechanically ventilated patients: a systematic review of the literature. Crit Care Med.
2009;37:2642–7.
32. Whiting PF, Rutjes AW, Westwood ME, Mallett S, Deeks JJ, Reitsma JB, et al.
Quadas-2: a revised tool for the quality assessment of diagnostic accuracy
studies. Ann Intern Med. 2011;155:529–36.
33. Guinot PG, Godart J, de Broca B, Bernard E, Lorne E, Dupont H.
End-expiratory occlusion manoeuvre does not accurately predict fluid
responsiveness in the operating theatre. Br J Anaesth. 2014;112:1050–4.
34. Biais M, Larghi M, Henriot J, de Courson H, Sesay M, Nouette-Gaulain K.
End-expiratory occlusion test predicts fluid responsiveness in patients with protective ventilation in the operating room. Anesth Analg. 2017;
125:1889–95.
35. Biais M, de Courson H, Lanchon R, Pereira B, Bardonneau G, Griton M,
et al. Mini-fluid challenge of 100 ml of crystalloid predicts fluid
responsiveness in the operating room. Anesthesiology. 2017;127:450–6.
36. Guinot PG, Bernard E, Defrancq F, Petiot S, Majoub Y, Dupont H, et al.
Mini-fluid challenge predicts fluid responsiveness during spontaneous breathing under spinal anaesthesia: an observational study. Eur J
Anaesthesiol. 2014;32:645–9.
37. Preisman S, Kogan S, Berkenstadt H, Perel A. Predicting fluid
responsiveness in patients undergoing cardiac surgery: functional haemodynamic parameters including the respiratory systolic variation
test and static preload indicators. Br J Anaesth. 2005;95:746–55.
38. Biais M, Lanchon R, Sesay M, Le Gall L, Pereira B, Futier E, et al. Changes in
stroke volume induced by lung recruitment maneuver predict fluid
responsiveness in mechanically ventilated patients in the operating room.
Anesthesiology. 2017;126:260–7.
39. De Broca B, Garnier J, Fischer MO, Archange T, Marc J, Abou-Arab O, et al.
Stroke volume changes induced by a recruitment maneuver predict fluid responsiveness in patients with protective ventilation in the operating theater. Medicine (Baltimore). 2016;95:e4259.
40. Wu Y, Zhou S, Zhou Z, Liu B. A 10-second fluid challenge guided by
transthoracic echocardiography can predict fluid responsiveness. Crit Care. 2014;18:R108.
41. Smorenberg A, Cherpanath TGV, Geerts BF, de Wilde RBP, Jansen JRC, Maas
JJ, et al. A mini-fluid challenge of 150ml predicts fluid responsiveness using modelflow(r) pulse contour cardiac output directly after cardiac surgery. J
Clin Anesth. 2018;46:17–22.
42. Monge Garcia MI, Gil Cano A, Diaz Monrove JC. Arterial pressure
changes during the valsalva maneuver to predict fluid responsiveness
in spontaneously breathing patients. Intensive Care Med. 2009;35:77–84.
43. Yonis H, Bitker L, Aublanc M, Perinel Ragey S, Riad Z, Lissonde F, et al.
Change in cardiac output during Trendelenburg maneuver is a reliable predictor of fluid responsiveness in patients with acute respiratory distress syndrome in the prone position under protective ventilation. Crit Care. 2017;21:295.
44. Xiao-ting W, Hua Z, Da-wei L, Hong-min Z, Huai-wu H, Yun L, et al. Changes
in end-tidal co2 could predict fluid responsiveness in the passive leg raising test but not in the mini-fluid challenge test: a prospective and observational
study. J Crit Care. 2015;30:1061–6.
45. Mallat J, Meddour M, Durville E, Lemyze M, Pepy F, Temime J, et al.
Decrease in pulse pressure and stroke volume variations after mini-fluid challenge accurately predicts fluid responsiveness. Br J Anaesth. 2015;115:
449–56.
46. Georges D, de Courson H, Lanchon R, Sesay M, Nouette-Gaulain K, Biais
M. End-expiratory occlusion maneuver to predict fluid responsiveness in the intensive care unit: an echocardiographic study. Crit Care. 2018; 22:32.
47. Wilkman E, Kuitunen A, Pettila V, Varpula M. Fluid responsiveness predicted
by elevation of peep in patients with septic shock. Acta Anaesthesiol Scand.
2014;58:27–35.
48. Jozwiak M, Depret F, Teboul JL, Alphonsine JE, Lai C, Richard C, et al.
Predicting fluid responsiveness in critically ill patients by using combined end-expiratory and end-inspiratory occlusions with echocardiography. Crit
Care Med. 2017;45:e1131–8.
49. Myatra SN, Prabu NR, Divatia JV, Monnet X, Kulkarni AP, Teboul JL. The
changes in pulse pressure variation or stroke volume variation after a“tidal
volume challenge”reliably predict fluid responsiveness during low tidal
volume ventilation. Crit Care Med. 2017;45:415–21.
50. Monnet X, Bleibtreu A, Ferre A, Dres M, Gharbi R, Richard C, et al. Passive
leg-raising and end-expiratory occlusion tests perform better than pulse pressure variation in patients with low respiratory system compliance. Crit
Care Med. 2012;40:152–7.
51. Edgcombe H, Carter K, Yarrow S. Anaesthesia in the prone position. Br J
Anaesth. 2008;100:165–83.
52. Sudheer PS, Logan SW, Ateleanu B, Hall JE. Haemodynamic effects of the
prone position: a comparison of propofol total intravenous and inhalation
anaesthesia. Anaesthesia. 2006;61:138–41.
53. Wadsworth R, Anderton JM, Vohra A. The effect of four different surgical
prone positions on cardiovascular parameters in healthy volunteers.
Anaesthesia. 1996;51:819–22.
54. Truwit JD, Marini JJ. Validation of a technique to assess maximal inspiratory
pressure in poorly cooperative patients. Chest. 1992;102:1216–9.
55. Aya HD, Ster IC, Fletcher N, Grounds RM, Rhodes A, Cecconi M.
Pharmacodynamic analysis of a fluid challenge. Crit Care Med. 2016;44:
880–91.
56. Toscani L, Aya HD, Antonakaki D, Bastoni D, Watson X, Arulkumaran N,
et al. What is the impact of the fluid challenge technique on diagnosis of fluid responsiveness? A systematic review and meta-analysis. Crit Care. 2017;21:207.
57. Aya HD, Rhodes A, Chis Ster I, Fletcher N, Grounds RM, Cecconi M.
Hemodynamic effect of different doses of fluids for a fluid challenge: a
quasi-randomized controlled study. Crit Care Med. 2017;45:e161–8.
58. Messina A, Greco M, Cecconi M. What should I use next if clinical evaluation
and echocardiographic haemodynamic assessment is not enough? Curr
59. Monnet X, Teboul JL. End-expiratory occlusion test: please use the
appropriate tools! Br J Anaesth. 2015;114:166–7.
60. Critchley LA, Critchley JA. A meta-analysis of studies using bias and
precision statistics to compare cardiac output measurement techniques. J
Clin Monit Comput. 1999;15:85–91.
61. Hadian M, Kim HK, Severyn DA, Pinsky MR. Cross-comparison of cardiac
output trending accuracy of lidco, picco, flotrac and pulmonary artery catheters. Crit Care. 2010;14:R212.
Publisher’s Note
![Fig. 5 Clinical algorithm for EEOT and mini-FC application in the ICU and the OR. In the OR, FHTs can be added to the dynamic indexes evaluation,considering the gray zone reported in the literature [21]](https://thumb-us.123doks.com/thumbv2/123dok_us/8344050.306886/13.595.59.538.88.258/clinical-algorithm-application-dynamic-evaluation-considering-reported-literature.webp)
