R E S E A R C H A R T I C L E
Open Access
Twin epidemics of new and prevalent
hepatitis C infections in Canada: BC
Hepatitis Testers Cohort
Naveed Zafar Janjua
1,2*, Amanda Yu
1, Margot Kuo
1, Maria Alvarez
1, Darrel Cook
1, Jason Wong
1,
Mark W. Tyndall
1,2and Mel Krajden
1,3Abstract
Background:We characterized the twin epidemics of new and prevalent hepatitis C virus (HCV) infections in British Columbia, Canada to inform prevention, care and treatment programs.
Methods:The BC Hepatitis Testers Cohort (BC-HTC) includes individuals tested for HCV, HIV or reported as a case of HBV, HCV, HIV or active TB between 1990–2013 linked with data on their medical visits, hospitalizations, cancers, prescription drugs and mortality. Prevalent infection was defined as being anti-HCV positive at first test. Those with a negative test followed by a positive test were considered seroconverters or new infections.
Results:Of 1,132,855 individuals tested for HCV, 64,634 (5.8 %) were positive and an additional 3092 cases tested positive elsewhere for a total of 67,726. Of 55,781 HCV positive individuals alive at the end of 2013, 7064 were seroconverters while 48,717 had prevalent infection at diagnosis. The HCV positivity rate (11.2 %) was highest in birth cohort 1945–1964 which declined over time. New infections were more likely to be male, 15–34 years of age (born 1965-1984), HIV- or HBV-coinfected, socioeconomically disadvantaged, have problematic drug and alcohol use and a mental health illness. The profile was similar for individuals with prevalent infection, except for lower odds of HBV-coinfection, major mental health diagnoses and birth cohort >1975.
Conclusions:The HCV positivity rate is highest in birth cohort 1945–1964 which represents most prevalent infections. New infections occur in younger birth cohorts who are commonly coinfected with HIV and/or HBV, socioeconomically marginalized, and living with mental illness and addictions.
Keywords:HCV, Hepatitis B, HIV, Epidemiology, Screening, Cohort study
Background
Hepatitis C virus (HCV) is a major global public health problem. Worldwide, approximately 184 mil-lion people are infected [1], and in Canada, 210,753– 461,517 (0.66 %-1.3 %) people are estimated to be infected with HCV [2]. In British Columbia (BC), the an-nual rate of newly identified HCV cases is about 50 % higher than the national average [3]. Untreated HCV infected individuals have a ~5-fold increased all-cause and ~20-fold increased risk of liver-related mortality
[4]. While treatment reduces both morbidity and mortality, only about 10 % of infected individuals have been treated in BC [5]. Newer well-tolerated and highly effective direct acting antiviral agents, with cure rate approaching 95 %, are expected to provide new opportunities to prevent progressive liver disease [6, 7]. However, a large number of people are unaware of their infection [2, 8]. Characterising individuals who have been tested and who test positive can help identify prevention, testing, care and treatment strategies and programs to reach people most in need.
In most developed countries, the different HCV affected populations can be defined from their risk characteristics that can inform prevention, testing and treatment policies. HCV affected individuals could be classified into two
* Correspondence:naveed.janjua@bccdc.ca 1
Clinical Prevention Services, British Columbia Centre for Disease Control, Vancouver, BC, Canada
2School of Population and Public Health, University of British Columbia,
Vancouver, BC, Canada
Full list of author information is available at the end of the article
broad groups: prevalent and new infections. Prevalent HCV infections represent infections acquired in the dis-tant past and these individuals are usually not involved in ongoing risk activities. New infections represent ongoing transmission usually occurring in people with high risk activities such as injection drug use. These two groups dif-fer not only in terms of demographics and risk factors but also have varying levels of onward transmission risk and hence unique needs for engagement in prevention and care. Characterization of these population groups using testing patterns, co-occurrence of other infec-tions (HIV, tuberculosis [TB], sexually transmitted in-fections [STIs], hepatitis B [HBV]), and social risk factors (addiction and mental illness) could inform the design of prevention, testing and treatment pro-grams tailored to the specific needs of these groups. In this paper, we characterize twin epidemics of HCV infection by describing characteristics and associated factors of acute and prevalent infections using data from the BC Hepatitis Testers Cohort (BC-HTC). We further characterize the HCV disease burden by birth cohorts and present positivity by birth cohort to in-form birth cohort screening.
Methods
The cohort and study population
The BC Hepatitis Testers Cohort(BC-HTC) includes all individuals tested for HCV or HIV at the BC Public Health Laboratory or reported to public health as a confirmed case of HCV, HBV, HIV/AIDS or active TB. The cohort is linked with medical visits, hospitaliza-tions, prescription drugs, cancers and deaths [9–13] (Table 1). Details of the cohort creation, linkage and characteristics of matched and unmatched individuals have been reported previously [14]. The overall link-age rate for HCV was >85 % and approached 90 % after 2006.
[image:2.595.52.543.398.733.2]BC-HTC participants with at least one HCV test (anti-body, HCV RNA, or genotype) or HCV case report contributed to the analysis from their first HCV test date (beginning 1992) or report (beginning 1990) through date of death or December 31, 2013, whichever was earliest (Table 1). We excluded data which preceded a participants’ birth date or occurred >7 days after the death date. Antibody tests in infants <18 months in the absence of HCV RNA testing were excluded as passive maternal antibody could not be ruled out.
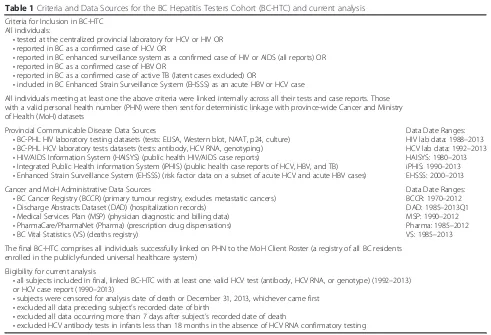
Table 1Criteria and Data Sources for the BC Hepatitis Testers Cohort (BC-HTC) and current analysis Criteria for Inclusion in BC-HTC
All individuals:
•tested at the centralized provincial laboratory for HCV or HIV OR
•reported in BC as a confirmed case of HCV OR
•reported in BC enhanced surveillance system as a confirmed case of HIV or AIDS (all reports) OR
•reported in BC as a confirmed case of HBV OR
•reported in BC as a confirmed case of active TB (latent cases excluded) OR
•included in BC Enhanced Strain Surveillance System (EHSSS) as an acute HBV or HCV case
All individuals meeting at least one the above criteria were linked internally across all their tests and case reports. Those with a valid personal health number (PHN) were then sent for deterministic linkage with province-wide Cancer and Ministry of Health (MoH) datasets
Provincial Communicable Disease Data Sources
•BC-PHL HIV laboratory testing datasets (tests: ELISA, Western blot, NAAT, p24, culture)
•BC-PHL HCV laboratory tests datasets (tests: antibody, HCV RNA, genotyping)
•HIV/AIDS Information System (HAISYS) (public health HIV/AIDS case reports)
•Integrated Public Health information System (iPHIS) (public health case reports of HCV, HBV, and TB)
•Enhanced Strain Surveillance System (EHSSS) (risk factor data on a subset of acute HCV and acute HBV cases)
Data Date Ranges: HIV lab data: 1988–2013 HCV lab data: 1992–2013 HAISYS: 1980–2013 iPHIS: 1990–2013 EHSSS: 2000–2013
Cancer and MoH Administrative Data Sources
•BC Cancer Registry (BCCR) (primary tumour registry, excludes metastatic cancers)
•Discharge Abstracts Dataset (DAD) (hospitalization records)
•Medical Services Plan (MSP) (physician diagnostic and billing data)
•PharmaCare/PharmaNet (Pharma) (prescription drug dispensations)
•BC Vital Statistics (VS) (deaths registry)
Data Date Ranges: BCCR: 1970–2012 DAD: 1985–2013Q1 MSP: 1990–2012 Pharma: 1985–2012 VS: 1985–2013
The final BC-HTC comprises all individuals successfully linked on PHN to the MoH Client Roster (a registry of all BC residents enrolled in the publicly-funded universal healthcare system)
Eligibility for current analysis
•all subjects included in final, linked BC-HTC with at least one valid HCV test (antibody, HCV RNA, or genotype) (1992–2013) or HCV case report (1990–2013)
•subjects were censored for analysis date of death or December 31, 2013, whichever came first
•excluded all data preceding subject’s recorded date of birth
•excluded all data occurring more than 7 days after subject’s recorded date of death
Definitions
A HCV case was defined as an individual testing positive for either HCV antibody or RNA or genotype or was reported as a HCV case through the public health reporting system [15]. We considered participants who were HCV antibody positive at their first test on record as having prevalent infection as, without a prior nega-tive test, a seroconversion interval cannot be estab-lished and, based on natural history, most will be chronically infected. Those cases not found in labora-tory data but reported by public health as confirmed HCV were considered prevalent infections. Individuals with a negative followed by a positive test were consid-ered seroconverters or new infections. Individuals who seroconverted within 24 months of the last negative test were termed 24-month seroconverters, while those who seroconverted after 24 months are >24-months seroconverters. For surveillance purposes in BC, acute HCV infection is defined as seroconversion within the previous 12 months [15]. Since the characteristics of 12- and 24-month seroconverters were similar as pre-sented in Additional file 1: Table S2, we report 0– 24-month seroconverters as acute HCV cases. Co-infection was defined as being infected with HIV, HBV or active TB together with HCV.
Socioeconomic status was assessed using the Québec Index of Material and Social Deprivation, a widely used index based on Canadian Census data [16]. Data from each census, conducted every 5 years, was applied to two years before and two years after the census year. For the 2011 census, the index is based on the data product CensusPlus to address non-response related bias in the 2011 National Household Survey [17].
Assessment of illicit drug use, mental illnesses, and problematic alcohol use was based on having diag-nostic codes in administrative health datasets evalu-ated across all data prior to and within 3 years of the first positive test or last negative test (Additional file 1: Table S1).
Statistical analysis
We compared the characteristics of HCV positive cases (24-month seroconverters, >24-month seroconverters and prevalent cases) and negative groups using the chi-square test for categorical factors or the Wilcoxon-Mann-Whitney test for continuous variables. We calcu-lated HCV positivity across birth cohorts and compared their characteristics. Positivity rate is defined as number of hepatitis C diagnoses divided by the total number of people tested for hepatitis C. We performed multi-nomial logistic regression to assess the factors associ-ated with new and prevalent infections at diagnosis compared to HCV negatives.
Results
Participant Profile, testing and infection prevalence
The cohort included 1,132,855 subjects tested for hepa-titis C from 1992-2013. Of these, 64,634 (5.7 %) were HCV positive. An additional 3092 cases tested elsewhere and reported to the public health surveillance system from 1990-2013 resulted in a total of 67,726 HCV cases. Of HCV positive individuals, 11,945 (17.6 %) have died and 55,781 were alive at the end of 2013. Among 1,068,221 HCV negative individuals, 79,840 (7.5 %) have died and 988,381 were alive at the end of 2013. The fol-lowing results are from individuals alive as of December 31, 2013 unless specified otherwise.
Characteristics of HCV positive and negative individuals
For HCV positive individuals, the median age at their first test was 40 years and 35 years for HCV negative individuals. A comparatively small proportion (12.2 %) of HCV positive individuals were born after 1975 compared to those HCV negative (37.6 %;p< 0.001). A higher propor-tion of HCV positives compared to negatives were male (64.4 % vs. 44.1 %;p< 0.001). Infection with HIV (5.7 % vs. 0.5 %;p< 0.001), HBV (3.7 % vs. 2.0 %;p< 0.001) and active TB (0.5 % vs 0.2 %;p< 0.001) were significantly higher in HCV positives than negatives. There was a graded in-crease in percent HCV positivite with inin-creases in mater-ial (most privileged: 3.2 % vs. most deprived: 8.0 %) and social deprivation (most privileged: 3.1 % vs. most de-prived: 7.7 %). There were fewer privileged (material: 13.4 % vs. 22.0 %/social: 11.0 % vs 18.5 %) and more deprived (material: 29.6 % vs. 18.8 %; p< 0.001/social: 37.7 % vs. 24.8 %;p< 0.001) individuals among HCV positives com-pared to HCV negatives. The proportions with illicit drug use (35.2 % vs. 7.0 %), problematic alcohol use (21.7 % vs. 6.2 %) and mental health conditions (16.0 % vs. 12.0 %) at diagnosis were also higher among HCV positives com-pared to HCV negatives (Table 2).
Seroconversion and characteristics of new and prevalent HCV cases
Of 370,741 individuals who tested for anti-HCV multiple times since 1992, 7726 (2.1 %) seroconverted. Among the 346,428 currently alive repeat testers, 6922 (2.0 %) seroconverted. Among those testing only once (n= 762,114), 56,908 (7.5 %) tested positive (prevalent HCV infections). Of these, 695,137 were alive at the end of 2013 and 46,262 (6.7 %) were positive.
Of the 6922 currently alive seroconverters, 1989 (28.7 %) seroconverted within 12 months, 1497 (21.6 %) in 12-24 months and 3436 (49.6 %) >24-months after their last nega-tive test (Additional file 1: Table S2).
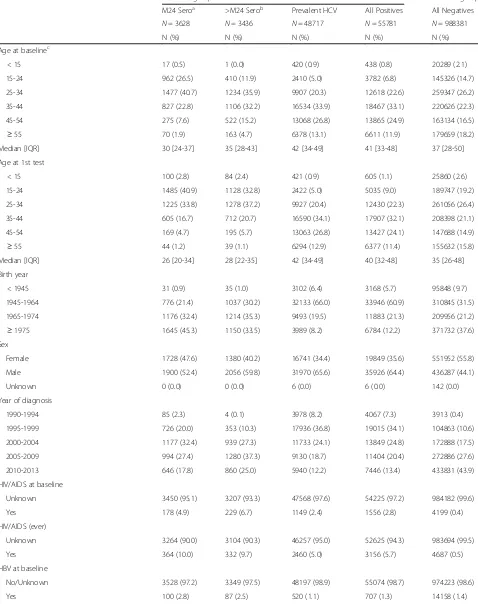
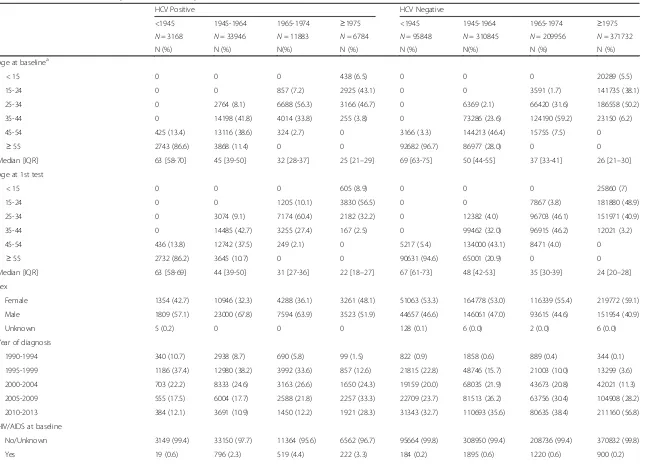
Table 2Characteristics of HCV positive and negative individuals, BC-HTC, Canada, 1990-2013
HCV + ve group HCV -ve group
M24 Seroa >M24 Serob Prevalent HCV All Positives All Negatives
N= 3628 N= 3436 N= 48717 N= 55781 N= 988381
N (%) N (%) N (%) N (%) N (%)
Age at baselinec
< 15 17 (0.5) 1 (0.0) 420 (0.9) 438 (0.8) 20289 (2.1)
15-24 962 (26.5) 410 (11.9) 2410 (5.0) 3782 (6.8) 145326 (14.7)
25-34 1477 (40.7) 1234 (35.9) 9907 (20.3) 12618 (22.6) 259347 (26.2)
35-44 827 (22.8) 1106 (32.2) 16534 (33.9) 18467 (33.1) 220626 (22.3)
45-54 275 (7.6) 522 (15.2) 13068 (26.8) 13865 (24.9) 163134 (16.5)
≥55 70 (1.9) 163 (4.7) 6378 (13.1) 6611 (11.9) 179659 (18.2)
Median [IQR] 30 [24-37] 35 [28-43] 42 [34-49] 41 [33-48] 37 [28-50]
Age at 1st test
< 15 100 (2.8) 84 (2.4) 421 (0.9) 605 (1.1) 25860 (2.6)
15-24 1485 (40.9) 1128 (32.8) 2422 (5.0) 5035 (9.0) 189747 (19.2)
25-34 1225 (33.8) 1278 (37.2) 9927 (20.4) 12430 (22.3) 261056 (26.4)
35-44 605 (16.7) 712 (20.7) 16590 (34.1) 17907 (32.1) 208398 (21.1)
45-54 169 (4.7) 195 (5.7) 13063 (26.8) 13427 (24.1) 147688 (14.9)
≥55 44 (1.2) 39 (1.1) 6294 (12.9) 6377 (11.4) 155632 (15.8)
Median [IQR] 26 [20-34] 28 [22-35] 42 [34-49] 40 [32-48] 35 [26-48]
Birth year
< 1945 31 (0.9) 35 (1.0) 3102 (6.4) 3168 (5.7) 95848 (9.7)
1945-1964 776 (21.4) 1037 (30.2) 32133 (66.0) 33946 (60.9) 310845 (31.5)
1965-1974 1176 (32.4) 1214 (35.3) 9493 (19.5) 11883 (21.3) 209956 (21.2)
≥1975 1645 (45.3) 1150 (33.5) 3989 (8.2) 6784 (12.2) 371732 (37.6)
Sex
Female 1728 (47.6) 1380 (40.2) 16741 (34.4) 19849 (35.6) 551952 (55.8)
Male 1900 (52.4) 2056 (59.8) 31970 (65.6) 35926 (64.4) 436287 (44.1)
Unknown 0 (0.0) 0 (0.0) 6 (0.0) 6 (0.0) 142 (0.0)
Year of diagnosis
1990-1994 85 (2.3) 4 (0.1) 3978 (8.2) 4067 (7.3) 3913 (0.4)
1995-1999 726 (20.0) 353 (10.3) 17936 (36.8) 19015 (34.1) 104863 (10.6)
2000-2004 1177 (32.4) 939 (27.3) 11733 (24.1) 13849 (24.8) 172888 (17.5)
2005-2009 994 (27.4) 1280 (37.3) 9130 (18.7) 11404 (20.4) 272886 (27.6)
2010-2013 646 (17.8) 860 (25.0) 5940 (12.2) 7446 (13.4) 433831 (43.9)
HIV/AIDS at baseline
Unknown 3450 (95.1) 3207 (93.3) 47568 (97.6) 54225 (97.2) 984182 (99.6)
Yes 178 (4.9) 229 (6.7) 1149 (2.4) 1556 (2.8) 4199 (0.4)
HIV/AIDS (ever)
Unknown 3264 (90.0) 3104 (90.3) 46257 (95.0) 52625 (94.3) 983694 (99.5)
Yes 364 (10.0) 332 (9.7) 2460 (5.0) 3156 (5.7) 4687 (0.5)
HBV at baseline
No/Unknown 3528 (97.2) 3349 (97.5) 48197 (98.9) 55074 (98.7) 974223 (98.6)
Table 2Characteristics of HCV positive and negative individuals, BC-HTC, Canada, 1990-2013(Continued)
HBV (ever)
No/Unknown 3453 (95.2) 3326 (96.8) 46927 (96.3) 53706 (96.3) 968459 (98.0)
Yes 175 (4.8) 110 (3.2) 1790 (3.7) 2075 (3.7) 19922 (2.0)
Active TB at baseline
No/Unknown 3621 (99.8) 3428 (99.8) 48634 (99.8) 55683 (99.8) 986909 (99.9)
Yes 7 (0.2) 8 (0.2) 83 (0.2) 98 (0.2) 1472 (0.1)
Active TB (ever)
No/Unknown 3611 (99.5) 3415 (99.4) 48466 (99.5) 55492 (99.5) 986473 (99.8)
Yes 17 (0.5) 21 (0.6) 251 (0.5) 289 (0.5) 1908 (0.2)
Material deprivation quintile at baseline
Unknown 96 (2.7) 79 (2.3) 2316 (4.8) 2491 (4.5) 14773 (1.5)
Q1 (most privileged) 452 (12.5) 444 (12.9) 6247 (12.8) 7143 (12.8) 214007 (21.7)
Q2 526 (14.5) 463 (13.5) 7500 (15.4) 8489 (15.2) 187587 (19)
Q3 531 (14.6) 585 (17.0) 8522 (17.5) 9638 (17.3) 192265 (19.5)
Q4 876 (24.2) 774 (22.5) 10580 (21.7) 12230 (21.9) 197116 (19.9)
Q5 (most deprived) 1147 (31.6) 1091 (31.8) 13552 (27.8) 15790 (28.3) 182633 (18.5)
Social deprivation quintile at baseline
Unknown 96 (2.7) 79 (2.3) 2316 (4.8) 2491 (4.5) 14773 (1.5)
Q1 (most privileged) 271 (7.5) 283 (8.2) 5302 (10.9) 5856 (10.5) 180214 (18.2)
Q2 349 (9.6) 337 (9.8) 6194 (12.7) 6880 (12.3) 175098 (17.7)
Q3 540 (14.9) 463 (13.5) 8094 (16.6) 9097 (16.3) 175715 (17.8)
Q4 703 (19.4) 720 (21.0) 9972 (20.5) 11395 (20.4) 201551 (20.4)
Q5 (most deprived) 1669 (46.0) 1554 (45.2) 16839 (34.6) 20062 (36) 241030 (24.4)
Mental health at baselined
No/Unknown 2199 (64.5) 2096 (65.0) 40934 (86.7) 45229 (84.0) 729398 (88.0)
Yes 1209 (35.5) 1130 (35.0) 6297 (13.3) 8636 (16.0) 99054 (12.0)
Mental health 3yrs pre-baselined
No/Unknown 2590 (76.0) 2653 (82.2) 43518 (92.1) 48761 (90.5) 781042 (94.3)
Yes 818 (24.0) 573 (17.8) 3713 (7.9) 5104 (9.5) 47410 (5.7)
Illicit drug use at baselined
No/Unknown 910 (26.7) 942 (29.2) 33036 (69.9) 34888 (64.8) 770499 (93.0)
Yes 2498 (73.3) 2284 (70.8) 14195 (30.1) 18977 (35.2) 57953 (7.0)
Illicit drug use 3yrs pre-baselined
No/Unknown 1084 (31.8) 1433 (44.4) 36193 (76.6) 38710 (71.9) 795325 (96.0)
Yes 2324 (68.2) 1793 (55.6) 11038 (23.4) 15155 (28.1) 33127 (4.0)
Problematic alcohol use at baselined
No/Unknown 2083 (61.1) 1896 (58.8) 38178 (80.8) 42157 (78.3) 777271 (93.8)
Yes 1325 (38.9) 1330 (41.2) 9053 (19.2) 11708 (21.7) 51181 (6.2)
Problematic alcohol use 3yrs pre-baselined
No/Unknown 2521 (74.0) 2555 (79.2) 41709 (88.3) 46785 (86.9) 802492 (96.9)
Yes 887 (26.0) 671 (20.8) 5522 (11.7) 7080 (13.1) 25960 (3.1)
a
24-month Sero: Individuals who seroconverted within 24 months of the last negative test b
Individuals who seroconverted after 24 months of the last negative test c
Baseline is defined as date of diagnosis (i.e. first HCV positive test or case report) for HCV positive individuals, and date of last negative test result for HCV negative individuals
d
42 years;p< 0.001). Most of the individuals with preva-lent infection (66.0 %) were born between 1945-64 with another 19.5 % between 1965-74. Of 24-month serocon-verters, 32.4 % were born in 1965-74, and 45.3 % after 1975. A higher percentage of prevalent cases and >24-month seroconverters were male compared to 24->24-month seroconverters (65.6 %, 59.8 % vs 52.4 %) (Table 2).
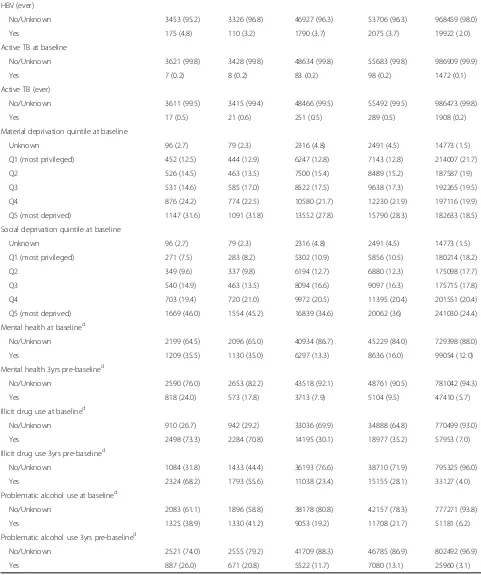
HIV and HBV co-infections were higher among 24-month seroconverters compared to prevalent HCV cases (HIV: 10.0 % vs. 5.1 %; HBV: 4.8 % vs. 3.7 %) while the proportion with active TB was the same (0.5 % vs. 0.5 %) (Fig. 1a). The proportions with illicit drug use (73.3 % vs. 30.1 %), problem alcohol use (38.9 % vs. 19.2 %) and mental health conditions (35.5 % vs. 13.3 %) were also
higher among 24-month seroconverters than individuals with prevalent HCV infection (Table 2, Fig. 1b).
Characteristics of participants diagnosed in recent years (2010-2013) are presented in Additional file 1: Table S3. Overall characteristics are similar with differences in age at diagnosis, birth cohort, HIV, HBV infection, and mental illness mainly in 24 month seroconverters.
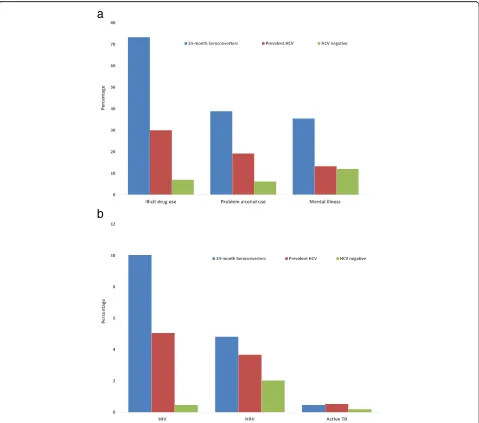
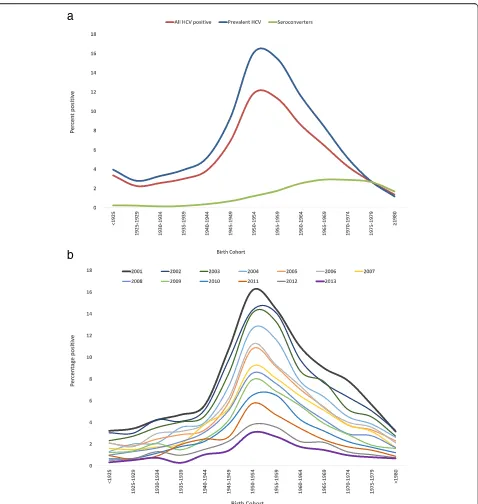
HCV infection by birth cohort
HCV positivity rates showed a strong birth cohort effect (Fig. 2a, b Additional file 1: Figure S1). Birth cohorts 1950-1954 and 1955-59 had the highest percentage posi-tive overall followed by 1960-64 though positivity declined over time and was lowest in 2013. Birth cohorts 1945-49
a
b
[image:6.595.59.538.282.705.2]and 1965-69 had similar percentage positive though it was slightly higher for 1945-49. In 2013, there were 1,262,121 people born between 1945 and 1964 living in BC; 344,791 (27.3 %) have been tested and 33,946 (9.8 %) were HCV positive, of whom 7352 (17.8 %) have already died. As-suming constant in and outflow, about 70 % of 1945-64 and 1950-70 birth cohorts have not been tested for HCV.
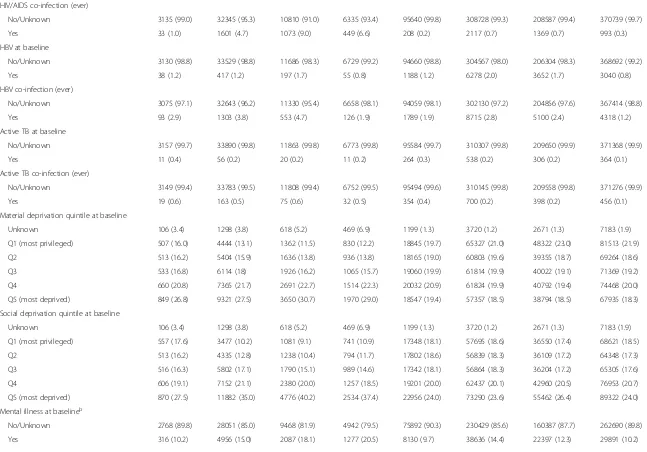
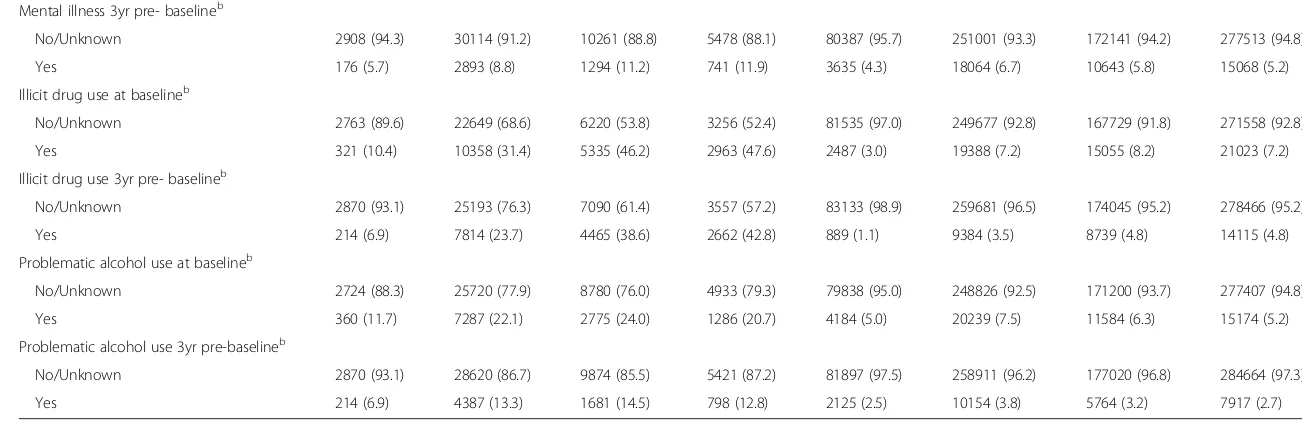
In birth cohort 1945-64, 67.8 % were male compared to 63.9 % and 51.9 % of those born 1965-74 and after 1975, respectively. A small proportion (2.3 %) of 24-month seroconverters was identified among HCV posi-tives born 1945-64 compared to 9.9 % and 24.3 % among 1965-1974 and ≥1975 birth cohorts, respectively. In con-trast, 97.9 %, 94.7 %, 79.9 % and 58.8 % HCV positive tests
a
b
[image:7.595.60.538.85.589.2]were detected on the first test (prevalent infections) among those born <1945, 1945-64, 1965-1974, and≥1975, respectively (Table 3).
The proportion of HCV/HIV co-infected individuals increased with increasing birth year (<1945: 1.0 %, 1945-64: 4.7 %, 1965-1974: 9.0 % and >1975: 6.6 %). In con-trast, among HCV negative individuals, the HIV infec-tion rates by birth cohort were higher among those born between 1945-64 and 1965-74. HBV co-infection was 2.9 %, 3.8 %, 4.7 % and 1.9 % among those born <1945, 1945-64, 1965-1974, and≥1975, respectively. Illicit drug use (36.7 % vs 10.4 %), problematic alcohol use (22.3 % vs 11.7 %) and mental health conditions (16.4 % vs 10.2 %) were higher among those born after 1945 than those born before 1945 (Table 3).
Factors associated with new and prevalent HCV infection
In the multivariable multinomial logistic regression model (Table 4), new HCV infections were associated with being male, born after 1945, HIV co-infection, HBV co-infection, material deprivation, illicit drug use, prob-lematic alcohol use and mental health diagnoses. The same factors were associated with prevalent HCV infec-tions except for lower odds for HBV co-infection, mental health conditions and birth cohort≥1975. The odds of prevalent infection were highest in the 1945-54 birth cohort (OR: 3.8, 95 % CI: 3.7-3.9) followed by 1955-64 (OR: 3.2, 95 % CI: 3.1-3.3), while the odds of being a new infection were highest for the 1975-84 (OR: 11.8, 95 % CI: 9.9-14.1) birth cohort followed by those born 1965-74 (OR: 9.9, 95 % CI: 8.3-11.8). Furthermore, odds ratios for illicit drug use (ORs: 21.0, 95 % CI: 19.8-22.4 vs. 5.0, 95 % CI: 4.9-5.2) and HIV co-infection (ORs: 7.2, 95 % CI: 7.1-8.9 vs. 4.8, 95 % CI: 4.5-5.2) were much higher for new in-fections than for prevalent HCV inin-fections. In a model with age at diagnosis instead of birth cohort (Additional file 1: Table S5), odds of prevalent infection were highest among ages 45-54 years (OR: 4.0; 95 % CI: 3.9-4.2) followed by 35-44 years (OR: 3.2; 95 % CI: 3.0-3.3) while odds for new infection were highest among ages 15-24 years (OR: 11.4, 95 % CI: 9.0-14.4) and 25-34 years (OR: 11.1, 95 % CI: 8.8-14.0) and declined thereafter. Similar results were observed using indicators for recent risk ac-tivities (Additional file 1: Table S6).
Discussion
We used a large cohort of more than one million people tested for HCV in BC, and while accounting for mortal-ity, we found that a large number of people are currently living with HCV. The highest positivity rate was among people born in 1945-64, which declined over time and was lowest in 2013. New infections were detected mainly among younger age groups. The new HCV infection (seroconversion) rate was highest among males, those
with HIV or HBV co-infection, mental health conditions, problematic alcohol or illicit drug use, and socioeco-nomically disadvantaged persons. Prevalent HCV infec-tion was associated with being male, born 1945-64, HIV co-infected, problem alcohol and illicit drug use, and socioeconomic deprivation. These findings of twin epi-demics highlight important opportunities for prevention, testing and treatment of HCV.
In this analysis, we identified two groups of HCV in-fected individuals: new infections (seroconverters) and those with prevalent HCV infection. Most of those with prevalent HCV were born 1945-1964, while most newly infected individuals were younger. However, the sero-converters are not a homogeneous group: 24-month ser-oconverters differed from >24 months serser-oconverters in terms of age, sex, testing patterns, and HBV co-infection rate. Surveillance data on acute HCV infections indicate that 70 % of seroconverters reported injection drug use in the past 12 months [18]. In a BC-HTC subset for whom self-reported risk factor data was available, 85 % of those who self-reported injection drug use had a med-ical visit for illicit drug use. Thus, 24-month seroconver-ters most likely acquired HCV through their injection drug use networks.
N= 3168 N= 33946 N= 11883 N= 6784 N= 95848 N= 310845 N= 209956 N= 371732
N (%) N (%) N(%) N (%) N (%) N(%) N (%) N (%)
Age at baselinea
< 15 0 0 0 438 (6.5) 0 0 0 20289 (5.5)
15-24 0 0 857 (7.2) 2925 (43.1) 0 0 3591 (1.7) 141735 (38.1)
25-34 0 2764 (8.1) 6688 (56.3) 3166 (46.7) 0 6369 (2.1) 66420 (31.6) 186558 (50.2)
35-44 0 14198 (41.8) 4014 (33.8) 255 (3.8) 0 73286 (23.6) 124190 (59.2) 23150 (6.2)
45-54 425 (13.4) 13116 (38.6) 324 (2.7) 0 3166 (3.3) 144213 (46.4) 15755 (7.5) 0
≥55 2743 (86.6) 3868 (11.4) 0 0 92682 (96.7) 86977 (28.0) 0 0
Median [IQR] 63 [58-70] 45 [39-50] 32 [28-37] 25 [21–29] 69 [63-75] 50 [44-55] 37 [33-41] 26 [21–30]
Age at 1st test
< 15 0 0 0 605 (8.9) 0 0 0 25860 (7)
15-24 0 0 1205 (10.1) 3830 (56.5) 0 0 7867 (3.8) 181880 (48.9)
25-34 0 3074 (9.1) 7174 (60.4) 2182 (32.2) 0 12382 (4.0) 96703 (46.1) 151971 (40.9)
35-44 0 14485 (42.7) 3255 (27.4) 167 (2.5) 0 99462 (32.0) 96915 (46.2) 12021 (3.2)
45-54 436 (13.8) 12742 (37.5) 249 (2.1) 0 5217 (5.4) 134000 (43.1) 8471 (4.0) 0
≥55 2732 (86.2) 3645 (10.7) 0 0 90631 (94.6) 65001 (20.9) 0 0
Median [IQR] 63 [58-69] 44 [39-50] 31 [27-36] 22 [18–27] 67 [61-73] 48 [42-53] 35 [30-39] 24 [20–28]
Sex
Female 1354 (42.7) 10946 (32.3) 4288 (36.1) 3261 (48.1) 51063 (53.3) 164778 (53.0) 116339 (55.4) 219772 (59.1)
Male 1809 (57.1) 23000 (67.8) 7594 (63.9) 3523 (51.9) 44657 (46.6) 146061 (47.0) 93615 (44.6) 151954 (40.9)
Unknown 5 (0.2) 0 0 0 128 (0.1) 6 (0.0) 2 (0.0) 6 (0.0)
Year of diagnosis
1990-1994 340 (10.7) 2938 (8.7) 690 (5.8) 99 (1.5) 822 (0.9) 1858 (0.6) 889 (0.4) 344 (0.1)
1995-1999 1186 (37.4) 12980 (38.2) 3992 (33.6) 857 (12.6) 21815 (22.8) 48746 (15.7) 21003 (10.0) 13299 (3.6)
2000-2004 703 (22.2) 8333 (24.6) 3163 (26.6) 1650 (24.3) 19159 (20.0) 68035 (21.9) 43673 (20.8) 42021 (11.3)
2005-2009 555 (17.5) 6004 (17.7) 2588 (21.8) 2257 (33.3) 22709 (23.7) 81513 (26.2) 63756 (30.4) 104908 (28.2)
2010-2013 384 (12.1) 3691 (10.9) 1450 (12.2) 1921 (28.3) 31343 (32.7) 110693 (35.6) 80635 (38.4) 211160 (56.8)
HIV/AIDS at baseline
No/Unknown 3149 (99.4) 33150 (97.7) 11364 (95.6) 6562 (96.7) 95664 (99.8) 308950 (99.4) 208736 (99.4) 370832 (99.8)
Yes 19 (0.6) 796 (2.3) 519 (4.4) 222 (3.3) 184 (0.2) 1895 (0.6) 1220 (0.6) 900 (0.2)
Infectious
Diseases
(2016) 16:334
Page
9
of
[image:9.791.63.713.66.533.2]Yes 33 (1.0) 1601 (4.7) 1073 (9.0) 449 (6.6) 208 (0.2) 2117 (0.7) 1369 (0.7) 993 (0.3)
HBV at baseline
No/Unknown 3130 (98.8) 33529 (98.8) 11686 (98.3) 6729 (99.2) 94660 (98.8) 304567 (98.0) 206304 (98.3) 368692 (99.2)
Yes 38 (1.2) 417 (1.2) 197 (1.7) 55 (0.8) 1188 (1.2) 6278 (2.0) 3652 (1.7) 3040 (0.8)
HBV co-infection (ever)
No/Unknown 3075 (97.1) 32643 (96.2) 11330 (95.4) 6658 (98.1) 94059 (98.1) 302130 (97.2) 204856 (97.6) 367414 (98.8)
Yes 93 (2.9) 1303 (3.8) 553 (4.7) 126 (1.9) 1789 (1.9) 8715 (2.8) 5100 (2.4) 4318 (1.2)
Active TB at baseline
No/Unknown 3157 (99.7) 33890 (99.8) 11863 (99.8) 6773 (99.8) 95584 (99.7) 310307 (99.8) 209650 (99.9) 371368 (99.9)
Yes 11 (0.4) 56 (0.2) 20 (0.2) 11 (0.2) 264 (0.3) 538 (0.2) 306 (0.2) 364 (0.1)
Active TB co-infection (ever)
No/Unknown 3149 (99.4) 33783 (99.5) 11808 (99.4) 6752 (99.5) 95494 (99.6) 310145 (99.8) 209558 (99.8) 371276 (99.9)
Yes 19 (0.6) 163 (0.5) 75 (0.6) 32 (0.5) 354 (0.4) 700 (0.2) 398 (0.2) 456 (0.1)
Material deprivation quintile at baseline
Unknown 106 (3.4) 1298 (3.8) 618 (5.2) 469 (6.9) 1199 (1.3) 3720 (1.2) 2671 (1.3) 7183 (1.9)
Q1 (most privileged) 507 (16.0) 4444 (13.1) 1362 (11.5) 830 (12.2) 18845 (19.7) 65327 (21.0) 48322 (23.0) 81513 (21.9)
Q2 513 (16.2) 5404 (15.9) 1636 (13.8) 936 (13.8) 18165 (19.0) 60803 (19.6) 39355 (18.7) 69264 (18.6)
Q3 533 (16.8) 6114 (18) 1926 (16.2) 1065 (15.7) 19060 (19.9) 61814 (19.9) 40022 (19.1) 71369 (19.2)
Q4 660 (20.8) 7365 (21.7) 2691 (22.7) 1514 (22.3) 20032 (20.9) 61824 (19.9) 40792 (19.4) 74468 (20.0)
Q5 (most deprived) 849 (26.8) 9321 (27.5) 3650 (30.7) 1970 (29.0) 18547 (19.4) 57357 (18.5) 38794 (18.5) 67935 (18.3)
Social deprivation quintile at baseline
Unknown 106 (3.4) 1298 (3.8) 618 (5.2) 469 (6.9) 1199 (1.3) 3720 (1.2) 2671 (1.3) 7183 (1.9)
Q1 (most privileged) 557 (17.6) 3477 (10.2) 1081 (9.1) 741 (10.9) 17348 (18.1) 57695 (18.6) 36550 (17.4) 68621 (18.5)
Q2 513 (16.2) 4335 (12.8) 1238 (10.4) 794 (11.7) 17802 (18.6) 56839 (18.3) 36109 (17.2) 64348 (17.3)
Q3 516 (16.3) 5802 (17.1) 1790 (15.1) 989 (14.6) 17342 (18.1) 56864 (18.3) 36204 (17.2) 65305 (17.6)
Q4 606 (19.1) 7152 (21.1) 2380 (20.0) 1257 (18.5) 19201 (20.0) 62437 (20.1) 42960 (20.5) 76953 (20.7)
Q5 (most deprived) 870 (27.5) 11882 (35.0) 4776 (40.2) 2534 (37.4) 22956 (24.0) 73290 (23.6) 55462 (26.4) 89322 (24.0)
Mental illness at baselineb
No/Unknown 2768 (89.8) 28051 (85.0) 9468 (81.9) 4942 (79.5) 75892 (90.3) 230429 (85.6) 160387 (87.7) 262690 (89.8)
Yes 316 (10.2) 4956 (15.0) 2087 (18.1) 1277 (20.5) 8130 (9.7) 38636 (14.4) 22397 (12.3) 29891 (10.2)
Infectious
Diseases
(2016) 16:334
Page
10
of
[image:10.791.60.707.71.523.2]Yes 176 (5.7) 2893 (8.8) 1294 (11.2) 741 (11.9) 3635 (4.3) 18064 (6.7) 10643 (5.8) 15068 (5.2)
Illicit drug use at baselineb
No/Unknown 2763 (89.6) 22649 (68.6) 6220 (53.8) 3256 (52.4) 81535 (97.0) 249677 (92.8) 167729 (91.8) 271558 (92.8)
Yes 321 (10.4) 10358 (31.4) 5335 (46.2) 2963 (47.6) 2487 (3.0) 19388 (7.2) 15055 (8.2) 21023 (7.2)
Illicit drug use 3yr pre- baselineb
No/Unknown 2870 (93.1) 25193 (76.3) 7090 (61.4) 3557 (57.2) 83133 (98.9) 259681 (96.5) 174045 (95.2) 278466 (95.2)
Yes 214 (6.9) 7814 (23.7) 4465 (38.6) 2662 (42.8) 889 (1.1) 9384 (3.5) 8739 (4.8) 14115 (4.8)
Problematic alcohol use at baselineb
No/Unknown 2724 (88.3) 25720 (77.9) 8780 (76.0) 4933 (79.3) 79838 (95.0) 248826 (92.5) 171200 (93.7) 277407 (94.8)
Yes 360 (11.7) 7287 (22.1) 2775 (24.0) 1286 (20.7) 4184 (5.0) 20239 (7.5) 11584 (6.3) 15174 (5.2)
Problematic alcohol use 3yr pre-baselineb
No/Unknown 2870 (93.1) 28620 (86.7) 9874 (85.5) 5421 (87.2) 81897 (97.5) 258911 (96.2) 177020 (96.8) 284664 (97.3)
Yes 214 (6.9) 4387 (13.3) 1681 (14.5) 798 (12.8) 2125 (2.5) 10154 (3.8) 5764 (3.2) 7917 (2.7)
a
Baseline is defined as date of diagnosis (i.e. first HCV positive test or case report) for HCV positive individuals, and date of last negative test result for HCV negative individuals b
Mental health, drug misuse, alcohol misuse data was available up to 2012
Infectious
Diseases
(2016) 16:334
Page
11
of
[image:11.791.50.701.71.282.2]studies on feasibility and cost effectiveness of various strategies are needed to identify undiagnosed infec-tions in BC.
Risk factors for both new and prevalent HCV infec-tions were similar with some notable excepinfec-tions, includ-ing age, birth cohort, drug use, HBV co-infection and mental health diagnoses. HBV co-infection and mental health problems were significantly associated with in-creased odds of new infection but dein-creased odds of prevalent HCV infection, while ORs for illicit drug use compared to no drug use among new infections (AOR = 21) were four times than those for prevalent HCV infec-tion (AOR = 5.0). ORs for prevalent HCV infecinfec-tion were highest for birth cohort 1945-64 and declined thereafter, while among new infections, ORs were highest for those born later, consistent with an earlier analysis demon-strating a higher HCV incidence rate in younger birth cohorts [25]. Demographic characteristics and risk fac-tors for prevalent HCV were also consistent with recent data from the United States and Canada [8, 20]. Like-wise, in a recent electronic medical record based study from the US, being a baby boomer, male, people who injects drugs (PWID), HIV co-infected and having low income were associated with HCV positivity [26]. Risk factors among new infections were also similar to those identified with HCV infection in high risk populations, mainly PWID. Among seroconverters especially 24-months seroconverters, those born 1965-84, HIV/HBV co-infection, socioeconomic deprivation, mental illness, illicit drug use and problematic alcohol use were more common than among prevalent HCV infections (Table 1/ Fig. 1). These findings highlight the presence of syndemics of blood-borne infections (BBI), mental illness, addiction, and socioeconomic marginalization in this population as has been reported by others [27–29]. Addressing these syndemics requires comprehensive services including inte-grated testing, prevention and treatment for STI/BBIs, as well as mental health and addiction services to address the needs of this population group.
[image:12.595.56.288.125.649.2]Findings from this paper should be interpreted in the context of some methodological issues. The valid-ity of our estimates depends on the successful linkage rate. Linkage rates were very high for HCV (>85 %), especially in recent years [14]. Linkage rates for those HIV co-infected were much higher than the overall HIV linkage rate, especially before 2005. Thus, the HIV co-infection rate may have been underestimated. However, as reported earlier, we used multiple sources of HIV status identification to reduce underestima-tion. In this study, we did not have access to immi-gration and Aboriginal status data and hence we were not able to characterize the disease burden among immigrants and Aboriginal populations. Other data suggest that Aboriginal people are five times more likely to be infected with HCV [30]. Immigrants from endemic countries are also more likely to have higher HCV infection rates.
Table 4Multivariable multinomial logistic regression models for factors associated with seroconversion and prevalent HCV infection in BC-HTC, Canada 1990-2012a, b
Variables Seroconverters Prevalent HCV
ORs (95 % CI) ORs (95 % CI)
Sex
Female 1.00 1.00
Male 1.25 (1.19-1.31) 2.06 (2.02-2.10)
Birth year
< 1945 1.00 1.00
1945-1954 3.38 (2.78-4.11) 3.79 (3.67-3.92)
1955-1964 6.22 (5.19-7.44) 3.23 (3.13-3.34)
1965-1974 9.86 (8.26-11.78) 1.64 (1.58-1.70)
1975-1984 11.76 (9.83-14.07) 0.70 (0.67-0.73) ≥1985 6.53 (5.34-7.99) 0.48 (0.44-0.51) HIV infection at baselinec
No/Unknown 1.00 1.00
Yes 7.92 (7.05-8.89) 4.80 (4.47-5.15)
HBV at baselinec
No/Unknown 1.00 1.00
Yes 2.33 (2.00-2.71) 0.69 (0.63-0.75)
Active TB at baselinec
No/Unknown 1.00 1.00
Yes 1.00 (0.62-1.62) 1.01 (0.81-1.25)
Material deprivation quintile at baselinec
Unknown 3.51 (2.96-4.17) 5.38 (5.07-5.70)
Q1 (most privileged) 1.00 1.00
Q2 1.20 (1.06-1.31) 1.22 (1.18-1.27)
Q3 1.24 (1.13-1.36) 1.36 (1.32-1.41)
Q4 1.62 (1.48-1.76) 1.60 (1.55-1.65)
Q5 (most deprived) 1.99 (1.83-2.15) 1.98 (1.92-2.04)
Mental illness at baselinec
No/Unknown 1.00 1.00
Yes 1.18 (1.12-1.25) 0.69 (0.67-0.72)
Illicit drugs use at baseline
No/Unknown 1.00 1.00
Yes 21.00 (19.80-22.38) 5.03 (4.91-5.16)
Problematic alcohol use at baseline
No/Unknown 1.00 1.00
Yes 2.11 (2.00-2.23) 1.67 (1.63-1.72)
a
Adjusted for health authority and year of diagnosis;b
Excluding unknown gender and health authority.c
To date, laboratory testing for HCV has followed risk based guidelines and hence a higher positivity rate among HCV testers in this cohort is expected compared to the general population. However, general population surveys such as the Canadian Health Measures Survey may not capture high risk populations with higher HCV prevalence thus and may underestimate total population of infected individuals [8, 20]. Categorizing prevalent infections based on being positive at the first test may be an over-estimate as some of these individuals are likely to be recent seroconverters as shown in our recent mo-lecular analysis [31]. The prevalent HCV case detection could be affected by presence of late stage symptomatic disease or survival. Survival may also affect the differ-ence in risk factor profile between prevalent and new cases. In the BC-HTC, data is available on all cohort members many years before cohort initiation to assess risk factors as presented in Table 1. Thus, for all cohort members regardless of first test or diagnosis date, data on risk factors started at the same time, providing ample time to assess risk factors from the available data. Fur-thermore, after accounting for mortality in the cohort, there was no difference in identified risk factor patterns in models including both currently alive and dead and only those currently who are currently alive. Thus, sur-vival bias is unlikely to explain difference in risk factor profile between prevalent and new infections. However, survival bias is not expected to be completely eliminated especially in early nineties, when people could have died before HCV diagnosis or getting diagnosed because of symptoms related to late stage disease. In another ana-lysis, we found that late HCV diagnosis in relation to advance stage liver disease (hepatocellular carcinoma and decompensated cirrhosis) was common in early nineties and have declined substantially over time [32].
In the current paper, data on RNA testing and active infection was not presented, which is important to assess people living with active infection and need treatment to prevent progressive liver disease. The BC-HTC provides a platform to assess program progress through cascade of care monitoring, long term outcomes related to HCV and impact of treatment on long term outcomes. These data are in the process of being analyzed and will be pre-sented in future reports.
Conclusions
The HCV positivity rate was highest in the 1950-54 and 1955-59 birth cohorts and overall among those born between 1945- 1964, which declined over time. Further-more, the year over year decline in the positivity rate suggests that most of the HCV infections in these co-horts have already been identified. However, current risk based testing may not identify individuals who are un-able to recall or are unwilling to disclose remote risk
behaviors. Further studies are needed to estimate the number of undiagnosed HCV infection and assess opti-mal strategies to identify the remaining undiagnosed in-fections. Newly acquired infections are occurring mainly in younger birth cohorts and these groups are more likely to be co-infected with HIV and/or HBV, socioeco-nomically marginalized, and living with serious mental illnesses and addictions. Comprehensive syndemic ap-proaches that take into account co-infections, mental health, additions and socioeconomic vulnerabilities are urgently required to identify, treat, and support people with HCV infection.
Additional file
Additional file 1: Table S1. Definitions for comorbid conditions.Table S2.Distribution HCV seroconverters by seroconversion interval in BC HTC, Canada 1990-2013.Table S3.Characteristics of currently alive recently diag-nosed (2010-2013) HCV positive and negative individuals, BC-HTC, 2010 - 2013. Table S4.Percentage positive for hepatitis C by diagnosis year and birth cohort in British Columbia, 1992-2013.Figure S1.Hepatitis C percentage positive by year of diagnosis and birth cohort, BC-HTC, British Columbia, Canada, 2000-2013.Table S5.Multivariable multinomial logistic regression model for factors associated with seroconversion and chronic HCV infection including age as covariate in BC HTC, Canada 1990-2012 a,b.Table S6. Multi-variable multinomial logistic regression model for factors associated with seroconversion and chronic HCV infection including indicators for recent risk activities in BC HTC, Canada 1990-2012 a,b. (DOCX 68 kb)
Abbreviations
BC-HTC, The BC Hepatitis Testers Cohort; HCV, hepatitis C virus; BC, British Columbia; HIV, Human immunodeficiency virus; HBV, hepatitis B virus; TB, Tuberculosis; STIs, Sexually transmitted infections; BCCDC, British Columbia Center for Disease Control; BBI, Bloodborne infection; PWID, People who injection drugs
Acknowledgements
We acknowledge the assistance of BCCDC, PHSA Performance measurement and reporting, Information Analysts, Ministry of Health Data Access, Research and Stewardship, & MSP, DAD and Medical Beneficiary and Pharmaceutical Services programme areas, BC Ministry of Health, and BC Cancer Agency and their staff involved in data access and procurement, and data management.
Funding
This work was supported by BC Centre for Disease Control and Agencies contributing data to the study and the Canadian Institutes of Health Research [Grant # 201503NHC-348216-NHC-ADWY -62134 & 201410PHE-337680-PHE-CAAA-179547].
Availability of data and materials
The study is based on data linkage that is available through respective data stewards. Information on data access is available at BC Centre for Disease Control at following link: http://www.bccdc.ca/about/accountability/data-access-requests/public-health-data.
Authors’contributions
Competing interests
MK has received grant funding via his institution from Roche Molecular Systems, Boehringer Ingelheim, Merck, Siemens Healthcare Diagnostics and Hologic Inc.
Consent for publication Not Applicable
Ethics and consent to participate
Data linkage to establish the BC-HTC was performed under the BCCDC’s public health mandate. The Behavioral Research Ethics Board at the University of British Columbia reviewed and approved the study (H14-01649). Patient consent was not required as study used de-identified linked administrative healthcare datasets. Author details
1Clinical Prevention Services, British Columbia Centre for Disease Control,
Vancouver, BC, Canada.2School of Population and Public Health, University
of British Columbia, Vancouver, BC, Canada.3Department of Pathology and Laboratory Medicine, University of British Columbia, Vancouver, BC, Canada.
Received: 12 January 2016 Accepted: 13 June 2016
References
1. Mohd Hanafiah K, Groeger J, Flaxman AD, Wiersma ST. Global epidemiology of hepatitis C virus infection: new estimates of age-specific antibody to HCV seroprevalence. Hepatology. 2013;57(4):1333–42.
2. Trubnikov M, Yan P, Archibald C. Estimated prevalence of Hepatitis C virus infection in Canada, 2011. CCDR. 2014;40(19):429–42.
3. Communicable Disease Prevention and Control Services. British Columbia Annual Summary of Reportable Diseases 2013. Vancouver: BC Centre for Disease Control; 2014.
4. Yu A, Spinelli JJ, Cook DA, Buxton JA, Krajden M. Mortality among British Columbians testing for hepatitis C antibody. BMC Public Health. 2013;13:291. 5. Simmons B, Saleem J, Heath K, Cooke GS, Hill A. Long-Term Treatment
Outcomes of Patients Infected With Hepatitis C Virus: A Systematic Review and Meta-analysis of the Survival Benefit of Achieving a Sustained Virological Response. Clinical Infect Dis. 2015;61(5):730–40.
6. Kohli A, Shaffer A, Sherman A, Kottilil S. Treatment of hepatitis C: a systematic review. JAMA. 2014;312(6):631–40.
7. Canadian Agency for Drugs and Technologies in Health. Holkira (Ombitasvir/Paritaprevir/Ritonavir with Dasabuvir) and Harvoni (Ledipasvir/ Sofosbuvir) for Chronic Hepatitis C: A Review of the Clinical Evidence. Canadian Agency for Drugs and Technologies in Health. Ottawa (ON); 2015. 8. Rotermann M, Langlois K, Andonov A, Trubnikov M. Seroprevalence of
hepatitis B and C virus infections: Results from the 2007 to 2009 and 2009 to 2011 Canadian Health Measures Survey. Health Rep. 2013;24(11):3–13. 9. BC Cancer Agency [creator]. BC Cancer Agency Registry Data (2013). Data
Extract. Vancouver, BC: Cancer Agency [publisher]; 2014.
10. British Columbia Ministry of Health [creator]. PharmaNet. Victoria, BC: British Columbia Ministry of Health [publisher]; Data Extract. MOH (2013); 2014. http://www.health.gov.bc.ca/data/.
11. British Columbia Ministry of Health [creator]. Medical Services Plan (MSP) Payment Information File. Victoria, BC: British Columbia Ministry of Health [publisher]; Data Extract. MOH (2013). 2014. http://www.health.gov.bc.ca/data/. 12. British Columbia Ministry of Health [creator]. Discharge Abstract Database
(Hospital Separations). Victoria, BC: British Columbia Ministry of Health [publisher]. Data Extract. MOH (2013). 2014. http://www.health.gov.bc.ca/data/. 13. British Columbia Vital Statistics Agency [creator]. Vital Statistics Deaths.
Victoria, BC: British Columbia Vital Statistics Agency [publisher]. Data Extract. British Columbia Vital Statistics Agency (2014). 2014.
14. Janjua NZ, Kuo M, Chong M, Yu A, Alvarez M, Cook D, Armour R, Aiken C, Li K, Mussavi Rizi SA et al. Assessing Hepatitis C Burden and Treatment Effectiveness through the British Columbia Hepatitis Testers Cohort (BC-HTC): Design and Characteristics of Linked and Unlinked Participants. PLoS One. 2016;11(3): e0150176.
15. BC Centre for Disease Control. Management of Specific Diseases: Hepatitis C. In:Communicable Disease Control Manual.Vancouver: BC Centre for Disease Control; 2013.
16. Pampalon R, Hamel D, Gamache P, Philibert MD, Raymond G, Simpson A. An area-based material and social deprivation index for public health in Quebec and Canada. Can J Public Health. 2012;103(8 Suppl 2):S17–22. 17. Environics Analytics. 2011 CensusPlus. Edited by Environics Analytics.
Toronto, ON 2013.
18. McGuinness L. BCCDC Enhanced Hepatitis Strain Surveillance System (EHSSS) Site Report 2000–2011. Vancouver: BC Centre for Disease Control; 2014. 19. Armstrong GL, Wasley A, Simard EP, McQuillan GM, Kuhnert WL, Alter MJ.
The prevalence of hepatitis C virus infection in the United States, 1999 through 2002. Ann Intern Med. 2006;144(10):705–14.
20. Denniston MM, Jiles RB, Drobeniuc J, Klevens RM, Ward JW, McQuillan GM, Holmberg SD. Chronic hepatitis C virus infection in the United States, National Health and Nutrition Examination Survey 2003 to 2010. Ann Intern Med. 2014; 160(5):293–300.
21. Galbraith JW, Franco RA, Donnelly JP, Rodgers JB, Morgan JM, Viles AF, Overton ET, Saag MS, Wang HE. Unrecognized chronic hepatitis C virus infection among baby boomers in the emergency department. Hepatology. 2015;61(3):776–82.
22. Smith BD, Morgan RL, Beckett GA, Falck-Ytter Y, Holtzman D, Ward JW. Hepatitis C virus testing of persons born during 1945-1965:
recommendations from the Centers for Disease Control and Prevention. Ann Intern Med. 2012;157(11):817–22.
23. Schanzer DL, Paquette D, Lix LM. Historical trends and projected hospital admissions for chronic hepatitis C infection in Canada: a birth cohort analysis. CMAJ Open. 2014;2(3):E139–44.
24. Health Canada. Guidelines and recommendations on the prevention and control of hepatitis C.Can Commun Dis Rep1995, 21 Suppl 2:1-18, 11-21. 25. Kuo M, Janjua NZ, Burchell AN, Buxton JA, Krajden M, Gilbert M. Decreasing
Hepatitis C Incidence Among a Population With Repeated Tests: British Columbia, Canada, 1993-2011. Am J Public Health. 2015;105(8):1604–10. 26. Smith BD, Yartel AK, Krauskopf K, Massoud OI, Brown KA, Fallon MB, Rein
DB. Hepatitis C virus antibody positivity and predictors among previously undiagnosed adult primary care outpatients: cross-sectional analysis of a multisite retrospective cohort study. Clin Infect Dis. 2015;60(8):1145–52. 27. Akselrod H, Grau LE, Barbour R, Heimer R. Seroprevalence of HIV, hepatitis B
virus, and HCV among injection drug users in Connecticut: understanding infection and coinfection risks in a nonurban population. Am J Public Health. 2014;104(9):1713–21.
28. Klein MB, Rollet KC, Saeed S, Cox J, Potter M, Cohen J, Conway B, Cooper C, Cote P, Gill J et al. HIV and hepatitis C virus coinfection in Canada: challenges and opportunities for reducing preventable morbidity and mortality. HIV Med. 2013;14(1):10–20.
29. Morano JP, Gibson BA, Altice FL. The burgeoning HIV/HCV syndemic in the urban Northeast: HCV, HIV, and HIV/HCV coinfection in an urban setting. PLoS One. 2013;8(5):e64321.
30. Public Health Agency of Canada. Epidemiology of acute hepatitis C infection in Canada: results from the enhanced hepatitis strain surveillance system (EHSSS). 2009.
31. Olmstead AD, Joy JB, Montoya V, Luo I, Poon AF, Jacka B, Lamoury F, Applegate T, Montaner J, Khudyakov Y et al. A molecular phylogenetics-based approach for identifying recent hepatitis C virus transmission events. Infect Genet Evol. 2015;33:101–9.
32. Janjua NZ, Yu A, Kuo M, Alavi M, Woods R, Alvarez M, Dore G, Tyndall M, Krajden M. Timing of Hepatitis B and C Diagnosis Relative to Hepatocellular Carcinoma Diagnosis in the BC Hepatitis Testers Cohort (BC-HTC). Hepatology. 2015;62(S1):480A.
• We accept pre-submission inquiries
• Our selector tool helps you to find the most relevant journal
• We provide round the clock customer support
• Convenient online submission
• Thorough peer review
• Inclusion in PubMed and all major indexing services
• Maximum visibility for your research
Submit your manuscript at www.biomedcentral.com/submit