DOI:10.1051/0004-6361/201322695 c
ESO 2015
Astrophysics
&
Photodesorption of H
2
O, HDO, and D
2
O ice and its impact
on fractionation
,
(Research Note)
Carina Arasa
1,2, Jesper Koning
1, Geert-Jan Kroes
1, Catherine Walsh
2, and Ewine F. van Dishoeck
2,31 Gorlaeus Laboratories, Leiden Institute of Chemistry, Leiden University, PO Box 9502, 2300 RA Leiden, The Netherlands 2 Leiden Observatory, Leiden University, PO Box 9513, 2300 RA Leiden, The Netherlands
e-mail:ewine@strw.leidenuniv.nl
3 Max Planck Institute for Extraterrestrial Physics, Giessenbachstrasse 1, 85748 Garching, Germany
Received 17 September 2013/Accepted 16 December 2014
ABSTRACT
The HDO/H2O ratio measured in interstellar gas is often used to draw conclusions on the formation and evolution of water in star-forming regions and, by comparison with cometary data, on the origin of water on Earth. In cold cores and in the outer regions of protoplanetary disks, an important source of gas-phase water comes from photodesorption of water ice. This research note presents fitting formulae for implementation in astrochemical models using previously computed photodesorption efficiencies for all water ice isotopologues obtained with classical molecular dynamics simulations. The results are used to investigate to what extent the gas-phase HDO/H2O ratio reflects that present in the ice or whether fractionation can occur during the photodesorption process. Probabilities for the top four monolayers are presented for photodesorption of X (X=H, D) atoms, OX radicals, and X2O and HDO molecules following photodissociation of H2O, D2O, and HDO in H2O amorphous ice at ice temperatures from 10−100 K. Significant isotope effects are found for all possible products: (1) H atom photodesorption probabilities from H2O ice are larger than those for D atom photodesorption from D2O ice by a factor of 1.1; the ratio of H and D photodesorbed upon HDO photodissociation is a factor of 2. This process will enrich the ice in deuterium atoms over time; (2) the OD/OH photodesorption ratio upon D2O and H2O photodissociation is on average a factor of 2, but the OD/OH photodesorption ratio upon HDO photodissociation is almost constant at unity for all ice temperatures; (3) D atoms are more effective in kicking out neighbouring water molecules than H atoms. However, the ratio of the photodesorbed HDO and H2O molecules is equal to the HDO/H2O ratio in the ice, therefore, there is no isotope fractionation when HDO and H2O photodesorb from the ice. Nevertheless, the enrichment of the ice in D atoms due to photodesorption can over time lead to an enhanced HDO/H2O ratio in the ice, and, when photodesorbed, also in the gas. The extent to which the ortho/para ratio of H2O can be modified by the photodesorption process is discussed briefly as well.
Key words.astrochemistry – molecular processes – ISM: molecules – solid state: volatile
1. Introduction
The abundance of water in interstellar clouds, its partitioning between gas and ice, and its evolution from collapsing cores to protoplanetary disks are topics that are directly relevant for the formation of planets and their atmospheres. Astronomers can study the water trail starting either from the very first stages of dense molecular clouds even before a star is born (Whittet et al. 1988;Boogert et al. 2008;Caselli et al. 2012) or working back-wards from the oceans on our own planet Earth, trying to link its composition to that of icy solar system bodies (e.g.,Nuth 2008; Mumma & Charnley 2011, and see summary invan Dishoeck et al. 2014). In both approaches, the HDO/H2O ratio is thought to be a good indicator of the relevant processes involving water. Specifically, the fact that the HDO/H2O abundance of 3.1×10⁻⁴ in Earth’s oceans (de Laeter et al. 2003) is a factor of 2 lower than that found in most comets (Villanueva et al. 2009) has been
Appendices are available in electronic form at
http://www.aanda.org
Compiled simulation data and raw data are only available at the CDS via anonymous ftp tocdsarc.u-strasbg.fr(130.79.128.5) or via
http://cdsarc.u-strasbg.fr/viz-bin/qcat?J/A+A/575/A121
used as an argument that most water on Earth originates from impact of asteroids rather than comets (Raymond et al. 2004)1. Recent observations with theHerschelSpace Observatory have found at least two comets for which the HDO/H2O ratio is nearly the same as that in Earth’s oceans, demonstrating that there is a population of icy bodies with similar values (Hartogh et al. 2011;Bockelée-Morvan et al. 2012). However, “hot offthe press” data from theRosettamission to comet 67 P/ Churyumov-Gerasimenko now suggest that the HDO/H2O in Jupiter family objects has a wider range than heretofore assumed triggering fur-ther debate on the origin of Earth’s water (Altwegg et al. 2014). Hence, there is increased interest in understanding what pro-cesses affect the HDO/H2O ratio from core to disk to icy plane-tary bodies.
Physical-chemical models of the collapse of interstellar clouds and disk formation suggest that the bulk of water is formed on grains in the dense pre-collapse stage and enters the disk as ice that is largely unaltered since its formation (e.g., Aikawa & Herbst 1999;Visser et al. 2009). If so, the HDO/H2O ratio in the disk (and eventually in the planetesimals and planets 1 The measured HDO/H2O ratio is 2×(D/H) in water; the latter values are commonly used in the literature.
that formed from it) should reflect the ice values found in the in-terstellar cloud from which the star formed. Recent simulations of deuterium chemistry in protoplanetary disks show that, in the absence of strong vertical mixing, a high initial HDO/H2O ratio is required in the ice to reproduce the values seen in solar sys-tem bodies (Furuya et al. 2013;Albertsson et al. 2014;Cleeves et al. 2014). In cold clouds prior to star formation and in the cold outer envelopes of low-mass protostars (T <20 K), high ratios of deuterated species up to a few×10−2 have been found for many molecules including water (e.g.,van Dishoeck et al. 1995; Ceccarelli et al. 1998;Bacmann et al. 2003;Parise et al. 2004, 2012; and see review byCeccarelli et al. 2014). Although the fractionation of HDO is generally not as high as that of other molecules, values of HDO/H2O up to a few % have been in-ferred in cold gas (Liu et al. 2011;Coutens et al. 2012), higher than those found in comets. They are also high compared with the upper limits on HDO/H2O measured directly in interstellar ices of<(1−5)×10−3 (Dartois et al. 2003;Parise et al. 2003). Moreover, the HDO/H2O ratio in warm gas (>100 K) near pro-tostars typically has lower values of∼10−3, within a factor of a few of those of comets (e.g.,Gensheimer et al. 1996;van der Tak et al. 2006; Jørgensen & van Dishoeck 2010b; Persson et al. 2014;Emprechtinger et al. 2013;Neill et al. 2013;Coutens et al. 2014a,b). These differences raise the question whether the high HDO/H2O values measured in cold gas reflect the HDO/H2O value in the ice or whether they have been altered by desorption processes.
In cold clouds, the bulk of the water is present as ice with only a small fraction of water in the gas, typically 10−4of that of ice (e.g.,Boonman & van Dishoeck 2003;Caselli et al. 2012). The water ice is formed in an early stage of cloud formation once the density and extinction reach a threshold (Cuppen & Herbst 2007). Temperatures in these regions are too low for thermal sublimation of ice, so the observed cold gas-phase water must come from non-thermal desorption processes of water ice with photodesorption a leading candidate (Hollenbach et al. 2009; Öberg et al. 2009). Indeed, both in pre-stellar cores (Caselli et al. 2012), in the outer parts of protostellar envelopes (Mottram et al. 2013;Schmalzl et al. 2014), and in the cold outer parts of disks (Dominik et al. 2005; Hogerheijde et al. 2011), the small ob-served gas-phase water amount is consistent with being due just to the photodesorption of water ice. The required UV photons are provided by the general interstellar radiation field at the out-side of the cloud or by the star in the case of a protoplanetary disk, and by the interaction of cosmic rays with H2deeper inside the cloud. Other non-thermal processes such as chemical des-orption are poorly quantified but unlikely to be significant for thick layers of water ice (Dulieu et al. 2013;Minissale & Dulieu 2014). Chemical models have so far considered mostly deu-terium fractionation processes in the gas phase or on the grains, but not during the (photo)desorption process (e.g.,Tielens 1983; Aikawa & Herbst 1999;Roberts et al. 2003;Cazaux et al. 2011; Du et al. 2012;Aikawa et al. 2012;Taquet et al. 2013and see summary invan Dishoeck et al. 2013).
In this paper, we use previously computed photodesorption probabilities to investigate the extent to which the photodesorp-tion process can modify the gas-phase HDO/H2O ratio compared with that of the ices. Experiments have demonstrated that the water photodesorption yield is typically 10−3 per incident pho-ton, but those data did not have the accuracy to establish diff er-ences between H2O and its isotopologues (Westley et al. 1995;
Öberg et al. 2009). Photodesorption can also be quantified by molecular dynamics simulations. In a series of papers, both the photodesorption mechanisms and yields have been investigated
for various water isotopologues and for different ice tempera-tures (Andersson et al. 2006;Andersson & van Dishoeck 2008; Arasa et al. 2010,2011;Koning et al. 2013). The incident UV photon is absorbed by a water molecule in the ice, which disso-ciates into H+OH, with both fragments having excess energy. The outcome depends on the ice layer in which the UV photon is absorbed; only the top layers actively participate in desorp-tion. Intact water molecules are released to the gas with a yield of∼5×10⁻⁴per incident photon through two processes: (i) re-combination of the H+OH fragments followed by escape of the energetic newly formed water molecule; and (ii) kick-out of a neighbouring water molecule by the energetic H atom produced by photodissociation. In contrast with molecules such as CO, the excited water molecule does not directly desorb since all UV absorptions immediately lead to dissociation of the molecule. Koning et al.(2013) have investigated the yields for the vari-ous processes using all combinations of water and its isotopo-logues, i.e., HDO and D2O in H2O ice but also H2O in D2O ice. Isotope-selective effects are found for the various combinations because of the different masses of the fragments. For example, if a D atom is created upon photodissociation, it is more effective in kicking out a neighbouring molecule than an H atom because of more efficient momentum transfer.
We here summarise the calculated photodesorption effi cien-cies as a function of ice layer and ice temperature for the astro-nomically relevant cases of H2O, HDO, and D2O in H2O ice, and we provide convenient fitting formulae with depth into the ice for use in astrochemical models. Subsequently the isotope-selective effects are quantified. Specifically, the more effective desorption of atomic H compared with atomic D will result in enrichment of D in the ice. Furthermore, the extent to which the photodes-orption process can affect the ortho/para ratio of H2O in the gas is briefly discussed. Section2briefly summarises the computa-tional methods that were used in previous papers. Section3lists the results for the isotope selective processes for each ice layer at ice temperatures from 10−90 K. Section 4 summarises the conclusions and astrophysical implications.
2. Methods
Our methods have been explained in detail in our previous stud-ies (Andersson et al. 2006;Andersson & van Dishoeck 2008; Arasa et al. 2010,2011;Koning et al. 2013), and are based on classical Molecular Dynamics (MD) methods (Allen & Tildesley 1987), in which the atoms and molecules in water ice move ac-cording to Newton’s equations based on analytical potentials of the interactions. In brief, an amorphous ice consisting of 480 wa-ter molecules is built for a certain ice temperature, and one wawa-ter molecule (X2O (X=H or D) or HDO) is then randomly selected to be dissociated by UV radiation. Our previous studies show that only the photoexcited molecules that are initially located in the top four monolayers lead to photodesorption processes.
Fig. 1.Top: a H2O molecule (with H atoms in yellow) surrounded by water molecules absorbs an UV photon and dissociates into H and OH. H and OH recombine to form H2O that eventually desorbs from the ice surface via the direct mechanism.Bottom: a D2O molecule (with D atoms in black) surrounded by water molecules absorbs an UV photon and dissociates into D and OD. The heavier D atom transfers its momentum to one of the surrounding H2O molecules that desorbs from the ice via the “kick-out” mechanism.
of the surrounding H2O molecules from the ice can also des-orb, initiated by the same UV photon. This mechanism is called “kick-out” (Andersson et al. 2006;Andersson & van Dishoeck 2008), and it takes place when the energetic X atom produced by photodissociation kicks a surrounding molecule from the ice by transfer of its momentum, and eventually the kicked out H2O molecule desorbs from the ice.
The calculations are repeated≥6000 times per species and per monolayer so that the statistics (i.e., probabilities) of the dif-ferent outcomes are determined as a function of the initial posi-tion of the molecule in the ice. The water molecules are excited with UV radiation in the 7.5−9.5 eV (1650−1300 Å) range, cor-responding to the first electronic absorption band of water ice. Throughout the paper,∗indicates the molecule that is photodis-sociated in the ice. For the case of HDO∗ there are two pos-sible outcomes: HOD∗ indicates photodissociation to H+OD whereas DOH∗denotes dissociation to D+OH; HDO and HDO∗ denote the generic case.
In our previous studies (Arasa et al. 2010, 2011) we calculated the total photodesorption yields of OX and X2O per incident photon, and compared the results with the available ex-perimental data (Öberg et al. 2009). For our model D2O ice, the photodesorption yield agrees well with the experimental pho-todesorption yield at low ice temperatures within the∼60% ex-perimental uncertainties (Arasa et al. 2011). At higher ice tem-peratures, the experimental photodesorption yield is larger than the calculated value due to long timescale thermal effects that cannot be considered in our simulations. The experimental OX/H2O ratio is however on average a factor of 2 to 3 lower than the calculated value for H2O ice (see Table II inArasa et al.
2010), and D2O ice, respectively. In a different kind of experi-ment,Yabushita et al.(2009) measured the final translational and rotational energies of the kicked out H2O molecules forυ=0 at
Tice=90 K; their values match well with our calculated ones at
Tice =90 K and provide proof for the importance of the kick-out mechanism (Arasa et al. 2010). These comparisons between models and data provide confidence in the accuracy of our sim-ulations. For isotope selective processes, only relative trends are considered, which should have less uncertainty than the absolute values.
3. Results and discussion
In this section we summarize the probabilities of all the pho-todesorption events after H2O∗, HDO∗and D2O∗ photodissoci-ation in amorphous H2O ice at relevant temperatures,Tice=10 and 90 K. The supplementary material contains the probabilities atTice=20, 30, and 60 K for the top four monolayers (ML) of the ice surface. These results have been reported and extensively discussed elsewhere (Koning et al. 2013), but they are presented here in tabulated form for each of the top four monolayers so that the data can be used in astrochemical models. In addition, we provide fitting formulae to these tables in Table1(see Appendix B for more details)2.
A total of 6000 trajectories per monolayer have been sim-ulated for photoexcitation of H2O and D2O. For photoexcita-tion of HDO,≥6000 trajectories were run per monolayer. The photodesorption probabilities are calculated for each event as
pi = Ni/Ntotal,i=photodesorption event,Ni=number of
tra-jectories that lead to the photodesorption eventi,Ntotal =total number of trajectories per monolayerj, the average is taken over the top four monolayers (e.g.,pi=
4
j=1p
j
i/4). All the
proba-bilities are given perabsorbed(rather than incident) UV photon. The averaged photodesorption probabilities calculated per inci-dent UV photon are on average a factor of∼0.03 smaller than 2 All tables can be downloaded from http://www.strw.
Table 1.Fitting functions and best-fit values of the parametersa,b,c, and ML, ML being the number of the monolayer.
Species a b c
Xdes+OYtrapped P(ML)=(aML) exp (−bML)
H2O 2.02 0.858 · · ·
D2O 2.06 0.906 · · ·
HOD 2.04 0.867 · · ·
DOH 2.17 0.942 · · ·
Xtrapped+OYdes
P(ML)=(aML) exp (−b(ML−c)2)
H2O 4.28 0.0485 –10.9
D2O 0.0141 0.377 0.264
HOD 0.00359 0.635 0.990
DOH 0.0114 0.450 0.751
Xdes+OYdes
P(ML)=(aML) exp (−b(ML−c)2)
H2O 0.0710 0.210 –1.77
D2O 0.0638 0.554 0.269
HOD 0.0463 0.383 –0.383
DOH 0.0659 0.484 0.0538
Xtrapped+OYtrapped P(ML)=a(1−exp (−bMLc))
H2O 0.516 0.149 1.48
D2O 0.458 0.163 1.57
HOD 0.595 0.125 1.60
DOH 0.574 0.111 1.89
XYOdirect
P(ML)=(aML) exp (−b(ML−c)2)
H2O 0.390 0.0819 –6.04
D2O 0.00523 0.470 0.967
HOD 0.00428 0.604 1.12
DOH 0.00494 0.570 1.11
H2Okicked
P(ML)=(aML) exp (−b(ML−c)2) H2O 0.00320 0.210 0.882
D2O 0.00865 0.452 1.83
HOD 0.00465 0.193 0.419 DOH 0.00949 0.180 0.519
Notes.The species XOY denotes photoexcitation of XOY leading to dissociation into X+OY. The units of the parameters, a, b, and c, depend on the fitting function which itself describes a probability and thus has no physical units. For outcome (1), Xdes+OYtrapped,aandb have units of ML−1, where ML is monolayer number. For outcome (4), Xtrapped+OYtrapped,ahas no units andbhas units of ML−c. For all other
outcomes,ahas units of ML−1,bhas units of ML−2, andchas units of ML.
those given per absorbed UV photon for processes (1), (2), (3) and (5) (see numbering of outcomes in Sect. 2 of this paper and the description inArasa et al. 2010,2011).
Above 100 K, thermal desorption takes over as the main des-orption mechanism in interstellar space, so our results are not relevant for the interpretation of data on warm water.
3.1. X (X = H, D) atom photodesorption probabilities
The X atom photodesorption event is the dominant process when the X2O photodissociated molecule is located in the top four monolayers of the ice surface (see Table2andAndersson et al. 2006; Andersson & van Dishoeck 2008). The X atom photodesorption probabilities are >90% in the top monolayer (ML1) and decrease with depth to∼30% in ML4 because in the top MLs the X atoms can easily find their way to escape from
the surface, whereas deeper in the ice there are other molecules that prevent their desorption.
In general, H atom photodesorption probabilities are some-what larger following H2O dissociation than those for D atom photodesorption after D2O photodissociation in H2O ice, espe-cially if initially the molecules are located in the third and fourth monolayers. The same trend is observed after HOD∗/DOH∗ pho-todissociation in H2O ice: H atom photodesorption probabilities are larger than those for the D atom. This is because of isotope mass effects: the H atom is lighter than the D atom and therefore transfers less energy to nearby water molecules, so that it can travel more easily from the bottom to the top of the surface and eventually desorb to the gas phase (Arasa et al. 2011; Koning et al. 2013).
The average H/D photodesorption ratios following H2O∗and D2O∗ photodissociation and the average H/D ratios following HDO∗photodissociation over the top four MLs are summarized in Table 3 versus ice temperature. The photodesorption ratio Hdes
Ddes after HDO photodissociation have been calculated (as was
done for the photodesorptionODdes
OHdes in Table IV inKoning et al.
2013) taking into account the probabilities in each ML,i, where
PDdes(i,Tice) is the D photodesorption probability after DOH∗
photodissociation into D and OH, andPHdes(i,Tice) is the H
pho-todesorption probability after HOD∗ photodissociation into H and OD), and the branching ratios (H+OD
D+OH) in the ice in each ML,
i, and temperature (β(i,Tice)). The effect is typically a factor of 1.1 when comparing H2O and D2O, and when comparing HOD in H2O and DOH in H2O.
For HDO∗photodissociation, there is another effect at work, namely that the probability of dissociation into H + OD is larger than that into D + OH, a process that is well known in the gas phase. For gas-phase photodissociation, the OD/OH branching ratio is about 3.1 (van Harrevelt & van Hemert 2012, priv. comm. regarding unpublished data in Table I in van Harrevelt & van Hemert 2001). In the ice, this effect is less, but still at the factor of two level. The HDO∗ photodissociation branching ratios (H+OD
D+OH) in the ice in each ML,i, and temperature (β(i,Tice)) were calculated and listed in Table IV inKoning et al. (2013). The average branching ratio taken over all ice tempera-tures is about 2.2 in favor of H+OD. Thus the branching ratio upon HDO photodissociation in the ice reinforces the H/D des-orption ratio leading to a ratio more than a factor of two larger than the ratio of H and D present in the ice (calculated from Tables2 andA.1). Therefore, all photons that arrive in the ice and are absorbed in the top layers of the ice surface lead to an enrichment in D atoms relative to H atoms in the ice mantles of dust particles.
3.2. OX (X = H, D) radical photodesorption probabilities
The second most important photodesorption event is OX pho-todesorption with probabilities of typically a few % in the top layers. In Table 4 the OX radical photodesorption prob-abilities for the top four monolayers together with the aver-age values taken over the top four MLs are summarised at
Table 2.X atom photodesorption probabilities atTice=10 K (top) and 90 K (bottom) resulting from photoexcitation of a X2O (X=H, D) or XOY (HOD or DOH) molecule present in a specific monolayer of H2O ice.
ML Hdes/H2O∗ Ddes/D2O∗ Hdes/HOD∗ Ddes/DOH∗ Tice=10 K
1 0.920±3.9×10⁻³ 0.900±4.0×10⁻³ 0.911±2.8×10⁻³ 0.912±3.5×10⁻³ 2 0.700±5.8×10⁻³ 0.681±6.0×10⁻³ 0.751±4.3×10⁻³ 0.710±5.6×10⁻³ 3 0.510±6.0×10⁻³ 0.488±6.3×10⁻³ 0.521±4.9×10⁻³ 0.472±6.0×10⁻³ 4 0.340±5.2×10⁻³ 0.231±5.4×10⁻³ 0.259±4.3×10⁻³ 0.190±4.7×10⁻³
MLs 0.617±3.2×10⁻³ 0.575±3.2×10⁻³ 0.610±4.1×10⁻³ 0.572±5.0×10⁻³ Tice=90 K
1 0.922±3.9×10⁻³ 0.891±4.0×10⁻³ 0.910±3.4×10⁻³ 0.910±3.5×10⁻³ 2 0.763±5.3×10⁻³ 0.682±6.0×10⁻³ 0.660±6.0×10⁻³ 0.630±6.0×10⁻³ 3 0.425±5.6×10⁻³ 0.407±6.3×10⁻³ 0.460±6.3×10⁻³ 0.380±6.0×10⁻³ 4 0.320±3.4×10⁻³ 0.231±5.4×10⁻³ 0.320±6.0×10⁻³ 0.250±5.3×10⁻³
MLs 0.608±3.2×10⁻³ 0.553±3.2×10⁻³ 0.589±5.5×10⁻³ 0.543±5.0×10⁻³
[image:5.595.310.555.282.461.2]Notes.ML1 is the top monolayer andMLsdenotes the average over the top four monolayers.
Table 3.Average photodesorption ratioHdes
Ddes following H2O
∗, D2O∗and
HDO∗photodissociation.
Tice
Hdes
Ddes
(K) H2O∗and D2O∗ HDO∗
10 1.07±0.01 2.36±0.01 1.01±0.01 20 1.06±0.01 2.43±0.02 1.19±0.01 30 1.06±0.01 2.45±0.02 1.08±0.01 60 1.06±0.01 2.55±0.02 1.11±0.01 90 1.10±0.01 2.47±0.02 1.08±0.01
Notes.For HDO∗, the last column shows the result without considering the effect of branching in the photodissociation.
The OH photodesorption probabilities after DOH∗ pho-todissociation and OD photodesorption probabilities after D2O∗ photodissociation are larger than those for OD after HOD∗ photodissociation and OH after H2O∗ in H2O ice. This result is expected because the OD radicals have higher kinetic energies than the OH radicals upon the initial D2O and H2O photodis-sociation, respectively. In contrast, the OH radicals have higher kinetic energy than the OD radicals upon HDO∗ photodissocia-tion. These findings follow from applying energy and momen-tum conservation (pOX+pX = 0, and EOX+EX = ΔE, with
ΔE being the initial available energy;ΔE = Eexc−Ediss(X2O), seeArasa et al. 2011) . For X2O photodissociation at the same excitation energyEexcit is seen that ifEOX= ΔE/(1+mOX/mX), the initial energy of OD should be a factor 1.8 larger than that for OH. In the case of X(1)OX(2)photodissociation into OX(2)+X(1), and applying the same conservation rules we can expect that the energy of the OX(2)radical formed upon DOX(2) photodissocia-tion is about a factor of two larger than the OX(2)radical formed upon HOX(2) photodissociation (see Table III inKoning et al.
2013).
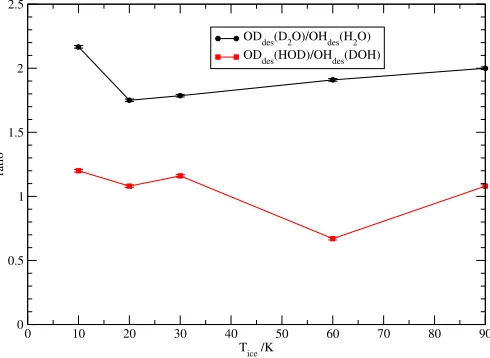
The average OD/OH photodesorption ratios following HDO∗ photodissociation over the top four MLs are summarised in Fig.2. The photodesorption ratio ODdes/OHdesafter HOD∗and DOH∗ photodissociation have been calculated taking account the probabilities in each ML,i, wherePODdes(i,Tice) is the OD
photodesorption probability after HOD∗ photodissociation into H and OD, andPOHdes(i,Tice) is the OH photodesorption
prob-ability after DOH∗ photodissociation into D and OH, and the photodissociation branching ratios H+OD/D+OH in the ice in each ML,i, and temperature (β(i,Tice), see Table IV inKoning
et al.(2013). These values are seen to be close to unity and to
0 10 20 30 40 50 60 70 80 90
Tice /K 0
0.5 1 1.5 2 2.5
ratio
ODdes(D2O)/OHdes(H2O) ODdes(HOD)/OHdes(DOH)
Fig. 2.ODdes(D2O)/OHdes(H2O) ratios and ODdes(HOD)/OHdes(DOH) ratios averaged over the top four monolayers following HDO dissoci-ation in H2O ice versus ice temperatureTice (based onKoning et al.
2013).
be mostly constant with ice temperature. The reason that the ODdes/OHdesratios are close to unity for HDO∗is that a cancel-lation of the two effects occurs. On the one hand, the OH des-orption is more efficient than that of OD, as explained above. However, this is offset by the OD/OH branching ratio of about 2.2 in the HDO∗ photodissociation, as discussed in Sect.3.1. As a result, the average photodesorption ratio ODdes/OHdesupon HDO∗ photodissociation is about 1.0 with a standard deviation of 0.2 in the ice (Koning et al. 2013). Note that this result is very different from pure gas-phase chemistry, where OD is produced a factor of three more rapidly than OH by photodissociation of gaseous HDO.
Figure 2 also contains the average photodesorption ratios between OD desorption following D2O photodissociation in H2O ice and OH desorption following H2O photodissociation in H2O ice for all ice temperatures considered. On average, the ODdes(D2O)/OHdes(H2O) ratio is about 1.9.
3.3. X2O (X = H, D) and HDO molecule photodesorption probabilities
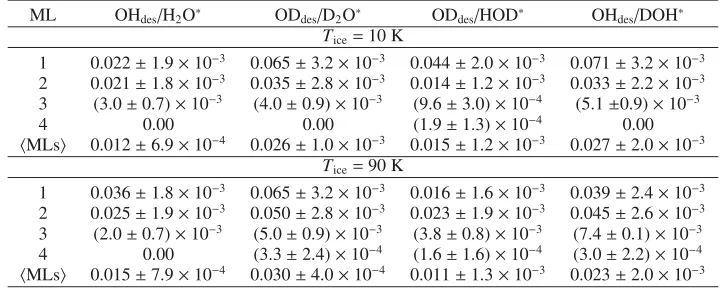
Table 4.OX radical photodesorption probabilities atTice=10 K (top) and 90 K (bottom) resulting from photoexcitation of a X2O (X=H, D) or XOY (HOD or DOH) molecule present in a specific monolayer of H2O ice.
ML OHdes/H2O∗ ODdes/D2O∗ ODdes/HOD∗ OHdes/DOH∗
Tice=10 K
1 0.022±1.9×10⁻³ 0.065±3.2×10⁻³ 0.044±2.0×10⁻³ 0.071±3.2×10⁻³ 2 0.021±1.8×10⁻³ 0.035±2.8×10⁻³ 0.014±1.2×10⁻³ 0.033±2.2×10⁻³ 3 (3.0±0.7)×10−3 (4.0±0.9)×10−3 (9.6±3.0)×10−4 (5.1±0.9)×10−3
4 0.00 0.00 (1.9±1.3)×10−4 0.00
MLs 0.012±6.9×10⁻⁴ 0.026±1.0×10⁻³ 0.015±1.2×10⁻³ 0.027±2.0×10⁻³ Tice=90 K
1 0.036±1.8×10⁻³ 0.065±3.2×10⁻³ 0.016±1.6×10⁻³ 0.039±2.4×10⁻³ 2 0.025±1.9×10⁻³ 0.050±2.8×10⁻³ 0.023±1.9×10⁻³ 0.045±2.6×10⁻³ 3 (2.0±0.7)×10−3 (5.0±0.9)×10−3 (3.8±0.8)×10−3 (7.4±0.1)×10−3 4 0.00 (3.3±2.4)×10−4 (1.6±1.6)×10−4 (3.0±2.2)×10−4
MLs 0.015±7.9×10⁻⁴ 0.030±4.0×10⁻⁴ 0.011±1.3×10⁻³ 0.023±2.0×10⁻³
[image:6.595.97.504.333.491.2]Notes.ML1 is the top monolayer andMLsdenotes the average over the top four monolayers.
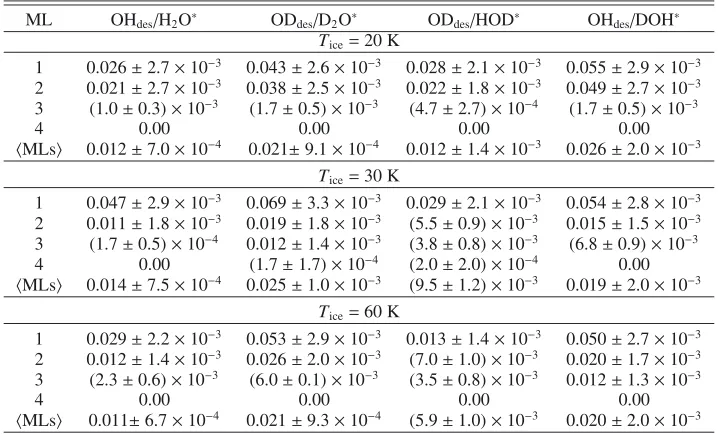
Table 5.Total X2O (X=H, D) or XOY (HOD or DOH) photodesorption probabilities atTice=10 K (top) and 90 K (bottom) per monolayer due to the direct and the kick-out mechanism for X2O and XOY photodissociation in H2O ice.
H2O∗ D2O∗ HOD∗ DOH∗
ML H2Odirect H2Okicked D2Odirect H2Okicked HODdirect H2Okicked DOHdirect H2Okicked Tice=10 K
1 5.7±1.1 0.5±0.2 6.8±1.1 12.8±1.5 5.6±0.7 2.2±0.5 5.3±0.9 2.9±0.7 2 7.4±1.2 3.9±1.3 9.2±1.2 17.8±1.7 5.1±0.7 2.7±0.5 7.0±1.0 10.7±1.3 3 1.7±0.8 4.8±1.1 1.0±0.4 16.5±1.6 2.9±0.5 0.8±0.3 1.6±0.5 1.2±0.4 4 0.00 0.6±0.3 0.3±0.2 4.3±0.9 0.1±0.1 1.2±0.3 0.00 0.9±0.4
MLs 3.7±0.4 2.5±0.2 4.3±0.4 6.6±0.5 3.4±0.6 1.7±0.4 3.5±0.7 3.9±0.8 Tice=90 K
1 5.3±1.1 1.4±0.8 6.8±0.1 12.8±1.5 2.6±0.6 5.4±0.9 6.8±0.1 15.6±1.5 2 9.6±1.3 3.9±0.9 9.2±1.2 17.8±1.7 6.7±1.1 12.2±1.4 6.6±1.0 21.8±1.8 3 2.6±0.8 5.2±0.9 1.0±0.4 16.5±1.6 1.0±0.4 7.2±1.1 0.8±0.3 21.0±1.8 4 0.00 2.3±0.7 0.3±0.2 4.3±0.9 0.3±0.2 2.9±0.7 1.2±0.4 0.8±0.3
MLs 4.4±0.4 3.2±0.4 4.3±0.1 12.0±1.0 2.7±0.7 6.9±1.0 3.9±0.8 15.0±1.5
Notes.All values should be multiplied by 10−3. The notation H
2O∗and HOD∗denote photoexcitation of H2O and HDO in H2O ice in which the H atom resulting from photodissociation kicks out a neigbouring H2O molecule. The notation D2O∗and DOH∗indicate the analogous process in which the resulting D atom kicks out a neighbouring H2O molecule.
probabilities of ∼0.5% in the top layers. As discussed above, two processes can occur: direct desorption of the recombined H2O or D2O molecule or through the kick of the energetic X atom to a surrounding H2O molecule from the ice. When HOD∗ dissociates it can also lead to the recombination of the H and OD fragments that eventually desorb as HDO, or the H atom can kick out the surrounding H2O molecules from the ice. Similarly, when DOH∗dissociates the photofragments can also recombine and desorb, or the D atom can kick out a H2O molecule. In Table5 the probabilities of both mechanisms for the top four MLs and its average for the four different scenarios are reported atTice =10 K and 90 K. Again, isotope effects are rather no-ticeable if X2O desorbs from the ice surface through the kick-out mechanism (Koning et al. 2013) after the X atom transfers its momentum to the surrounding H2O molecules. Since the D atom is heavier than the H atom it can transfer its momentum more easily to a surrounding H2O molecule, leading to higher kick-out photodesorption probabilities, and in consequence to higher total X2O and HOD photodesorption probabilities (Arasa
et al. 2011;Koning et al. 2013). As demonstrated in Appendix C,
this process does however not lead to fractionation of HDO/H2O in the gas in H2O-dominated ices, i.e., the gas-phase HDO/H2O ratio produced by photodesorption reflects that originally in the ice.
3.4. Ortho/para ratio of photodesorbed H2O
photodesorption preserves the ortho/para ratio that was present in the ice.
In the direct photodesorption mechanism, the H-OH bond is broken and then reformed, so the ortho/para ratio is basically re-set to the statistical value of 3. For the kick-out mechanism, how-ever, the original ortho/para ratio in the ice should be preserved. The relative importance of the direct and kick-out mechanisms depends on the ice monolayer and to a lesser extent on the ice temperature. Table 5 summarises the average values over the first four monolayers of the two options. It is seen that the di-rect mechanism is typically a factor 1.3 more efficient than the kick-out mechanism for H2O. Thus, if the ortho/para ratio in the ice were low, say≤0.5, the gas-phase ortho/para ratio of the pho-todesorbed H2O would be significantly higher, at least 2, due to the photodesorption process.
Low ortho/para ratios in the ice could occur if the ratio had equilibrated to the grain temperature of typically 10−30 K, a pro-cess that in itself is still poorly understood (e.g.,Dulieu 2011). The main message here is that due to the partial reset during the photodesorption process, the observed gaseous ortho/para ratio only partially reflects the original ice ratio.
4. Conclusions
This paper has investigated the deuterium fractionation that can occur when OD, HDO or D2O molecules are liberated from a H2O-rich ice following a photodesorption event at a micro-scopic level. The results presented in Sect.3lead to the follow-ing conclusions:
1. No isotope fractionation occurs in the photodesorption of HDO and H2O from a mixed ice, even though kick-out by D is more efficient. The ratio of photodesorbed HDO and H2O is equal to the ratio of HDO and H2O in the ice. 2. No isotope fractionation occurs in the photodesorption of
OD and OH upon HDO photodissociation in H2O ice. The ratio of photodesorbed OD and OH is equal to the HDO/H2O ratio in the ice within 20%.
3. The ratio of photodesorbed H and D will be more than twice the ratio of H and D present in the ice in HDO and H2O, be-cause photo-excitation of HDO leads preferentially to des-orption of H. Therefore, given enough time and enough pho-tons photoprocessing of the outer layers of icy mantles could lead to enrichment in D relative to H.
A possible mechanism for an increased ratio of HDO/H2O in the gas phase compared with that initially in the ice may therefore be prolonged photoprocessing of the outer layers of icy mantles of dust particles. Photo-excitation of HDO leads preferentially to desorption of H. As a consequence, the ratio of photodesorbed H and D will be greater than twice the ratio of H and D present in the ice. If photoprocessing occurs over a long enough time, the outer layers will develop a larger fraction of D, and, through grain surface reactions of D with OH, therefore also of HDO. So ultimately, the ratio of photodesorbed HDO and H2O can be-come enhanced due to this indirect process. Full gas-grain mod-els that take the multi-layer structure of the ice into account are needed to investigate whether this is a plausible mechanism for isotope fractionation of HDO, since pure gas-phase processes can also lead to fractionation (e.g.,Aikawa et al. 2012). If it is, then the relative abundance of HDO may also reflect the total fluence of UV radiation (product of UV flux and time) that the outer layers of icy mantles have been exposed to in the environ-ment where they are observed.
Finally, we note that the ortho/para ratio of water in the gas does not directly reflect that in the ice but is partially reset by the photodesorption process.
Acknowledgements. The authors are grateful to M. C. van Hemert for discus-sions on the setup of the Wigner distributions and the data for the gas-phase partial absorption spectra of HDO, and to S. Andersson for providing the ini-tial MD photodissociation code. This project was funded by NWO astrochem-istry grant No. 648.000.010 and from the European Union A-ERC grant 291141 CHEMPLAN.
References
Aikawa, Y., & Herbst, E. 1999, ApJ, 526, 314
Aikawa, Y., Wakelam, V., Hersant, F., Garrod, R. T., & Herbst, E. 2012, ApJ, 760, 40
Albertsson, T., Semenov, D., & Henning, Th. 2014, ApJ, 784, 39
Allen, M. P., & Tildesley, D. J. 1987, Computer Simulations of Liquids (Oxford: Clarendon)
Altwegg, K., Balsiger, H., Bar-Nun, A., et al. 2014, Science, 347, 6220 Andersson, S., Al-Halabi, A., Kroes, G. J., & van Dishoeck, E. F. 2006,
J. Chem. Phys., 124, 064715
Andersson, S., & van Dishoeck, E. F. 2008, A&A, 491, 907
Arasa, C., Andersson, S., Cuppen, H. M., van Dishoeck, E. F., & Kroes, G. J. 2010, J. Chem. Phys., 132, 184510
Arasa, C., Andersson, S., Cuppen, H. M., van Dishoeck, E. F., & Kroes, G. J. 2011, J. Chem. Phys., 134, 164503
Bacmann, A., Lefloch, B., Ceccarelli, C., et al. 2003, ApJ, 585, L55
Bockelée-Morvan, D., Biver, N., Swinyard, B., et al. 2012, A&A, 544, L15
Boogert, A. C. A., Pontoppidan, K. M., Knez, C., et al. 2008, ApJ, 678, 985
Boonman, A. M. S., & van Dishoeck, E. F. 2003, A&A, 403, 1003 Caselli, P., Keto, E., Bergin, E. A., et al. 2012, ApJ, 759, L37 Cazaux, S., Caselli, P., & Spaans, M. 2011, ApJ, 741, L34
Ceccarelli, C., Castets, A., Loinard, L., Caux, E., & Tielens, A. G. G. M. 1998, A&A, 338, L43
Ceccarelli, C., Caselli, P., Bockelée-Morvan, D., et al. 2014, Protostars & Planets VI (Tucson: Univ. Arizona Press), 859
Choi, Y., van der Tak, F. F. S., Bergin, E. A., & Plume, R. 2014, A&A, 572, L10 Cleeves, L. I., Bergin, E. A., Alexander, C. M. O’D., et al. 2014, Science, 345,
1590
Coutens, A., Vastel, C., Caux, E., et al. 2012, A&A, 539, A132 Coutens, A., Jørgensen, J. K., Persson, M. V., et al. 2014a, ApJ, 792, L5 Coutens, A., Vastel, C., Hincelin, U., et al. 2014b, MNRAS, 445, 1299 Cuppen, H. M., & Herbst, E. 2007, ApJ, 668, 294
Dartois, E., Thi, W.-F., Geballe, T. R., et al. 2003, A&A, 399, 1009
de Laeter, J. R., Böhlke, J. K., De Bièvre, P., et al. 2003, Pure and Applied Chemistry, 75, 683
Dominik, C., Ceccarelli, C., Hollenbach, D., & Kaufman, M. 2005, ApJ, 635, L85
Du, F., Parise, B., & Bergman, P. 2012, A&A, 544, C4 Dulieu, F. 2011, in IAU Symp., 280, 405
Dulieu, F., Congiu, E., Nobel, J., et al. 2013, Nature Sci. Rep., 3, 1338 Emprechtinger, M., Lis, D. C., Rolffs, R., et al. 2013, ApJ, 765, 61 Flagey, N., Goldsmith, P. F., Lis, D. C., et al. 2013, ApJ, 762, 11
Furuya, K., Aikawa, Y., Nomura, H., Hersant, F., & Wakelam, V. 2013, ApJ, 779, 11
Gensheimer, P. D., Mauersberger, R., & Wilson, T. L. 1996, A&A, 314, 281
Hartogh, P., Lis, D. C., Bockelée-Morvan, D., et al. 2011, Nature, 478, 218 Herczeg, G. J., Karska, A., Bruderer, S., et al. 2012, A&A, 540, A84
Hogerheijde, M. R., Bergin, E. A., Brinch, C., et al. 2011, Science, 334, 338
Hollenbach, D., Kaufman, M. J., Bergin, E. A., & Melnick, G. J. 2009, ApJ, 690, 1497
Jørgensen, J. K., & van Dishoeck, E. F. 2010, ApJ, 725, L172
Koning, J., Kroes, G. J., & Arasa, C. 2013, J. Chem. Phys., 138, 104701 Liu, F.-C., Parise, B., Kristensen, L., et al. 2011, A&A, 527, A19 Marquardt, D. W. 1963, J. Soc. Ind. Appl. Math., 11, 431 Minissale, M, & Dulieu, F. 2014, J. Chem. Phys., 141, 14304
Mottram, J. C., van Dishoeck, E. F., Schmalzl, M., et al. 2013, A&A, 558, A126
Nuth, J. A. 2008, Earth, Moon and Planets, 102, 435
Öberg, K. I., Linnartz, H., Visser, R., & van Dishoeck, E. F. 2009, ApJ, 693, 1209
Parise, B., Simon, T., Caux, E., et al., 2003, A&A, 410, 897 Parise, B., Castets, A., Herbst, E., et al. 2004, A&A, 416, 159 Parise, B., Du, F., Liu, F.-C., et al. 2012, A&A, 542, L5
Persson, M. V., Jørgensen, J. K., van Dishoeck, E. F., & Harsono, D. 2014, A&A, 563, A74
Raymond, S. N., Quinn, T., & Lunine, J. I. 2004, Icarus, 168, 1 Roberts, H., Herbst, E., & Millar, T. J. 2003, ApJ, 591, L41 Schmalzl, M., Visser, R., Walsh, C., et al. 2014, A&A, 572, A81 Taquet, V., Peters, P. S., Kahane, C., et al. 2013, A&A, 550, A127 Tielens, A. G. G. M. 1983, A&A, 119, 177
van der Tak, F. F. S., Walmsley, C. M., Herpin, F., & Ceccarelli, C. 2006, A&A, 447, 1011
van Dishoeck, E. F., Blake, G. A., Jansen, D. J., & Groesbeck, T. D. 1995, ApJ, 447, 760
van Dishoeck, E. F., Herbst, E., & Neufeld, D. A. 2013, Chem. Rev., 113, 9043
van Dishoeck, E. F., Bergin, E. A., Lis, D. C., & Lunine, J. I. 2014, Protostars & Planets VI (Tucson: Univ. Arizona Press), 835
van Harrevelt, R., & van Hemert, M. C. 2001, J. Chem. Phys., 114, 9453 Villanueva , G. L., Mumma, M. J., Bonev, B. P., et al. 2009, ApJ, 690, L5 Visser, R., van Dishoeck, E. F., Doty, S. D., & Dullemond, C. P. 2009, A&A,
495, 881
Westley, M. S., Baragiola, R. A., Johnson, R. E., & Baratta, G. A. 1995, Planet. Space Sci., 43, 1311
Whittet, D. C. B., Bode, M. F., Longmore, A. J., et al. 1988, MNRAS, 233, 321
Yabushita, A., Hama, T., Yokoyama, M., et al. 2009, ApJ, 699, L80
Appendix A: Auxiliary tables
TablesA.1−A.3contain the probabilities for X atom desorption, OX desorption, and X2O and HDO desorption (X=H, D), re-spectively, atTice=20, 30, and 60 K.
Appendix B: Fitting formulae for photodesorption probabilities
Tables2,4,5,A.1−A.3 list the totalprobabilities for X des-orption, OX desdes-orption, and X2O and HDO desorption (X=H, D) following a dissociation event, as a function of both mono-layer and ice temperature. These tables also give the average probabilities, over the top four monolayers, for each species. For use in astrochemical models, it is useful to know the probability (per monolayer) ofeverypotential outcome, rather than the total probability for the desorption of each species. This is because, in full gas-grain models, one is also interested in the composition of the ice mantle, as well as the gas.
As discussed in the main body of this paper, there are six potential outcomes following a dissociation event which can lead to a change in composition of both the ice and gas. For example, for HDO which is dissociated into H+OD,
HDO+hν−→Hdes+ODtrapped (B.1)
−→Htrapped+ODdes (B.2)
−→Hdes+ODdes (B.3)
−→Htrapped+ODtrapped (B.4)
−→HDOdirect (B.5)
−→H2Okicked. (B.6)
Equation (B.6) is the process known as “kick out” whereby a neighbouring H2O is ejected from the ice via momentum trans-fer from an excited photofragment. The probabilities of each of these events as a function of monolayer and ice temperature have been compiled from the raw data of the molecular dynamics sim-ulations and are available at the CDS. There is a seventh possi-bility in which the photofragments recombine to reform HDO which remains trapped in the ice. This process does not change the gas or ice composition and thus we have not listed the proba-bilities for this outcome here; however, these data are necessary if one is interested in extrapolating the probabilities to deeper monolayers, ML>4.
To determine the desorption probabilities at temperatures and in monolayers outside of those tabulated, one can simply in-terpolate/extrapolate using, for example, cubic spline interpola-tion. However, when extrapolating to determine probabilities for deeper monolayers, ML>4, one should take care to ensure that, deep into the ice mantle, the probabilities for outcomes (B.1), (B.2), (B.3), (B.5), and (B.6) tend to 0, and the probability for outcome (B.4) tends to 1−Precom, wherePrecomis the probabil-ity that the photofragments recombine to reform the molecule (which remains trapped in the ice). Deeper into the ice, des-orption events become increasingly less probable and the most probable outcome becomes trapping of the photofragments (or the reformed molecule, following recombination). In addition, at very low coverage, ML<1, the rates for all outcomes should tend to 0 as ML→0.
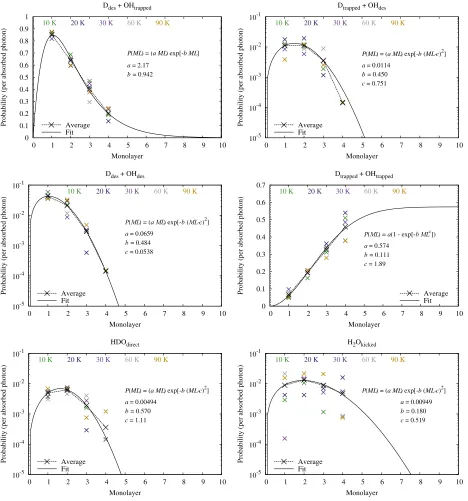
In Table1we present our fitting functions and correspond-ing best-fit parameters for thetemperature-averaged probabili-ties per monolayer for each outcome. The probabiprobabili-ties are well fitted using a Gaussian-like function with the exception of the outcomes leading to trapping of the OY radical for which an
exponential-like function was found to be more appropriate for describing the asymptotic behaviour of the probabilities towards deeper monolayers (4). In Fig.B.1we present the probability per monolayer at each temperature and the temperature-averaged probabilities per monolayer along with the fitted functions for the example of DOH∗. The probabilities were fitted using the non-linear least-squares (NLLS) Marquardt-Levenberg algo-rithm (Marquardt 1963). The probabilities are a much stronger function of monolayer than temperature; hence, our decision to fit functions with respect to monolayer only.
For implementation in chemical models which adopt the rate equation method for describing the ice chemistry and gas-grain balance, the probabilities per monolayer should be multiplied by the rate of arrival of UV photons in the wavelength range 1650−1300 Å onto the grain surface times the absorption cross section of a UV photon by a grain-surface site (or molecule, in this case, HDO). The total desorption rate is then determined by integrating the desorption rate per monolayer over the total number of monolayers on the grain. The probabilities can be directly employed in stochastic chemical models in which the discrete nature of chemical reactions are taken into account (see, e.g.Cuppen & Herbst 2007).
Appendix C: Photodesorption and fractionation
This section investigates whether photodesorption ultimately also leads to fractionation of HDO/H2O in the gas. We can es-timate the total photodesorption probability ratio between HDO and H2O by taking into account the direct and kicked out mech-anism in both cases. The probability of HDO photodesorption through the direct mechanism is given by
PdirdesHDO =rHDOPdirect(HDO∗). (C.1) In Eq. (C.1),Pdirect( HDO∗) is the probability that upon photo-excitation of HDO (the generic case) the HDO recombines and desorbs directly. It can be approximately calculated using
Pdirect(HDO∗)= 2
3Pdirect(HOD
∗)+1
3Pdirect(DOH
∗) (C.2)
andrHDOis the original HDO/H2O ratio in the ice (of the order of 0.01 or less as indicated by observations). In Eq. (C.2), the prob-abilities on the right hand side are the probprob-abilities for the direct mechanism for photodesorbing HDO averaged over the top four monolayers and presented in Tables5andA.3.
The probability of H2O photodesorption through the direct mechanism is given by
PdirdesH2O =(1−rHDO)Pdirect(H2O∗). (C.3) In Eq. (C.3), Pdirect(H2O∗) is the probability that upon photo-excitation H2O recombines and desorbs directly. It can be ob-tained directly from Tables5andA.3.
As can be seen from Table 2 and after using Eq. (C.2),
Pdirect(HDO∗) andPdirect(H2O∗) are roughly the same. As a result
PdirdesHDO/PdirdesH2O =rHDO/(1−rHDO)=rHDO/rH2O (C.4)
meaning that there is no isotope fractionation due to the direct mechanism.
Now consider the kick-out mechanism. The indirect proba-bilities can be written as follows:
PKOdesHDO =rHDO×rHDO×PKO(HDO; HDO∗)
Table A.1.X atom photodesorption probabilities atTice =20 K, 30 K, and 60 K resulting from photoexcitation of a X2O (X=H, D) or XOY (HOD or DOH) molecule present in a specific monolayer of H2O ice.
ML Hdes/H2O∗ Ddes/D2O∗ Hdes/HOD∗ Ddes/DOH∗
Tice=20 K
1 0.865±4.0×10⁻³ 0.898±3.9×10⁻³ 0.913±3.6×10⁻³ 0.907±3.7×10⁻³ 2 0.741±5.9×10⁻³ 0.665±6.1×10⁻³ 0.661±6.0×10⁻³ 0.626±6.0×10⁻³ 3 0.422±6.1×10⁻³ 0.401±6.3×10⁻³ 0.472±6.3×10⁻³ 0.419±6.0×10⁻³ 4 0.261±4.9×10⁻³ 0.190±5.1×10⁻³ 0.194±5.0×10⁻³ 0.137±4.2×10⁻³
MLs 0.572±3.2×10⁻³ 0.538±3.2×10⁻³ 0.559±5.3×10⁻³ 0.527±5.0×10⁻³ Tice=30 K
1 0.878±4.3×10⁻³ 0.871±4.3×10⁻³ 0.863±4.3×10⁻³ 0.864±4.3×10⁻³ 2 0.740±5.9×10⁻³ 0.670±6.1×10⁻³ 0.711±5.7×10⁻³ 0.655±5.8×10⁻³ 3 0.435±6.3×10⁻³ 0.452±6.4×10⁻³ 0.507±6.3×10⁻³ 0.453±6.0×10⁻³ 4 0.319±5.2×10⁻³ 0.240±5.6×10⁻³ 0.310±5.8×10⁻³ 0.236±5.1×10⁻³
MLs 0.593±3.2×10⁻³ 0.558±3.2×10⁻³ 0.598±5.6×10⁻³ 0.552±5.0×10⁻³ Tice=60 K
1 0.872±4.3×10⁻³ 0.872±4.3×10⁻³ 0.904±3.7×10⁻³ 0.883±4.0×10⁻³ 2 0.711±6.0×10⁻³ 0.706±5.9×10⁻³ 0.696±5.8×10⁻³ 0.667±5.8×10⁻³ 3 0.404±6.3×10⁻³ 0.350±6.2×10⁻³ 0.376±6.1×10⁻³ 0.298±5.6×10⁻³ 4 0.302±5.9×10⁻³ 0.230±5.4×10⁻³ 0.306±5.7×10⁻³ 0.204±4.8×10⁻³
MLs 0.572±3.2×10⁻³ 0.539±3.2×10⁻³ 0.570±5.4×10⁻³ 0.513±5.0×10⁻³
Notes.ML1 is the top monolayer andMLsdenotes the average over the top four monolayers.
Table A.2.OX radical photodesorption probabilities atTice=20 K, 30 K, and 60 K resulting from photoexcitation of a X2O (X=H, D) or XOY (HOD or DOH) molecule present in a specific monolayer of H2O ice.
ML OHdes/H2O∗ ODdes/D2O∗ ODdes/HOD∗ OHdes/DOH∗ Tice=20 K
1 0.026±2.7×10⁻³ 0.043±2.6×10⁻³ 0.028±2.1×10⁻³ 0.055±2.9×10⁻³ 2 0.021±2.7×10⁻³ 0.038±2.5×10⁻³ 0.022±1.8×10⁻³ 0.049±2.7×10⁻³ 3 (1.0±0.3)×10−3 (1.7±0.5)×10−3 (4.7±2.7)×10−4 (1.7±0.5)×10−3
4 0.00 0.00 0.00 0.00
MLs 0.012±7.0×10⁻⁴ 0.021±9.1×10⁻⁴ 0.012±1.4×10⁻³ 0.026±2.0×10⁻³ Tice=30 K
1 0.047±2.9×10⁻³ 0.069±3.3×10⁻³ 0.029±2.1×10⁻³ 0.054±2.8×10⁻³ 2 0.011±1.8×10⁻³ 0.019±1.8×10⁻³ (5.5±0.9)×10−3 0.015±1.5×10⁻³ 3 (1.7±0.5)×10−4 0.012±1.4×10⁻³ (3.8±0.8)×10−3 (6.8±0.9)×10−3 4 0.00 (1.7±1.7)×10−4 (2.0±2.0)×10−4 0.00
MLs 0.014±7.5×10⁻⁴ 0.025±1.0×10⁻³ (9.5±1.2)×10−3 0.019±2.0×10⁻³ Tice=60 K
1 0.029±2.2×10⁻³ 0.053±2.9×10⁻³ 0.013±1.4×10⁻³ 0.050±2.7×10⁻³ 2 0.012±1.4×10⁻³ 0.026±2.0×10⁻³ (7.0±1.0)×10−3 0.020±1.7×10⁻³ 3 (2.3±0.6)×10−3 (6.0±0.1)×10−3 (3.5±0.8)×10−3 0.012±1.3×10⁻³
4 0.00 0.00 0.00 0.00
MLs 0.011±6.7×10⁻⁴ 0.021±9.3×10⁻⁴ (5.9±1.0)×10−3 0.020±2.0×10⁻³
Notes.ML1 is the top monolayer andMLsdenotes the average over the top four monolayers.
and
PKOdesH2O =(1−rHDO)×(1−rHDO)×PKO(H2O; H2O∗)
+rHDO×(1−rHDO)×PKO(H2O; HDO∗). (C.6)
In Eqs. (C.5) and (C.6), PKOdes
HXO is the probability of desorp-tion of HXO through the kick-out mechanism, where X is ei-ther H or D. Furei-thermore,PKO(HX1O; HX2O∗) is the proba-bility that HX1O is kicked out after photo-excitation of HX2O, where X1 can either be H or D, and X2 can also be H or D.
As for the direct mechanism, we can approximately calculate
PKO(HX1O;HX2O∗) from
PKO(HX1O; HDO∗)= 2
3PKO(HX
1O; HOD∗)
+1
3PKO(HX
1O; DOH∗). (C.7)
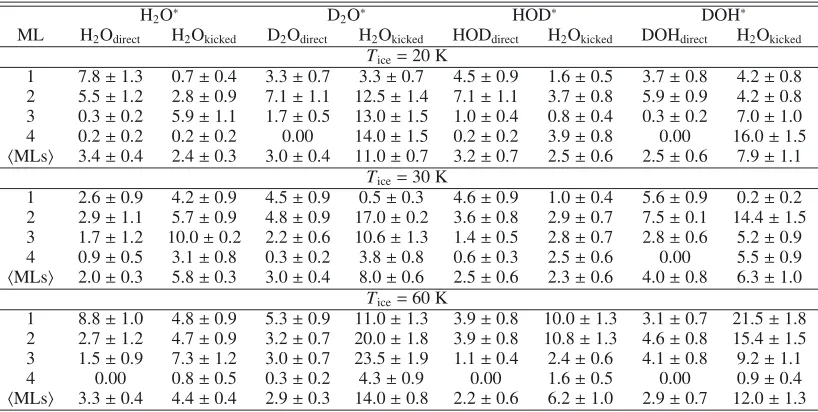
[image:10.595.119.478.399.616.2]Table A.3.Total X2O (X=H, D) or XOY (HOD or DOH) photodesorption probabilities atTice=20 K, 30 K, and 60 K per monolayer due to the direct and the kick-out mechanism for X2O and XOY photodissociation in H2O ice.
H2O∗ D2O∗ HOD∗ DOH∗
ML H2Odirect H2Okicked D2Odirect H2Okicked HODdirect H2Okicked DOHdirect H2Okicked Tice=20 K
1 7.8±1.3 0.7±0.4 3.3±0.7 3.3±0.7 4.5±0.9 1.6±0.5 3.7±0.8 4.2±0.8 2 5.5±1.2 2.8±0.9 7.1±1.1 12.5±1.4 7.1±1.1 3.7±0.8 5.9±0.9 4.2±0.8 3 0.3±0.2 5.9±1.1 1.7±0.5 13.0±1.5 1.0±0.4 0.8±0.4 0.3±0.2 7.0±1.0 4 0.2±0.2 0.2±0.2 0.00 14.0±1.5 0.2±0.2 3.9±0.8 0.00 16.0±1.5
MLs 3.4±0.4 2.4±0.3 3.0±0.4 11.0±0.7 3.2±0.7 2.5±0.6 2.5±0.6 7.9±1.1 Tice=30 K
1 2.6±0.9 4.2±0.9 4.5±0.9 0.5±0.3 4.6±0.9 1.0±0.4 5.6±0.9 0.2±0.2 2 2.9±1.1 5.7±0.9 4.8±0.9 17.0±0.2 3.6±0.8 2.9±0.7 7.5±0.1 14.4±1.5 3 1.7±1.2 10.0±0.2 2.2±0.6 10.6±1.3 1.4±0.5 2.8±0.7 2.8±0.6 5.2±0.9 4 0.9±0.5 3.1±0.8 0.3±0.2 3.8±0.8 0.6±0.3 2.5±0.6 0.00 5.5±0.9
MLs 2.0±0.3 5.8±0.3 3.0±0.4 8.0±0.6 2.5±0.6 2.3±0.6 4.0±0.8 6.3±1.0 Tice=60 K
1 8.8±1.0 4.8±0.9 5.3±0.9 11.0±1.3 3.9±0.8 10.0±1.3 3.1±0.7 21.5±1.8 2 2.7±1.2 4.7±0.9 3.2±0.7 20.0±1.8 3.9±0.8 10.8±1.3 4.6±0.8 15.4±1.5 3 1.5±0.9 7.3±1.2 3.0±0.7 23.5±1.9 1.1±0.4 2.4±0.6 4.1±0.8 9.2±1.1 4 0.00 0.8±0.5 0.3±0.2 4.3±0.9 0.00 1.6±0.5 0.00 0.9±0.4
MLs 3.3±0.4 4.4±0.4 2.9±0.3 14.0±0.8 2.2±0.6 6.2±1.0 2.9±0.7 12.0±1.3
Notes.All values should be multiplied by 10−3. The notation H2O∗and HOD∗denote photoexcitation of H2O and HDO in H2O ice in which the
H atom resulting from photodissociation kicks out a neigbouring H2O molecule. The notation D2O∗and DOH∗indicate the analogous process in which the resulting D atom kicks out a neighbouring H2O molecule.
Because we have only calculated probabilities that H2O is kicked out, we make the following approximations,
PKO(HDO; HOD∗)=PKO(H2O; HOD∗) (C.8)
PKO(HDO; DOH∗)=PKO(H2O; DOH∗) (C.9)
PKO(HDO; HDO∗)=PKO(H2O; HDO∗). (C.10) The right hand values of Eqs. (C.8) and (C.9) can be directly ob-tained from Tables5andA.3.PKO( HDO; HDO∗) can be com-puted using the approximation in Eq. (C.10) and using Eq. (C.7) and Tables5andA.3.
Using Eqs. (C.8)–(C.10), Eq. (C.5) can be rewritten as
PKOdesHDO ≈rHDO×rHDO×PKO(H2O; HDO∗)
+(1−rHDO)×rHDO×PKO(H2O; H2O∗). (C.11) Most importantly, for 10 and 20 K we have approximately that (see Tables5andA.3)
PKO(H2O; HDO∗)≈PKO(H2O; H2O∗). (C.12)
Inserting Eq. (C.12) in Eq. (C.11) yields
PKOdesHDO ≈rHDO×PKO(H2O; H2O∗) (C.13) and inserting Eq. (C.12) in Eq. (C.6) yields
PKOdesH2O =(1−rHDO)×PKO(H2O; H2O∗). (C.14) From Eqs. (C.13) and (C.14), we can derive that
PKOdesHDO /PKOdesH
2O =rHDO/rH2O (C.15)
meaning that there should be no isotope fractionation due to the indirect kick-out mechanism. Taken together, Eqs. (C.4) and (C.15) ensure that the ratio of desorbed HDO over desorbed H2O in the ice is given by
PdesHDO/PdesH2O=rHDO/rH2O (C.16)
0 0.1 0.2 0.3 0.4 0.5 0.6 0.7 0.8 0.9 1
0 1 2 3 4 5 6 7 8 9 10
P
robability (per absorbed photon)
Monolayer Ddes + OHtrapped
10 K 20 K 30 K 60 K 90 K
P(ML) = (a ML) exp[-b ML]
a = 2.17 b = 0.942
Average Fit
10-5 10-4 10-3 10-2 10-1
0 1 2 3 4 5 6 7 8 9 10
P
robability (per absorbed photon)
Monolayer Dtrapped + OHdes
10 K 20 K 30 K 60 K 90 K
P(ML) = (a ML) exp[-b (ML-c)2]
a = 0.0114 b = 0.450 c = 0.751
Average Fit
10-5 10-4 10-3 10-2 10-1
0 1 2 3 4 5 6 7 8 9 10
P
robability (per absorbed photon)
Monolayer Ddes + OHdes
10 K 20 K 30 K 60 K 90 K
P(ML) = (a ML) exp[-b (ML-c)2
] a = 0.0659
b = 0.484 c = 0.0538
Average Fit
0 0.1 0.2 0.3 0.4 0.5 0.6 0.7
0 1 2 3 4 5 6 7 8 9 10
P
robability (per absorbed photon)
Monolayer Dtrapped + OHtrapped
10 K 20 K 30 K 60 K 90 K
P(ML) = a(1 - exp[-b MLc]) a = 0.574
b = 0.111 c = 1.89
Average Fit
10-5 10-4 10-3 10-2 10-1
0 1 2 3 4 5 6 7 8 9 10
P
robability (per absorbed photon)
Monolayer HDOdirect
10 K 20 K 30 K 60 K 90 K
P(ML) = (a ML) exp[-b (ML-c)2]
a = 0.00494 b = 0.570 c = 1.11
Average Fit
10-5 10-4 10-3 10-2 10-1
0 1 2 3 4 5 6 7 8 9 10
P
robability (per absorbed photon)
Monolayer H2Okicked
10 K 20 K 30 K 60 K 90 K
P(ML) = (a ML) exp[-b (ML-c)2]
a = 0.00949 b = 0.180 c = 0.519
[image:12.595.67.535.75.576.2]Average Fit