COMMISSION OF THE EUROPEAN COMMUNITIES
COM(84) 95 final
COM(84) 95 final
Brussels, 26th April 1984
COMMISSION COMMUNICATION TO THE COUNCIL
TABLE OP CONTENTS
Introduction and aenera1 note
I. Production trend•
(a) Macro-economic analx•i•
1. Final aaricultura1 production - Volume of final production
Value of final aaricultural production
2. Intermediate con•umption
Volume of intermediate con•umptlon
Chana•• in intermediate con•umption by value
3. Gro•• value added at market price• Volume of aro•• value added Chana•• in aro•• value added
(b) Analxai• by product
1. Crop products
2. Live•tock product•
II. Trade
(a) Trade in crop product•
(b) Trade in 11ve•tock product•
bu.
1
"
"
55
6
7
8 8 8
10
10
11
18
18
- 1
-INTRODUCTION AND GSNSRAL NOTS
On 10 February 1978. the Commission sent to the Council a document entitled ••Economic effects of the agri-monetary system" (1). The document comprised an analytical part. a background section on the development of the agri-monetary system. a statistical part and case studies. On 14 Karch 1979. the Commission sent to the Council a Communication (2) which was only an updating of the statistical part of ita earlier document. for. aa the Commission noted in ita introduction to the second document. the general assessments and comments in the earlier Communication not included in the later one remained entirely valid.
The purpose of this report ia to update the various statistical aeries since the 1978 and 1979 reports and to assess the changes that have occurred. To facilitate use of the statistics and to maintain continuity between the
various reports on the effects of the agri-monetary system. the same numbering of the tables ia used throughout the three reports.
The Commission takes the view that the final conclusions reached in the 1978 (3) and 1979 reports are still fully valid. although the present report gives a wider range of statistical aeries than the first two: the 1978
communication covered generally the period "1968/69 - 1977/78''• that for 1979 added 1978/79 to these aeries. This new report is an opportunity to give statistics for a period up to 1981/82. or for the calendar years up to 1982.
As already stressed in the 1978 document. this exercise has definite
limitations and a warning must be given against any hasty conclusions drawn from the analysis of the statistical aeries. with brief comments. which follow: i t is extremely difficult to isolate the influence of the
agri-monetary system from that of other factors. Price is only one of the factors governing changes in trade and agricultural production. Consequently. it ia impossible to draw conclusions as to the effects of price differences. due to the agri-monetary system. on production and trade by a mere analysis of changes in these aggregates: factors other than prices may tend to push
production in one direction while prices. higher to varying degrees than the normal price. should push the price in the opposite direction. The fact that the statistics do not show a trend in the direction corresponding to that
(1) Doc. COK(78)20 final (2) Doc. COK(79)11 final
- 2
-which price changes would suggest does not necessarily mean that price
variations have had no effect. What would be needed, if it were feasible, is a comparison of actual changes with those which would have taken place if the prices in the various Kamber States had been, in the absence of KCAs, at the level of the common prices. Moreover, international comparisons of sectoral economic data are severely hampered by the influence of differing inflation rates from country to country and that of exchange rate changes.
Consequently, the only comparisons between Member States which are reasonably reliable are those concerning changes in volume. For this reason, at
macroeconomic level, changes have bean shown in volume aa wall, and the
analyses by product have bean made only in tonnaa, both for production and for trade.
During the observation period, Greece had not yet joined. However, to bring out the impact of this country, especially in the output of each product, statistical aeries concerning Greece have been added; to avoid any confusion, wherever Greek statistics were included two separate totals have been worked out, one as "EUR 9" and one aa "EUR 10".
To facilitate use of this report, the development of the agri-monetary situation in each Member State is outlined briefly aa follows:
Positive KCA Kember States:
(a) Germany baa always had positive KCAa since 1971; they have generally been somewhere between 5 and 10~.
(b) The Benelux has also almost always had positive MCAa; they have generally tended to lie on average between 1 and 5~. The BLEU had
negative MCAa for a abort period in 1982, but the period was in fact too short to influence trade movements in 1982.
Negative KCA Member States:
(a) Ireland had large negative KCAa from the time it joined the Community until 9 April 1979; during this period, the KCAa ranged up to 30~
(1976). Since 1979, Ireland baa had smaller KCAa, which from time to time have been discounted altogether.
(b) France was the first Community Member State to introduce MCAs. These negative MCAs were gradually worked down; but they were particularly high (more than 20~ in 1977 and 1978).
- 3
-Denmark 1• the only Member State to have eliminated ita HCAa almoat immediately,
whenever they were applied. At the preaent time, Denmark doea have a poaitlve HCA of 1~.
The United Kinsdom had very 1arse nesative HCAa from the time it joined until March 1980. Durins thi• period, HCAa ransed aa hish aa 45~. Since March 1980, the "monetary sap" ha• become poaitive and ha• even aometime• exceeded 15~.
Al•o, after declinins aubatantially between 1979 and 1981, the HCA• asain srew larser after the currency adjuatmenta of October 1981, June 1982 and March 1983. The
atatiatical •eriea endins in 1982 are inaufficlent to ahow the conaequence• of their lncreaae alnce the end of 1981.
Chansea in the HCAa percentase polnta
PRO N BLBU : DK : IRL p IT UK OK
:---:---:---:---:---:---:---:---:---:---:
:March 1979 : + 10,8 : + 3,3 : + 3,3 : 0 0 : - 10,6 : - 17,7 : - 28,2 :
:---:---:---:---:---:---:---:---:---:---:
:April 1981, :after currency: :adjuatment of
:13 March 1981 + 3,2 :and price
:declalon :1981/82
0 0 0 0 0 1 - 12,9
---:---:---:---:---:---:---:---:---:---:
:November 1981 : :after accounta:
:adjuatment of : + 8,3 :october 1981
+ 4,3 0 0 0 0 3,3 + 8,1 0
---:---:---:---:---:---:---:---:---:---:
:2 January 1984: + 9,8 + 5,8 0 + 1 0 4,4 0 + 7,6 - 3
- 4
-I. Production trends
(a) Macro-economic analxaia
1. Final asricultural production:
It is true that for lon~-term macro-economic analyses, the severe
drou~ht of 1976 must always be borne in mind. However, it would seem that 1976 marked, in more than one respect, a turnln~-point in the development of the respective shares of each Kember State in the volume of final a~ricultural production in the Community. The analysis of 1982 must also be carried out with care, as this was a year in which those Kember States with heavy crop production increased their shares.
Volume of final production (Table 92a)
Durin~ the reference years (1973-1982), only one Kember State increased ita share in a~ricultural production on a laatin~ basis, the Netherlands. Over the same period, the share of one Kember State - BelKium - declined. LuxembourK, Ireland, Denmark and Greece kept their shares, as did Italy, with differentials wideninK from year to year. With reKard to Geraany, France and the United
Kin~dom, the trend chan~ed course in 1977. From 1973 to 1977, the share enjoyed by Germany increased aliKhtly, while those for France and the United Kin~dom were declinlns alishtly. Prom 1977 onwards, Germany's share contracted, with a recovery ln 1982, while those of France and the United Kinsdom tended, broadly, to mark time.
Analysis of the production volume srowth rates for each Kember State (Table 93b) shows that the volume of a~ricultural production
increased in all the Kember States. Thus, the fact that a Kember State's ahara ln the Community total declines must mean that ita rate of production srowth has, over a lons period, lassed behind that of the other Kember States, or that there baa been no ~rowth at all.
- 5
-•sri-monetary system has mainly contributed, at macro-economic
level, to "freezins" positions already reached, rather than chansins them in any fundamental way. Xt may have spurred on the expansion of Dutch production, but it cannot by itself account for the
increase in Dutch output since this increase besan before
the-currency realisnments and since Belsium, which, for many years, had the same HCAs as the Netherlands, suffered a decline in its share in Community asricultural production. As for Prance, Germany and the United ~insdom, the rate of srowth in the volume of their final asricultural production was much the aame from 1975 to 1982 (Table
93b).
Value of final asricultural production (Table 92)
Application of current prices and exchanse rate entails some
attenuation of the above findin&•· Luxembours, Xreland, Denmark and Italy, with fluctuation•, retain their shares in final Community production. The same cannot be aaid for Prance from 1976/77
onwards, or, which 1• more surprlsins, for the Netherlands. Converaely, from 1976 or 1977 onwarda, Germany's share steadily decline•, except in 1982, while the contraction ln Belsium'• share
in ahown to be sreater. On the other hand, from 1979 or 1980
onwards, the share of Greece and especially of the United ~lnsdom
has been risins.
2. Interm.diate eonwumption:
Chane•• in this assresate are important since lt has been arsued that the asri-monetary aystem save poaitive KCA Kember States a privllesed position over nesative KCA Kember States, particularly with resard to the purchase of input• on world market•. The reaaonins is flawleas, but ls lt borne out by facts? It is true, with resard to intermediate con1umption, seen macro-economically, that there is a problem of
- 6
-Volume of intermediate con•umption (Table 93b)
It i• noteworthy that the arowth in the volume of aaricultural
production in the variou• Kember State• wa• achieved on the ba•i• of arowth rat•• in the volume of intermediate con•umption varyina very widely from Kember State to Kember State. A• the rea•onina here i•
in term• of volume, that i• in quantitie•, the notion of price chana•• doe• not enter the rea•onina, and, with thi• criterion, there i• an approach to the concept of efficiency. Here, lt l• found, for example, that with rouahly the •am• rate of arowth of input• (26~), Denmark achieved a rate of srowth of production
(27.7~) nearly three time• a• hiah a• that of Italy (9.8~). For 1975 to 1982, France and Germany achieved much the •ame production arowth rate (20~). But France u•ed half a• much more in
intermediate con•umption than Germany (3~ a• compared with 2~).
Similarly, a• compared with another po•itive KCA Kember state, the Netherland•, we find that France had a volume srowth rate of
intermediate con•wmption which wa• much the •am• from 1975 onward•
(30.1~ compared with 31.~), but with thi• •am• srowth rate of intermediate con•umption, the Netherland• srowth rate of production
(35.6~) wa• 80~ hi&her than the rate of arowth of production of France in 1982 (2~) and wa• nearly three tim•• a• hish in 1981.
If production volume chansea, chana•• in the volume of intermediate con•umption and the exchanse rate aituation• of the Kember Statea are conaidered tosether, it i• found that the Kember Stat•• which had neaative KCA• durin& the 1975-1982 period (France, 1taly and Ireland) had a hi&h rate of srowth of intermediate con•umption aa compared with Germany. Conver•ely, thi• hi&h srowth rate in the volume of intermediate con•umption yielded a srowth rate for France
(20.1~) equal to the rate of srowth in the volume of production of Germany (2~) and much lower for Italy (9.8~) and Ireland (10.8~).
- 7
-As for Belsium, a country with positive MC-As from 1975 to 1982, the volume of intermediate consumption tended to decline, which did not prevent it from achieving a rate of growth in the volume of final production (13.1~) exceedins that for Italy (9.8~) and Ireland
(10.8~).
Changes in intermediate consumption by value
Chanse• in the "implicit prices" of intermediate consumption can be worked out either by dividing the value of intermediate consumption
by the volume of intermediate consumption, or by deflatins the agsregate thus obtained by the index of the "implicit price" of the sross domestic product (Table 9la- lower table). The second method gives a better picture of changes in the prices of goods and
services used as intermediate consumption. It is in fact found that from 1975 to 1982 these real implicit prices declined in all the Member States except two positive MCA countries: Germany and Ballium. On the other hand, the relative decline in the real implicit prices of intermediate consumption was sharpest in Italy and Ireland. Re-inserting inflation must, of course, modify this finding (Table 9la- upper table).
If the "quantity" effect of intermediate consumption, the "price" effect of intermediate consumption and inflation are taken together and the Member States• shares in the value of Community intermediate consumption are analysed (Table 92b), a change in the Member States' shares in intermediate consumption at constant prices and exchange rates is observed (Table 92c). Taking into account the special situation in 1982, it can be said that the positive MCA countries (Germany, Netherlands and Belgium) have tended since 1977 to lose ground in their shares in the Community's intermediate consumption. The nesative MCA countries (France, Italy and Ireland) tended to
increase their shares, the increase in the United Kinsdom•s share from 1978 to 1982 being largely due to the high rate of inflation in the United Kingdom in that period. In fact, with.a share of 15.7~
- 8
-3. Gro•• yalue added at market prieta:
Thie assresate is important since it allow• an approach to the concept of income, which is an eaeential one for the farmer. It is clear that the result• obtained in reepect of sroas value added are only the
consequences of the results obtained in respect of final production and in reepect of intermediate consumption, since the &rosa value added
lL
final production minus intermediate consumption.Volume of sroas value added (Table 93a)
Leavins aside very short-term variations, the Kember States which had positive KCAa throushout the 1973-1982 period on averase, either maintained their ehares in the volume of sross value added (Germany
and Belsium), or steadily increased it (Netherlands). With resard to the nesative KCA countries, a number of trends are observable. In 1973 and 1974 France's share declined and varied widely from 1975 to 1982, the eztremea beins 26.2~ in 1981 and 28.4~ in 1979. Thus, what on the face of it looks like a eteady fall from 1973 to 1977 is
found, on the basi• of a lons aeries ezcludin& 1973 and 1974 to be, in fact, variations of wide amplitude. The same observation is pertinent for Italy. On the other hand, there are two clear
tendencies for Ireland: an incrtaee from 1973 to 1977 and a decline from 1977 to 1982.
Chansea in sroaa value added at market prieta, at current prices and ezchanse rates (Table 93)
The lons statistical series now available yield a number of observation• which must be weishted by three consideration&:
(a) the 1976 drousht, the effects of which were alao felt in 1977; (b) the bumper harveet in 1982;
- 9
-rn the poaitive KCA countriea, trend• differed fairly widely. Germany and the Netherland atepped up aharply their aharea in srosa value added from 1973 to 1977; Germany•• ahara then dropped steeply, to recover in 1982. The Netherlands followed the aame curve in 1978, 1979 and 1980, but recovered in 1981 and 1982. The underlyins trend in Belgium's ahare in added value declined slowly but ateadily throushout the . ten-year period.
rncluaion of the "price" effecta and "exchange rate" effect• for the nesative KCA countriea modifiea the findins• of the analyaia concernins volume: except for 1979 and 1982, France's share ia found to be
definitely contractins. rtaly's share waa stable, with, if anything, a alight upward movement. On the other hand, rreland's ahara, apart from 1977 and 1978, ahows little chanse. Denmark, thoush havins no KCAs, alao on average maintained its ahara, apart from a few fluctuations.
The influence of the United Kinsdom on the pattern of relative ahares of Kember Statea became substantial from 1979 onwards: from 1978 to 1982 the United Kinsdom increaaed ita ahara in value added by 3 percentage pointe. rt is true that from 1979 onwards the United Kinsdom's KCA• contracted to become poaitive in mid-1980; however, thia growth in value added was achieved because production atructurea in the United Kingdom were flexible enough to adapt to changes in its production patterns (the United Kingdom has become the aecond largest common wheat producer and the fourth largeat butter producer in the community) and efficient enough to do this without increasing the volume of intermediate conaumption and with an "implicit" price of
intermediate conaumption declining aharply in real terma, although problema connected with the price• of input• are much less important for cereals than for liveatock products.
The concluaion ia that it ia not eaay, at macro-economic level, to claaaify chans•• in sroaa value added trend• in the Kember State• in term• of the agri-monetary aituation of each Kember state.
- 10
-Por a refinement of these findinss, they •hould be •upplemantad by an analy•i• by product, which would of cour•• siva a mora varied pattern.
(b) Analy•i• bx product
It i• clear that each market •hould be analy•ed in depth to ••certain all the reasons determinin& the re•pectiva •hare• in production. The mo•t one can do here is attempt to determine the markets for which the production •hares underwent •ub•tantial and la•tin& chanses.
1. Crop product•:
In senaral there i• sreater •tability of the •hare• of each Member State in the output of each product, althoush, for certain products, wide variations occurred beyond the very •hort-term variation•
peculiar to crop products.
The relatively •table product• include maize, •usar and fresh fruit. Maize (Table 3) i• relatively •table because of •oil
condition•; it i• •till mainly concentrated in Prance and in Italy, two nesative MCA countrie•· There are, however, two new
developments: an improvement of Italy's •hare, due mainly to the expansion in the production of hybrid varieties, and a •harp
- 11
-For other crop products, there are major changes in the relative production shares of the Kember States. The United Kingdom made appreciable gains in the production of common wheat (Table 1) at the expense of Italy. Germany's share in barley production (Table 2), like those of Italy and Ireland, increased at the expense of those of France and Greece. But this is not significant from the
agri-monetary angle.
An interesting case is that of fresh vegetables (Table 5), products not subject to KCAs. Apart from seasonal variations, there was a slight downward trend in certain positive KCA countries (Germany, Belgium and the United Kingdom from 1978-79 onwards) and a slight upward trend in Italy. However, there was also a slight upward trend in the Netherlands (hothouse) and a slight downward tendency in France.
A conclusion is that on the face of it the agri-monetary system does not seem to have influenced to any substantial extent the crop
production shares of the various Kember States.
2. Live1tock products:
A distinction here must be made between production connected with cattle (milk/meat) and production connected with cereals and grain substitutes (pigmeat, eggs and poultry). The common organization of the market in sheepmeat is too recent to be significant.
With regard to cattle farming, i t must not be forgotten that more than two-thirds of beef/veal come frum cull cows, the veal market being a special market.
as the guiding market.
The milk market must therefore be regarded With regard to milk production (Table 15)
among the positive KCA countries, there was a steady increase in the Netherlands, and a very slight increase in the share of Germany; after a slight decline until 1975, the share enjoyed by Belgium showed no further change. With regard to the negative KCA
- 12
-The United Kingdom's share contracted, that of Denmark declined from 1979 onwards and that of Ireland increased from 1976 onwards.
However, except for the Netherlands, the shifts are very small.
The growth of milk production in the Netherlands suggests that the strength of the guilder has enabled the Netherlands to purchase feed on world markets relatively more cheaply than Kember States with weaker currencies. The arithmetic, of course, tallies, but could not suffice alone to account for the increase in milk production in the Netherlands, since Germany, which has always had much higher positive KCAs than the Netherlands, failed to match the Dutch growth rate. Production structures, livestock farming methods and
livestock breeds are all pertinent factors. In this connection, it would seem that the Netherlands was better placed to make the most of the benefits accruing from a strong currency when it comes to buying feed on world markets. A relevant point is that the increase
in milk production in the Netherlands is more a matter of larger herds than of better yields. Of course, it could be argued that the milk yields in the Netherlands being the highest, increasing them would be no easy matter. This argument is only partly correct: the United Kingdom, with a milk yield of 5 057 kg in 1982, is quite close to yields in the Netherlands (5 278 kg); but the United Kingdom cut back ita milk herds by 0.4~ per year from 1974 to 1982, although during the same period the Netherlands increased theirs by
- 13
-With resard to beef/veal (Table 7), the situation is broadly in balance, with, apart from cyclical movements and the drousht in
1976, a alight improvement for the Netherlands and a slisht decline
for the United Kinsdom, without any really firm trend. This situation could be the net result of variations in dairy herds.
As for the more "indu1trial" products, such as pigmeat, ess• and poultry, the pattern is more varied: the statistical aeries from
1973 to 1982 provide a refinement of the Commission's earlier
findinsa for 1978 and 1979, since in more than one respect, 1976 and
1977 seem to have been years of "kinks" in certain trends.
There is a visorous and uninterrupted increase in the Netherlands and Italian shares in the production of pismeat (Table 10).
Belsium's share contracted steadily while those of Germany and France besan to decline from 1977 onwards. The United Kingdom and Irish share show little chanse, but Denmark's share declined from
1973 to 1976/77 to recover and stabilize at the 1973 level. The
increase in pismeat production was the same (61~) from 1973 to 1982
in the Netherlands and in Italy. In the Netherlands, the growth started well before the inception of the agri-monetary system: from
1965 to 1971 the Netherlands enjoyed the highest growth of pismeat
production in the Community (six countries) after the BLKU, ahead of Italy, Germany and France. In Italy, pismeat production sot under way, on the basis of modern techniques, more recently, but is
important since Italy, the sixth producer of the Community in 1973,
was the fourth by 1982. There seems therefore no point in
attemptins to classify the performances of the various Kember States according to agri-monetary criteria.
With resard to poultrymeat (Table 13), France's share soared from
1978 onwards to force Italy out of first place, thoush this country
(2)
- 14
-The eKg market (Table 14) is that on which the greatest changes took place. The United Kingdom is no longer the main European producer; its place is taken by France. But since 1973 the main increases have been achieved by the Netherlands, which more than doubled its production in 8 years. The larger shares were therefore taken by the Netherlands and France. Germany, Belgium and the United Kingdom suffered share losses. The other Kember States broadly retained the shares they bad had in the past. Once again, the ranking of the Kember States from the angle of absolute or relative production growth does not match their agri-monetary ranking.
(c) KCA product! as part of total production
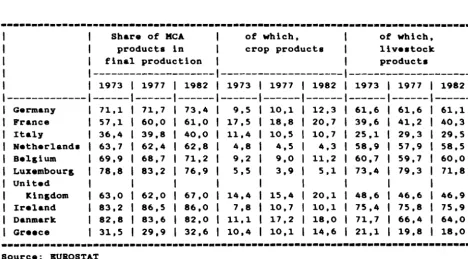
To obtain a combined picture of the findings for each product, changes in the shares enjoyed by KCA products within the total value of final agricultural production of each Kember State can be analysed. This can be done overall, but it is also interesting to break down this share in terms of livestock products and crop products. To beKin with, only the following KCA products are considered: wheat, barley, maize,
sugarbeet, milk, beef/veal and pigmeat (Table 90 a).
Table A Shares enioxed bx seven KCA product• (1) in the value of final aKricultural production (currtnt prices)
---
Share of KCA of which, of which,products in crop products livestock
final production product•
---
---
---1973 1977 1982 1973 1977 1982 1973 1977 1982
---
--- --- --- ---
--- ---
---Germany 71,1 71,7 73,4 9,5 10,1 12,3 61,6 61,6 61,1
France 57,1 60,0 61,0 17,5 18,8 20,7 39,6 41,2 40,3
:Italy 36,4 39,8 40,0 11,4 10,5 10,7 25,1 29,3 29,5
Netherlands 63,7 62,4 62,8 4,8 4,5 4,3 58,9 57,9 58,5
Belgium 69,9 68,7 71,2 9,2 9,0 11,2 60,7 59,7 60,0
Luxembourg 78,8 83,2 76,9 5,5 3,9 5,1 73,4 79,3 71,8
United
Kingdom 63,0 62,0 67,0 14,4 15,4 20,1 48,6 46,6 46,9
:Ireland 83,2 86,5 86,0 7,8 10,7 10,1 75,4 75,8 75,9
Danmark 82,8 83,6 82,0 11,1 17,2 18,0 71,7 66,4 64,0
Greece 31,5 29,9 32,6 10,4 10,1 14,6 21,1 19,8 18,0
---Source: BUROSTAT [image:16.592.72.541.494.753.2]- 15
-This table shows that from 1976-1982 the tot~l share of MCA products increased in all the Member States except the Netherlands, Luxembourg and Denmark. Analysis of changes in the shares of crop products and of livestock products from 1973 to 1982 shows that the share of the KCA crop products included here increased in all the Kember States, except in Italy, the Netherlands and Luxembourg. On the other hand, the shares of the livestock MCA products included here either increased less rapidly than the shares of the crop products or declined, as in 'the United ICingdom, Denmark and Greece. "Safe prices" due to the high
level of support for crop products and the relatively higher
profitability of crop products as compared with livestock products are factors stronger than agri-monetary influences.
If the reasoning is taken further by including among livestock
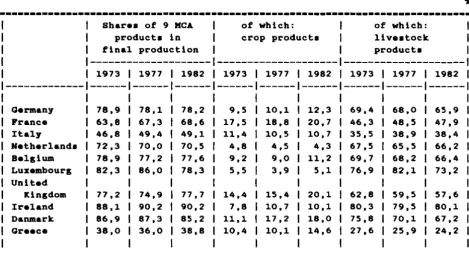
products, eggs and poultry, for which there is no intervention price but for which there are KCAs, the table is as follows:
Table B Chanses in the shares of nine MCA products (1) in the value of final asricultural production (current prices)
---Germany France Italy Netherlands Belgium Luxembourg United ICingdom Ireland Danmark GreeceShares of 9 KCA of which: of which:
products in crop products livestock
final production products
1973 78,9 63,8 46,8 72,3 78,9 82,3 77,2 88,1 86,9 38,0 1977 78,1 67,3 49,4 70,0 77,2 86,0 74,9 90,2 87,3 36,0 1982 78,2 68,6 49,1 70,5 77,6 78,3 77,7 90,2 85,2 38,8 1973 9,5 17,5 11,4 4,8 9,2 5,5 14,4 7,8 11,1 10,4 1977 10,1 18,8 10,5 4,5 9,0 3,9 15,4 10,7 17,2 10,1 1982 12,3 20,7 10,7 4,3 11,2 5,1 20,1 10,1 18,0 14,6 1973 69,4 46,3 35,5 67,5 69,7 76,9 62,8 80,3 75,8 27,6 1977 68,0 48,5 38,9 65,5 68,2 82,1 59,5 79,5 70,1 25,9 1982 65,9 47,9 38,4 66,2 66,4 73,2 57,6 80,1 67,2 24,2
---Source: BUROSTAT
[image:17.586.41.511.432.685.2]- 16
-The addition of •aa• and poultry production to the live•tock KCA product• tend• to modify •omewhat the above findina•. In all the Kember State• except France and Italy, the •hare• of live•tock KCA product• are •maller in 1982 than in 1973. It i• true that the aood 1982 harve•t• have •omethina to do with thi•, but the half-way percentaae for 1977 confi~• the previou• findina•·
A• noted above, it ha• been araued that the co•t of feed wa• relatively hiaher in weak-currency countri•• than in •trona-currency countri••· Table
c
below •how• chana•• in the •hare• of the co•t of feed in the total co•t of input•.
Table
c
~hADIII iD I hAUl 2' r.oimal fltd in iDtl~•dhtl !&2DIY1Dii!!ii2D S!&U[[IDt Ji!ti!&ll~
---
I
1973 1974 1975I
1976 1977I
1978I
1979 1980 1981 1982---1---
--- ---
---
---
---
---I
Ge~any
I
40,6 35,2 33,6 38,5 39,0 37,5 37,6 37,0 36,8 35,5 FranceI
39,5 35,8 35,7 38,1 38,1 36,0 34,5 33,4 34,2 33,9 ItalyI
65,3 63,0 62,5 64,7 65,5 63,8 61,4 59,4 59,6 61,1 Netherland•I
69,5 66,3 64,1 65,9 64,7 66,3 64,6 62,5 62,3 59,9 BelaiumI
63,1 62,8 59,4 61,7 60,0 57,6 57,4 56,7 55,5 55,0 LuxembouraI
49,2 50,4 49,2 51,8 47,7 42,2 42,1 42,3 41,5 42,5United
I
ICinadom
I
51,9 50,6 45,6 49,4 49,7 46,3 47,6 45,9 44,3 43,7 IrelandI
47,8 44,0 40,6 43,5 46,0 44,7 46,4 40,8 41,3 40,3 DanmarkI
56,7 50,2 48,5 54,8 56,0 54,1 55,3 56,3 57,1 55,0 GreeceI
32,2 29,3 28,8 28,5 28,5 25,6 26,4 24,9 27,2 29,6I
- 17
-It is a clear fact that feed, which is the main input in all the Kember States, is declinins as a proportion of all inputs in all Kember states except in Italy and Greece. There are three reasons for this: the relative decline in the share of livestock production in the production of the Kember States, except Italy and France, the relative decline in the cost of feed and the relative increase in the cost of enersy or enersy-based products.
It is true that in concludins these statistical comments on chanses in output of KCA products, it may seen surprisins to note that from 1973 to 1982 the three Kember States which increased their shares in the output of KCA products are three Kember States with nesative KCAs: France, Ireland and Italy. But it must also be noted that France and Italy are the two Kember States in which, in 1973, apart from Greece, the shares of KCA products in final production were the lowest, i.e. French and Italian farmers have mainly stepped up output of products protected by intervention prices; in other words, that has prevailed mainly has been the certainty of disposal at known prices. The
- 18
-II.~
Thi• •ection •••entially concerns intra-Community trade. However, for certain product•, in particular livestock product•, •ome reference will al•o be made to the Community's trade with the out•ide world. A number of the findinza re•ultinz from the analyai• of production are, of cour•e, reflected in trade. However, the •ymmetry i• not perfect, e•pecially as a relevant parameter here is chanze• in con•umption in each Member state. The relation•hip between production chanz•• and consumption chanze• can be conveniently mea•ured referrinz to chanze• in dezreea of ••lf-•ufficiency.
(a) Trade in crop product•
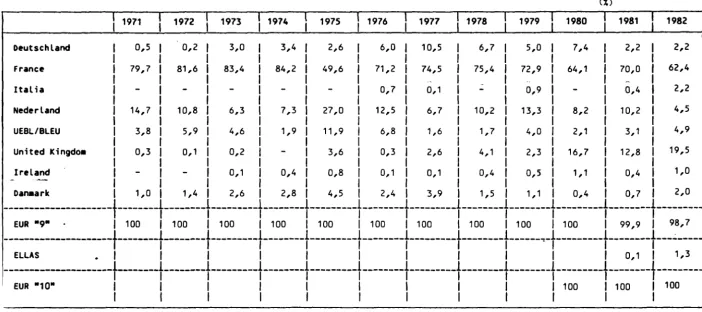
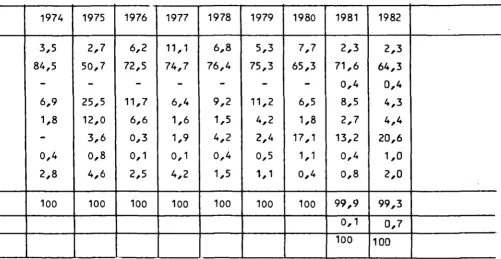
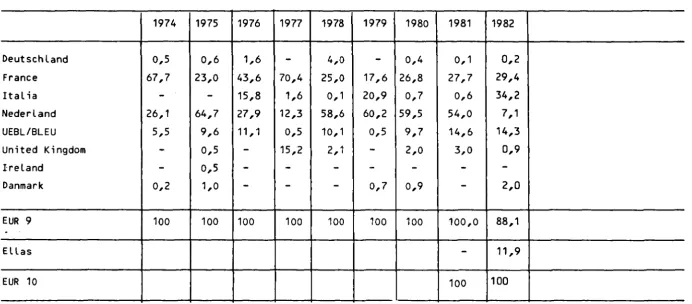
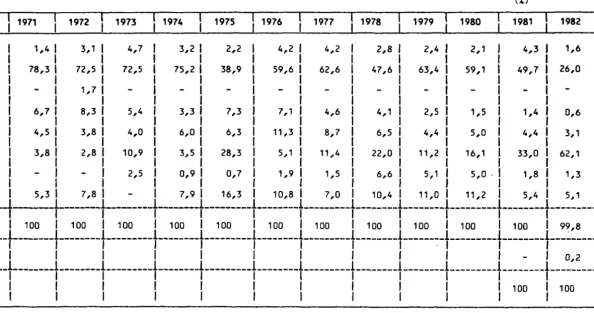
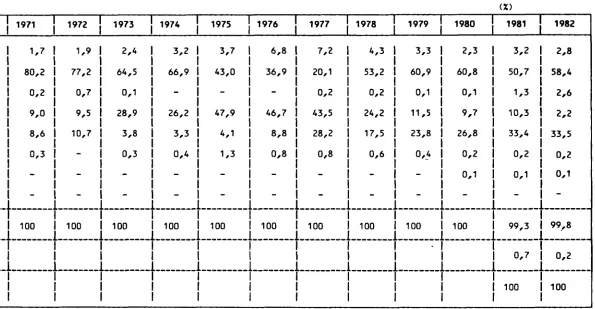
With rezard to cereals, a distinction mu•t be made between tho•• of which the Community has a surplus (wheat and barley) and tho•• of which the Community doe• not zrow enouzh (maize). With rezard to common wheat (Table 3la), France's share in intra-Community trade declined sharply when the United Kinzdom •tapped up vizorously its output of thi• crop. 1980, the year when the United Kinzdom entered the market a• a major contender in intra-BBC trade, wa• the year when the United Kinzdom'• MCA• became po•itive after havinz been
con•i•tently nezative. The United Kinzdom havinz made heavy inroad• on the Community'• internal market, French exporters concentrated more and more on the market• of non-member countries. On the other hand, the nearer the United Kinzdom zot to •elf-•ufficiency (Table 69), it ••emed to increase much more its •hare of the internal market than it did it• exports to member countries. The Netherlands, mainly a
- 19
-The same reaaonins, but a year later, applies for barley, of which the Community srowa more than it needs. It was mainly in 1981 and 1982, years in which the United ~insdom'a desree of self-sufficiency became very hish (Table 69) and at the same time the United ~insdom'a KCAa became almost always positive, that this country stepped up by a definite marsin ita share in the internal market for barley at the expense of France and Denmark. However, Denmark's internal market share loss is much more a matter of a decline in ita self-sufficiency rate (Table 69) due to an increase in internal consumption than of difficulties with resard to exports. On the other hand, from the 1980s onwards, France had to seek out markets in non-member
countries. Partly because of chans•• in the composition of animal feeds, the Netherlands now imports and re-exports leas barley than in the past. Belsium seems to be withatandins this trend better than the Netherlands. Here too, the role of Gent and Antwerp as expandins srain markets should be noted.
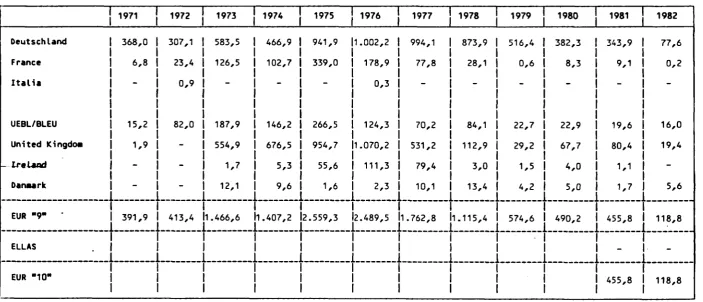
Maize is a product of which the Community needs more than it srowa. Three Kember States are concerned: France, an exportins country, and Belsium and the Netherlands, which re-export. Haize-srowins varies widely and the introduction of hybrid varieties has also altered production trends. It 1• therefore more difficult to discern trends for maize than for wheat and barley (Table 33). France suffered a loss of market share from 1971 to 1977 mainly because of an increase in imports from non-member countries comins throush Rotterdam, needed to cover the Community's requirements. From 1977 onwards, two trends became discernible. In the first place, an increase in internal production with a definite slowdown in the internal consumption of maize (aufferins competition from other products) and therefore an
- 20
-reporta. 1976 and 1977 were year• of drousht, but they were alao year• in which, in more than one reapect, trend• for many asricultural product• chansed direction.
Thia ia, for example, the caae for ausar (Table 36). An explanation of the chan&• here may lie in the fact that from 1973 to 1976 the new member•, particularly the United ~in&dom and Denmark, sradually
reached their production quotaa, and thia ia confirmed by an analyaia of the srowth in their aelf-aufficiency ratea (Table 70). Prom
1976/77/78 onwarda, the internal market abarea enjoyed by Prance, Germany, the Netherland• and Denmark were rou&hly atable, apart from output variation• normal for thi• crop, while Ireland'• market abare tended to continue srowin&, and the BLBU'• tended to decline. In thia context, l t ia hard to diacern any important role played by the KCAa.
With resard ~o freah vesetablea, the problem of intra-Community trade la intereatin& aince, aa tbeae product• have no KCAa, the queation arises as to whether the nesatlve KCA countrie• are to benefit from their "devaluation premium". Table 37 doea not offer a definite answer. Prance, it is true, increaaed ita abare of the internal market; converaely, Italy tended to auffer market lo••••· Prance'•
increaae 1• atronser while Italy'• lo•••• are more limited in 1981 and 1982, if Greece, for which statistics are available only from 1981 onwards, ia left out of the picture. It would aeem that in the caae of Italy, i t ia not ao much marketln& problema a• the fact that
domeatic conaumption srowa aharply, accountin& for much of the mar&in of increase in domeatic production.
- 21
-In conclusion, analysis of chanses in the market shares of the various Member States in intra-Community trade in crop products yields the followins main findinss:
a sharp increase in the United Kinsdom•s share of the common wheat and barley markets, this increase startins when the United Kinsdom shifted from nesative to positive MCAs;
a pattern of contrasts for intra-Community trade in maize, with the factor of relative prices of imported feed provins more important than the incidence of differing MCAs;
a stabilized situation on the sugar market as a result of the quota system;
rapid progress by France on the fresh vegetables market, which could be due to an exchange advantage supported by a relatively effective marketing network;
an unchansed situation with regard to fresh fruit, and the
weak-currency countries failed to turn their .. devaluation premium .. to good account.
(b) Trade in livestock products
In respect of trade as well, a distinction must be made between beef/veal products (milk and meat) and grain-based or
grain-substitute-based products (pigmeat, esgs and poultry).
- 22
-aendins moat of their milk production for proceaains, loat sround. From 1977-1978 onward•, the aituation in term• of intra-Community market aharea, •••m• to have become atable, with minor loaaea auffered by Denmark and the United Kinsdom.
Aa for butter, here too, from 1976 onwarda, the aituation aeema, on averase over the period, to have become atable (Table 64).
Nonetheleaa, two lons-term trend• are diacernible: laatins market ahare saina for the BLBU and a permanent decline in Denmark'• market ahare. It i• hard to ••• how theae chans•• can be directly accounted for by the MCAa. For intra-Community trade in akimmed-milk powder
(Table 63), the market i• aomewhat artificial beeauae of the many diapoaal aehemea and no clear trend can be drawn from analyais of the atatiatieal aeri••·
There are many varietiea of ch••••• and thi• i• an important factor, notably the difference• between freah cheeae and aoft cheeaea and hard ch•••••· The main obaervation over a lons period ia a twofold trend
(Table 68): major &aina by Germany and a decline auffered by the Netherland•. Aa far aa 1978, the United Kinsdom waa makins alow but laatlns prosr•••· with Ireland aufferins equivalent loaaea. Here asain, there la no evidence that the HCAa have played a crucial role.
A• for beef/veal (Table 39), Germany'• market ahara increaaed firmly and ateadily for twelve yeara, and the Netherland• alao sained sround thoush more alowly; in other worda, the two poaitive HCA countriea achieved increa••• in market aharea. A• France loat no sround, th••• saina were mainly at the expenae of Ireland, a nesative HCA country. The market ahara• of the other Member State• fluctuated but no
- 23
-The pi&meat market (Table 41) is not easy to analyse; this is the only product for which the market shares of
All
the Kember States chan&ed between 1973 and 1982, and in many cases trends chan&ed direction durin& the period. Only one consistent trend isdiscernible: the Netherlands was the only country to steadily achieve a market share increase from 1973 to 1982. Similarly, Germany
achieved steady increases from 1971 to 1980, but thereafter lost &round. Conversely, the BLBU is the only country to lose &round .steadily (except in 1974). France and Ireland broadly maintained their market shares until 1976 and thereafter lost &round, thou&h more in the case of France than in the case of Ireland. The trend was the opposite in the case of Denmark: its market share contracted until 1977/78 and recovered thereafter. The United Kin&dom•s market share fluctuated from 1973 to 1979 and then, in three years, soared by almost 20~.
Clearly, many factors are at work in this sector, which has under&one radical chan&• in the last fifteen years, and many influences have combined to lead to major chan&•• in market shares. Apart from the pi& cycles, there have been reor&anizations of herds, chan&•• in feed, chan&•• with re&&rd to breeds, new processin& techniques, etc. These chan&•• have often been facilitated by state aids and even by
Community aids. In the absence of a very detailed study, it is
therefore not easy to analyse the effects of the &&ri-monetary system on trade in pi&meat. Nonetheless, a classification accordin& to the &&ri-monetary situation should be of interest, as intra-Community trade in pi&me&t has been much disturbed in the last ten years. A clear trend is discernible: since 1976, all the ne&&tive KCA
countries (France, Italy and Ireland) suffered market share losses. The situation is less uniform for the positive KCA countries; the main development is, of course, the sharp &&ins made by the
- 24
-from 1973 to 1982, yieldins to the visour of activity in the Netherland•. The United Kinsdom'a •hare .in intra-Community trade fluctuated from 1973 to 1979, a period durin& which the United Kinsdom had nesative MCA•; it then tripled in three year• (1980-81-82), a period durins which the United Kinsdom had po•itive KCAa.
Demand for poultrymeat ha• lncrea•ed •teadily over the la•t twenty year• in the Community, and there have al•o been major ehans•• in trade •hare• (Table 57). The main feature i• that the •hare enjoyed by the Netherland•, which alone accounted for 80~ of intra-Community trade in 1971, hae •harply contacted, and repreeented only 6~ in 1982. The BLBU achieved a •harp increa•e until 1974, but it ha• •ince been more than halved. The •harp contraction of the Benelux •hare, which had been nearly 9~ in 1971, provided opportuniti•• of which all the other Kember State• availed them•elve•, thoush not to the eame extent, and with variation•, •ometime• wide variation•, from one year to the next.
Cla••ification of the Member state• accordins to their asri-monetary •ituation •how• that all the nasative MCA countrie• (France, Italy and Ireland) from 1978, achieved intra-Community market ehare caine. Aa resard• the po•itive KCA countrle• (Germany, Netherland•, Belslum and Luxembours), Benelux lo•t around permanently and Germany lo•t &round from 1980, after an lncrea•• from 1971 to 1980. The United Kinsdom made permanent saln• a• lone ae i t had nesative MCA•, but the
eituation fluctuated when the MCA• became po•ltive.
- 25
-But in this field,· as in that of pismeat and poultrymeat, the BLBU's share contracted. On the other hand, the Netherlands made sharp increases. The shares of the other Kember States fluctuated in various ways and no lastins medium-term trends are discernible. It would seem therefore that in the case of esss, the impact of the MCAs
is lisht when compared with that of other market determinants.
Analysis of chanses in the market shares of each Member state in intra-Community trade in livestock products yields the followins main findinss:
chanse• in market shares are much larser for livestock products than for crop products;
amons the livestock products, they are sreater for the meats than for milk;
within the srain-based meats, chanses in the market shares are more appreciable for pismeat than for poultry;
summarY of tht final conclu1ion1 of tht Commi••ion'•
Communication on tht tconomic tfftct• of tht &Kri monttarY IYittm (COK(78)20, 10 February 1978)
The asri-monetary •Y•tem, •• implemented, ha• proved harmful •inca it ha• siven la•tins protection to the farm ••ctor - already partly •hitlded from the law• of the market - from the normal con•equenc•• which exchanse rate chaos•• have on other indu•trie•.
the u•e of "sreen" rates differin& from the market rate• ha• broken the unity of the common asricultural market;
in 10 far •• production and con1umption of asricultural product• re1pond to price chan&••· the influence of the asri-monetary •Y•t•m i• undeniable; this influence i• all the more marked the looser the price difference• per•i•t and the wider they are;
the •sri-monetary •y•tem tend• to cu•hion the normal impact of exchans• rate chanses for that part of the asricultural •ector to which i t applie1,
there i• no •insle effect on trade, but effect• are ob•erved in certain 1pecific ca•e• and the KCA technique u•ed i• cau•in& difficultie•. The Commi••ion will continue to monitor chanse• in the•e •ector• and, where nece••ary will propo•e appropriate mea•ur••· However, i t mu•t be 1tre11td that the asri-monetary •Y•tem i• only one factor amons many;
I
LIST OF TABLES
Production and availability, by product
COMMON WHEAT - Usable production
BARLEY
"
"
MAIZE
II"
SUGAR
"
IIFRESH VEGETABLES
II IIFRESH FRUIT
"
~ IIBEEF AND VEAL - Gross domestic production
TOTAL CATTLE NUMBERS
PIGMEAT - Gross domestic production
PIG NUMBERS
POULTRYMEAT - Gross domestic production
EGGS - Usable production
MILK - Total production
BUTTER - Usable production
CHEESE - {all cheese) Usable production
COMMON WHEAT - Production and availability
BARLEY
MAIZE
WHITE SUGAR
II
"
n
II II
n n
n n
BEEF AND VEAL - Gross domestic production and availability
PIGMEAT - Gross domestic production and availability
POULTRYMEAT - Production and availability
FRESH MILK PRODUCTS - Production and availability
BUTTER {weight)
CHEESE
n
II
n n
II
"
No
1
2
3
4
5
6
7
9
10
12
13
14
15
17
19
21
22
23
24
25
26
27
28
29
2
-II. Trade, by product
WHEAT (including Durum Wheat) Share of each Member State
in intra-Community trade (on basis of export figures)
COMMON WHEAT - Share of each Member State in intra-Community
trade (on basis of export figures)
DURUM WHEAT -
Share of each Member State in intra-Community
trade on basis of export figures)
BARLEY - Share of each Member State in intra-Community trade
(on basis of export figures)
MAIZE - Share of each Member State in intra-Community trade
(on basis of export figures)
MAIZE - Exports of maize to other Member States (Netherlands)
RAW AND REFINED SUGAR - Share of each Member State in
intra-Community trade (on basis
31
3la
32
33
35
of export figures)
36
FRESH VEGETABLES - Share of each Member State in intra-Community
trade (on basis of export figures)
37
FRESH FRUIT - Share of each Member State in intra-Community
trade (on basis of export figures)
BEEF AND VEAL - Share of each Member State in intra-Community
trade (on basis of export figures)
BEEF AND VEAL - Structure of beef and veal imports (Italy)
PIGMEAT - (all products) Share of each Member State in
intra-Community trade (on basis of export figures)
PIGMEAT - Trade in Germany
PIGMEAT - Trade in France
PIGMEAT - Trade in Italy
PIGMEAT - Trade in Netherlands
PIGMEAT - Trade in BLEU
PIGMEAT - Trade in United Kingdom
PIGMEAT - Trade in Ireland
PIGMEAT - Trade in Denmark
PIGMEAT - Structure of imports (ITALY)
38
39
40
41
44
45
46
47
48
49
50
51
3
-PIGMEAT - Structure of exports (NETHERLANDS)
53
PIGMEAT - Structure of imports (UNITED KINGDOM)
54
PIGMEAT - Structure of exports (DENMARK)
55
LARD - Share of each Member State in intra-Community trade
56
POULTRYMEAT - Share of each Member State in intra-Community trade
57
EGGS - Share of each Member State in intra-Community trade
58
MILK AND FRESH MILK PRODUCTS - Share of each Member State in
intra-Community trade
59
FRESH MILK AND CREAM - Structure of exports
61
FRESH MILK AND CREAM - Structure of imports
62
SKIMMED-MILK POWDER AND WHEY - Share of each Member State in
intra-Community trade
BUTTER - Share of each Member State in intra-Community trade
BUTTER - Structure of exports
BUTTER - Structure of imports
CHEESE - Share of each Member State in intra-Community trade
III. Self-sufficiency
TOTAL CHEESE - BARLEY
MAIZE - SUGAR
BEEF AND VEAL - PIGMEAT
POULTRYMEAT - EGGS
FRESH MILK PRODUCTS (excl. cream) - SKIMMED-MILK POWDER
BUTTER - CHEESE
IV.
Prices of agricultural products
COMMON WHEAT - Market price/intervention price ratio
DURUM WHEAT - Market price/intervention price ratio
RYE - Market price/intervention price ratio
BARLEY - Market price/intervention price ratio
63
64
66
67
68
69
70
71
72
73
74
75
76
77
LIST OF TABLES
IV.
Prices of agricultural products (contd)
MAIZE - Market price/intervention price ratio
BEEF AND VEAL - Market price/intervention price ratio
PIGMEAT - Market price/intervention price ratio
SKIMMED-MILK POWDER - Market price/intervention price ratio
BUTTER - Market price/intervention price ratio
Ratio of the market price of cereals to the market price of
No
79
80
81
82
83
nitrogenous fertilizers
84
Ratio of the producer price of pigmeat to the purchase price of
compound feeds for pigs
85
Ratio of the producer price of chickens to the purchase price of
compound poultry feeds
86
Ratio of the producer price of eggs to the purchase price of
compound poultry feeds
Ratio of the producer price of milk to the purchase price of
compound feeds for calves
V.
Macro-economic aggregates
Share of products subject to monetary compensatory amounts in
value of final production, 1981 (at current prices)
Share of products subject to monetary compensatory amounts in
value of final production, 1982 (at current prices)
The "implicit price" of intermediate consumption
Breakdown of value of final agricultural production by Member State
87
88
90
90a
9la
(current prices and exchange rates)
92
Breakdown of value of final agricultural production by Member State
(1975 prices and exchange rates)
92a
Breakdown of intermediate consumption by Member State
(current prices)
Breakdown of intermediate consumption by Member State
(1975 prices and exchange rates)
Breakdown of gross added value at market prices by Member State
(current prices and exchange rates)
92b
92c
LIST OF TABLES
V.
Macro-economic aggregates (contd)
Breakdown of gross added value at market prices by Member State
(1975
prices and exchange rates)
Volume of - final agricultural production
- intermediate consumption
- gross added value (at market price)
Evaluation of the effects of quantity, price and exchange rate
on the value of final agricultural production
(UFAP) 1975-1981
VI. Intra- and extra-Community trade
Share of products subject to MCAs in internal and external trade
No
9~
93b
94
in agricultural products and foodstuffs,
1973-1982
95
EEC Member States' trade balances for
1981
for
(i) agricultural products and foodstuffs, and
(ii) all products
100
EEC Member States' trade balances for
1982
for
(i) agricultural products, and
Table No 1 - CO""ON WHEAT - Usable production
,---
Units 1196~/t,? 19/.U ( _) : 1':f,')/ 1:.I 197:..'75 1 9 '5' /6
I
1 9 ;· b' .' .' : HI : . I 0i
1 9 (.:::' ;' 9i
1 9 ,-; / :) ~:'
; 19S:J,' 31
'
19~ ~ . :)('
~---.--
..
_ '6.410
-1
r ii
- 'I
'000 t 6.012 6.921 7.528 6.804 6.501 7.018 7.956 8.061 8.156 8.313
DEUTSCHLAND
% EUR 10
-
16,5 17,6 17,4 19,3 17,4 18,8 17,4 18,1 16,2 16,7- - -
- - - -
- - - ---. - - - --- ----'000 t 14.682 17.602 17.338 18.553 14. 199 15.583 17.086 20.663 19.202 23.256 22.363 FRANCE
% EUR 10
-
45,2 44,1 42,9 40,3 41,8 45,7 45,1 43,0 46,3 45,0'000 t 7.525 6.267 6.212 6.741 6.080 6.113 4.245 5.718 5.599 5.499 5.411 IT ALIA
% EUR 10
-
16,1 15,8 15,6 17,2 16,4 11,4 12,5 12,5 10,9 10,9'000 t 709 676 724 746 528 710 661 792 836 882 882
NEDERLAND
X EUR 10
-
1,7 1,8 1,7 1,5 1,9 1,8 1,7 1,9 1,8 1,8'000 t 900 985 1.049 1.078 724 939 795 1.022 1.014 907 926
UEBLIBLEU
% EUR 10
-
2,5 2,7 2,5 2,1 2,5 2,1 2,2 2,3 1,8 1,9'000 t N.D. 4.717 4.939 6.053 4.432 4.681 5.208 6.530 7.078 8.367 8 .598 UNITED KINGDOM
% EUR 10
-
12,1 12,6 14,0 12,6 12,6 13,9 14,3 15,9 16,7 17,3'000 t N.D. 270 229 254 195 200 250 253 245 239 280*
IRELAND
% EUR 10
-
0,7 0,6 0,6 0,6 0,5 0,7 0,6 0,5 0,5 0,6'000 t N.D. 592 542 592 520 592 606 642 589 652 835
DANMARK
% EUR 10
-
1,5 1,4 1,4 1,5 1, 6 1,6 1,4 1,3 1,3 1,7
--'000 t N.D. 37.519
EUR 9 37.954 41.545 33.482 35.319 35.869 43.576 42.624 47.958 47.608*
% EUR 10
-
96,3 96,5 96,0 95,0 94,7 96,0 95,2 - 95,5 95,5 95,7•- -
~-----2.120 I
'000 t N.D. 1. 444 1.361 1. 739 1.767 1.957 1. 482 2.194 2.018 2.274 ELLAS
% EUR 10
-
3,7 3,5 4,0 5,0 5,3 4,0 4,8 4,5 4,5 4,3- - - --- - - - --- - - - --- --- - - - - >---~
'000 t
EUR 10 N.D. 38.963 39.315 43.284 35.249 37.276 37.351 45.770 44.642 50.232 49. 728·
% EUR 10
-
100 100 100 100 100 100 100 100 100 100- - -
- - - -
- - - .--- ---
-- -
- - - -Table No 2 - BARLEY - Usable production
r· ---
!19121?3 I 1913/74 t 1974!/) i 19~5/76 I 1976'77 119771?8
i
191():79 : 1979/3J I 191)J/31units 1968169 I 19. • "
- - - - j I
l
:J I i ~~ ,- - - --. - - --- - ~ I
I QQQ t 4.825 5.817 6.423 6.83716.761 6.292 7.355 8.436 8.184 8.826 8.687
DEUTSCHLAND
Yo EUR 10
-
17,0 18,4 19,3 20,4 20,5 19,4 21,0 20,6 21,3 22,0---- - -
r- ---- --
- - - - -
1 - - - - --,-0:272---11.321
I QQQ t 9.139 10.466 10.844 9.972 9.344 8.530 11 • 196 11.716
10.102-FRANCE
~ EUR 10
-
30,5 31,0 28,1 28,3 27,8 27,0 28,2 28,1 28,3 25,6
--I 000 t 258 382 450 552 640 725 668 819 800 947 983
IT ALIA
~ EUR 10
-
1, 1 1,3 1,6 1,9 2,4 1,8 2,0 2,0 2,3 2,5I 000 t
----!---·
258 ·zz.g
390 340 383 315 336 264 287 355 288
NEDERLAND
X EUR 10
-
1,0 1,1 0,9 1,0 0,9 0,8 0,9 0,7 0,6 0,6
-I QQQ t 622 693 776 753 4 76 645 733 841 842 86)- 824
UEBLIBLEU
~ EUR 10
-
2,0 2,2 2,1 1,4 2,1 1,9 2,1 2,1 2,1 2,1I DOD t N.D. 9.152 8.917 9.042 8.428 7.572 10.426 9.750 9.527 10.223
10.127-UNITED KINGDOM
X EUR 10
-
26,7 25,5 25,5 25,5 24,7 27,4 24,3 23,9 24,7 25,7I 000 t N.D. 981 905 1. 041 1
.o
19 922 1.452 1. 396 1. 438 1.523 1 .659*IRELAND
X EUR 10
-
2,9 2,6 2,9 3,1 3,0 3,8 3,5 3,6 3,7 4,2I OQQ t N.D. 5. 571 5.432 5. 967 5. 156 4.801 6.143 6.301 6.662 6.044 6.044
DANMARK
Yo EUR 10
-
16,3 15,5 16,8 15,6 15,6 16,2 15,7 16,7 14,6 15,3-I ODD t N.D. 33.402 34.130 34.479 32.160 29.751 37.336 39.219 38.937 40.402 38.674*
EUR 9
Yo EUR 10
-
97,5 97,6 97,3 97,2 96,9 98,3 97,8 97,8 97,7 98,1r
-I ODD t N.D. 874 850 969 916 944 662 891 861 950 768
ELL AS
Yo EUR 10
-
2,5 2,4 2,7 2,8 3,1 1,7 2,2 2,2 2,3 1,9- - - · +--- - --- - - - --~-- - - 1-- - ----
1---r--39--:--798 1--41.35_2_ ----~
I DOD t N.D. 34.276 34.980 35.448 33.076 30.695 -37~998-- -4o~m- 39.442 ..
EUR 10
j
r.
EUR 10-
100 100 100 100 100 100 100 100 100 100- - - L _ _ _ _ _ _ --- -- - -
Table No 3 - ~AIZE - Usable production
-1974175--~~~~- _1~_6_1-:!__! -~"!__!_7_8~
_,_9?8!-;9--~79/8~ ~-980~8_1-] 19~1
;_sjj
Units 1968/69 1972/73 1973/74- - - -r - - -
--'ooo
t 278 547 556 505 515 466 562 604 741 672 832DEUTSCHLAND
4,5
X EUR 10
-
3,9 3,3 3,4 3,5 3,9 3,5 3,6 4,1 3,8'000 t 5.379 8.257 10.671 8.884 8.209 5.625 8.511 9. 531 10.413 9.365 9.142 FRANCE
X EUR 10
-
58,3 63,3 59,8 56,5 47,6 53,2 56,5 57,5 52,9 49,3'000 t 3.991 4.741 4.995 4.979 5.259
IT ALIA 5.196 6.396 6.162 6.196 6.403 7.197
X EUR 10
-
33,5 29,6 33,5 36,2 43,9 40,0 36,5 34,2 36,1 38,8'000 t 0 10
NEDERLAND 11 10 7 0 0 0 2 2 5
X EUR 10
-
0,1 0,1 0,1 0,0 0,0 0,0 0,0 0,0 0,0 0,0'000 t 3 19 27 25 38 30 30 37 37 39 38
UEBLIBLEU
X EUR 10
-
0,1 0,2 0,2 0,3 0,3 0,2 0,2 0,2 0,2 0,2'000 t 0 6
UNITED KINGDOM 6 3 3 2 3 2 0 0 0
X EUR 10
-
0,0 0,0 0,0 0,0 0,0 0,0 0,0 0,0 0,0 0,0'000 t 0 0 0 0 0 0 0 0 0 0 0* '
IRELAND
X EUR 10
-
0,0 0,0o,o
0,0 0,0 0,0 0,0 0,0 0,0 0,0'000 t 0 0 0 0 0
DANMARK 0 0 0 0 0 0
% EUR 10 0,0 0,0 0,0 0,0 0,0
o,o
0,0 0,0 0,0 0,0 0,0'000 t 9.651 13.580 16.266 14.406 14.031 11.319 15.502 16.336 17.389 16.481 17.214*
EUR 9 I
% EUR 10
-
95,9 96,4 96,9 96,6 95,7 96,9 96,9 96,1 93,0 92,8'000 t N.D. 583 605 459 488 505 496 522 711 1.233 1.337
ELL AS
% EUR 10
-
4,1 3,6 3,1 3,4 4,3 3,1 3,1 3,9 7,0 7,2'000 t N.D. 14.163 16.871 14.865 14.519 11.824 15.998 16.858 18.100 17.714 18.551*
EUR 10
X EUR 10
-
100 100 100 100 100 100 100 100 100 100-