This is a repository copy of Nanopatterning of a Covalent Organic Framework Host-Guest System.
White Rose Research Online URL for this paper: http://eprints.whiterose.ac.uk/92110/
Version: Supplemental Material
Article:
Plas, J., Ivasenko, O., Martsinovich, N. et al. (2 more authors) (2015) Nanopatterning of a Covalent Organic Framework Host-Guest System. Chemical Communications , 52. pp. 68-71. ISSN 0009-241X
https://doi.org/10.1039/C5CC07557B
© 2015 RSC. This is an author produced version of a paper subsequently published in Chemical Communications. Uploaded in accordance with the publisher's self-archiving policy. Version of record: https://dx.doi.org/10.1039/C5CC07557B
eprints@whiterose.ac.uk https://eprints.whiterose.ac.uk/
Reuse
Unless indicated otherwise, fulltext items are protected by copyright with all rights reserved. The copyright exception in section 29 of the Copyright, Designs and Patents Act 1988 allows the making of a single copy solely for the purpose of non-commercial research or private study within the limits of fair dealing. The publisher or other rights-holder may allow further reproduction and re-use of this version - refer to the White Rose Research Online record for this item. Where records identify the publisher as the copyright holder, users can verify any specific terms of use on the publisher’s website.
Takedown
If you consider content in White Rose Research Online to be in breach of UK law, please notify us by
S1
Nanopatterning of a Covalent Organic Framework Host-Guest System
Jan Plas,a Oleksandr Ivasenko,a Natalia Martsinovichb, Markus Lackingerc,d and Steven De Feytera
a. Division of Molecular Imaging and Photonics, Department of Chemistry, KU Leuven, Celestijnenlaan 200 F, 3001 Leuven, Belgium.
b. Department of Chemistry, University of Sheffield, Sheffield S3 7HF, UK
c. Deutsches Museum, Museumsinsel 1, 80538 Munich (Germany)
d. Department of Physics Technische Universität München, James-Franck-Str. 1, 85748 Garching (Germany).
Contents
1. Synthesis of COF-1 on HOPG
2. Geometry optimization of 1 and calculation of adsorption energy of C60 on COF-1/graphite using DFT
3. Details of STM measurements
4. Simultaneous visualization of COF-1 and C60
5. Visualizing defects in the COF-1 monolayer
6. Tentative Models of a) multilayers of C60 on top of COF-1 and b) COF-C60-COF sandwich structure
7. Clustering of C60 molecules at low concentration
8. Invasive STM on multilayers of C60 on COF-1/graphite
9. Multilayer formation of COF-1
10. Increased local coverage of C60 by tip-scanning
11. Ideal shape of scratched area following the symmetry of the COF-1 network
12. Uncontrolled scratching due to defects in the COF-1 network
13. Self-assembly of ISA-OC14 after scratching of C60/COF-1
14. Selective removal of COF-1 sheets when multilayers are formed
S2
[image:3.612.104.510.98.286.2]1. Synthesis of COF-1 on HOPG
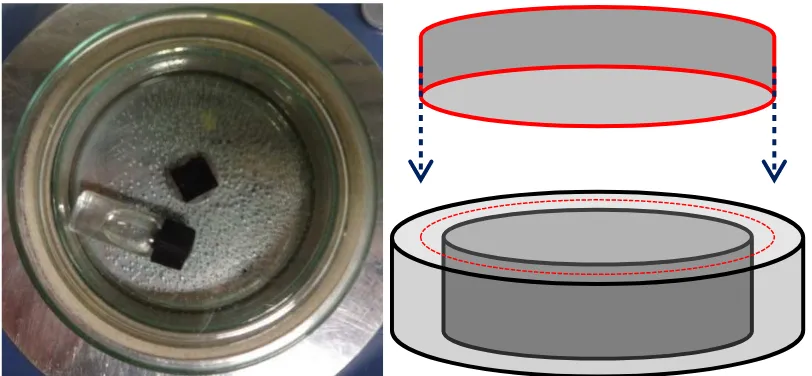
Figure S1: Picture and drawn representation of the glass reactor used for the synthesis of COF-1.
Commercially available benzene-1,4-diboronic acid (≥ 95%) and 1-octanoic acid (≥ 99%) were used as received (Sigma-Aldrich). HOPG samples were purchased from Momentive performance materials Inc., quality grade ZYB.
A 1.5 mg/ml suspension of benzene-1,4-diboronic acid in octanoic acid was sonicated for 15 minutes before dropcasting on a freshly cleaved HOPG sample. The sample was placed inside a glass reactor together with a glass vial containing 1 ml of water. On the vial is a cap with a small hole, which allows slow evaporation of water from the vial inside the reactor.
The reactor is built up out of two petri dishes, 1 large and 1 small, glued together with PDMS. Small grains of sand fill the empty space between the two petri dishes. Before starting the reaction, a third petri dish with a diameter that fits between the other two is placed up-side down and pressed into the sand. In this way, the water vapor that is released in the reactor does not evaporate immediately but slowly diffuses through the sand. This ensures equilibrium conditions and reversibility of the reaction.
S3
2. Geometry optimization of COF-1 and calculation of adsorption energy of C60 on
COF-1/graphite using DFT
Method
All the calculations were done with CP2K software1 using density functional theory (PBE functional2) with empirical dispersion correction (D2) proposed by Grimme.3 Pseudopotentials by Goedecker, Teter and Hutter4 from the CP2K database were used. Double-ζ valence polarized basis sets (DZVP) were used for all atoms. Additionally, five of the lowest-energy structures of the di-boronic acid network were tested using triple-ζ valence polarized basis sets (TZVP); their relative energies differed from the DZVP results by no more than 0.5 kJ mol-1, and binding energies with respect to diboronic acid and gaseous water differed from DZVP by no more than 4 kJ mol-1; this confirms that the DZVP basis set is sufficient. The cutoff for electron density in the auxiliary basis set was 600 Ry.
The structure of the diboronic acid derived covalent organic framework (COF) was modelled using periodic boundary conditions by maintaining the hexagonal symmetry of the unit cell (the angle α between the lattice vectors A and B was kept equal to 60°).
Adsorption of COF and C60 on graphite was modelled using a single layer of graphite, within periodic boundary conditions. The lattice of the COF was adjusted to be commensurate with graphite; two commensurate cells were constructed in this way: one unit cell of the COF on a 6x6 graphite lattice (114 atoms, or 174 atoms when C60 was added) and a 2×2 replicated unit cell of the COF on a 13×13 graphite lattice (506 atoms, or 746 atoms when four C60 molecules were added) – see the following Section for the details of the structures. The z parameter of the cell was set to 12 Å (20 Å if the C60 was present), to ensure a large enough vacuum layer above the adsorbate. The graphite layer was fixed at the ideal atom positions, while the COF and the C60 were allowed to relax. Adsorption energies were calculated and corrected for the basis set superposition error (BSSE) using the counterpoise method.5
[image:4.612.133.482.504.711.2]Geometry optimization
Table S1: Energies of the benzene-1,4-diboronic acid-based COF. (The data for the most stable
structure are in bold). Lattice parameter, Å Energy relative to the
minimum-energy structure, kJ mol-1
Enthalpy of
formation relative to
benzene-1,4-diboronic acid and gas-phase water, kJ mol-1
14.6 86.4 127.2
14.7 56.4 97.1
14.76 41.5 82.2
S4
14.9 15.7 56.5
15.0 4.8 45.6
15.1 0.0 40.8
15.2 1.2 42.0
15.3 7.9 48.6
15.4 19.8 60.6
15.5 36.8 77.6
15.6 58.8 99.6
15.7 85.5 126.3
15.8 116.8 157.5
15.9 152.3 193.1
16.0 191.8 232.6
16.1 235.5 276.3
The optimum lattice parameter of COF-1 was found by varying the value of the parameter A (=B) between 14.6 and 16.1 Å in steps of 0.1 Å, while maintaining the hexagonal symmetry of the cell (with the angle between A and B equal to 60°, figure S2). The lowest-energy value of the lattice parameter was found to be 15.1 Å.
S5
Figure S2: 3×3 extended unit cell of the diboronic acid-based covalent network (a unit cell is highlighted).
C60 adsorption on COF-1/graphite
To model periodic COF-1 network on periodic graphite, the network must be commensurate with graphite. The smallest commensurate system corresponds to one COF-1 unit cell on 6×6 graphite unit cells (figure S3). In this case, the network lattice parameter should be compressed by 2%, from 15.1 Å to 14.76 Å (= 6 × 2.46 Å). This compression costs 41.5 kJ mol-1 per unit cell (Table S1).
• 1x1 COF and 1 C60 on 6×6 graphite:
o -145.2 kJ mol-1 – adsorption energy of one C60 onto COF+graphite.
Figure S3: 1×1 COF and 1 C60 on 6×6 graphite
[image:6.612.194.404.459.601.2]S6
Because of this large energy cost, this commensurability seems less likely than the compressed structure (but in practice, the two networks do not have to be commensurate; commensurability is necessary to model a periodic structure).
• 2×2 COF and 4 C60 on 13×13 graphite system:
[image:7.612.75.469.95.293.2]o -123.2 kJ mol-1 – adsorption energy of one C60 onto COF+graphite.
Figure S4: 2×2 COF and 4 C60 on 13×13 graphite.
These calculations clearly show that the adsorption energy of C60 onto the COF-1/graphite network depends on the periodicity of the network.
C60 intermolecular interaction energy
The energy of C60-C60 interaction at distances relevant to this host-guest network can be approximately evaluated by placing (i) 4 C60 molecules on the 13×13 graphite surface, in the positions corresponding to C60@COF-1 (this structure is similar to Figure S4 but without the COF), and (ii) one C60 molecule on the same 13×13 graphite surface. These systems with different C60 coverage have different intermolecular distances and therefore different strengths of intermolecular interaction. In system (i), the shortest distance between C60 molecules is 8.9 Å and there may be some intermolecular interaction. In system (ii), the shortest distance between C60 molecules is 24.9 Å, and the molecules can be considered non-interacting. The binding energy, with respect to an isolated C60 and graphite, is -73.1 kJ mol-1 per one C60 for system (i) (high coverage) and -63.1 kJ mol-1 for system (ii) (low coverage). Therefore the interaction between C60 molecules in the C60@COF-1 system causes additional stabilization of ~10.0 kJ mol-1.
3. Details of STM measurements
S7
[image:8.612.112.508.99.268.2]4. Simultaneous visualization of COF-1 and C60
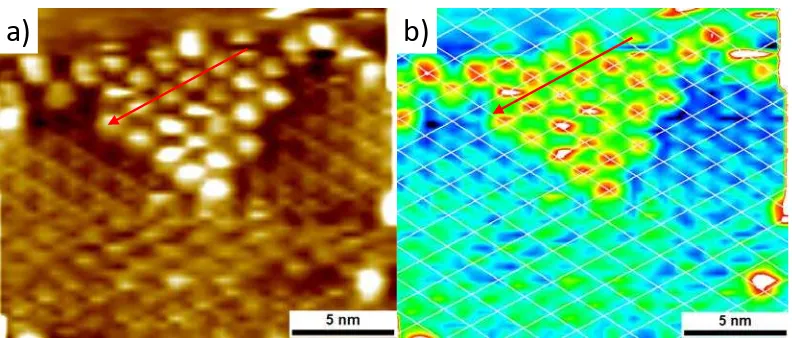
Figure S5: STM image of C60 self-assembled on top of COF-1 (c = 1.39 mmol/l in phenyloctane). Vbias = -0.800 V, Iset = 0.018 nA.
In figure S5a, the red arrow points along the direction of C60 molecules and we can see that this direction indeed corresponds to the position of the pores in the network. The different colors in figure S5b give a better contrast between C60 and COF, which makes it easier to visualize their position. The overlaid white lattice is centered at the C60 positions. When we follow the lattice points, again in the direction of the red arrow, we can see that the C60 positions correspond with the blue areas. These are the lowest points in the apparent height image and correspond to the pores of the network. Representing the data in this way makes it easier to see the identity between the C60 and the COF-1 lattices.
S8
[image:9.612.79.540.98.488.2]5. Visualizing defects in the COF-1 monolayer
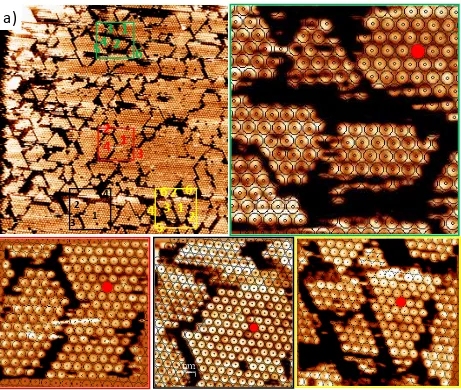
Figure S6: a) STM image (120 × 120 nm) of C60 on top of COF-1 self-assembled from a saturated solution in phenyloctane. Vbias = -0.900 V, Iset = 0.02 nA. The four rectangular digital zoom-ins correspond to the insets, each having its own specific colored edge.
S9
6. Tentative Models of a) multilayers of C60 on top of COF-1 and b) COF-C60-COF
[image:10.612.75.521.113.515.2]sandwich structure
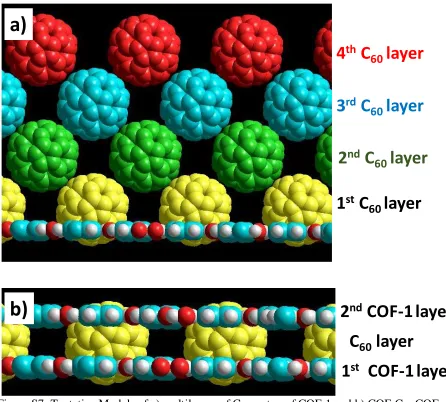
Figure S7: Tentative Models of a) multilayers of C60 on top of COF-1 and b) COF-C60-COF sandwich structure.
1
stC
60
layer
2
ndC
60
layer
3
rdC
60
layer
4
thC
60
layer
2
ndCOF-1 layer
1
stCOF-1 layer
C
60layer
a)
S10
[image:11.612.165.449.98.378.2]7. Clustering of C60 molecules at low concentration
Figure S8: STM image of C60 self-assembled on COF-1 from a solution in phenyloctane at 4.47 × 10⁻⁵ mol/l. Vbias = -0.900 V, Iset = 0.02 nA.
Looking at the STM image, the area marked with white arrow 1 is bare graphite surface without COF-1. The areas marked with white arrow 2 can be assigned to COF-1 without C60 adsorption. Arrow 3 points at a cluster of C60 molecules.
We can clearly see that the C60 molecules have a tendency to cluster together on top of the COF-1 network. All molecules that can be visualized are located in small clusters, indicating some sort of interaction between the molecules.
1
3
S11
[image:12.612.78.539.101.256.2]8. Invasive STM on multilayers of C60 on COF-1/graphite
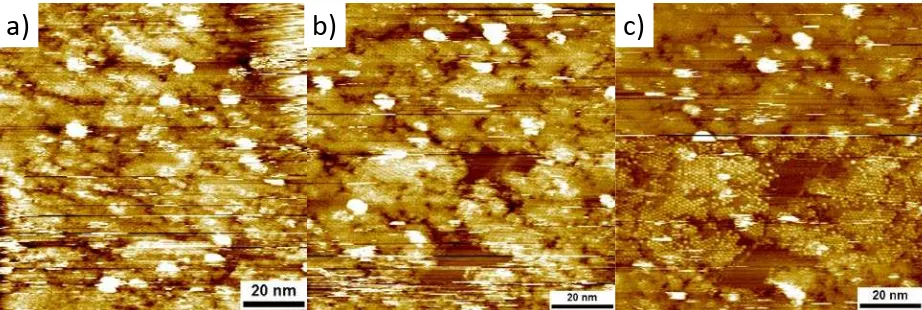
Figure S9: STM images of C60 self-assembly on top of COF-1 network from a saturated solution in phenyloctane. Vbias = -0.900 V, Iset = 0.02 nA.
The STM images in figure a), b) and c) were recorded at the same location. a) is the first scan, b) the seventh and c) is the eight scan in a row of consecutive images. In figure a), there is a lot of material/C60 present on the surface what makes it difficult to clearly identify the structures. Scanning at the same location (8 times in a row) seems to remove molecules from the scan area. In figure b) the imaging conditions are already more stable and we can clearly see the size and shape of different domains. The sudden tip-change in figure c) is caused by applying a voltage pulse. Only then it is possible to identify single C60 molecules. It appears that the STM tip is responsible for the removal of the excess of material. A possible explanation for this observation is the presence of multilayers of C60. STM is not effective in resolving these multilayers, but after removing the excess of material (with the STM tip) we can see the molecules in the first (and second) layer.
S12
[image:13.612.152.464.101.573.2]9. Multilayer formation of COF-1
Figure S10: a) STM image of C60 self-assembled on top of COF-1 from a solution in phenyloctane containing c = 1.39 mmol/l C60. b) Line profile of the white line in figure a).
We can clearly observe contrast variations when we compare different domains of C60 molecules. Domain 1 in figure S10a for instance, appears to be lower in height compared to domain 2 next to it. The apparent height difference between these two domains is approximately 0.35 ± 0.10 nm, which can be expected as a height difference between a mono- and bilayer of COF-1. (The experimental value reported in literature is 0.33 nm.6) The contrast variation in combination with the apparent height difference is a good indication for the formation of bilayers of COF-1 underneath the C60 layer.
1
2
a)
S13
[image:14.612.79.538.101.256.2]10. Increased local coverage of C60 by tip-scanning
Figure S11: STM images of C60 on top of COF-1 self-assembled from a 4.47 x 10⁻⁵ mol/l solution in phenyloctane. Vbias = -0.900 V, Iset = 0.02 nA. Figure b) was taken 9 minutes after figure a) and the area was scanned continuously during this time (8 consecutive images). Figure c) is a zoomed-out image of the same area taken after the image in figure b) was recorded.
[image:14.612.198.413.409.618.2]Due to the scanning procedure, the coverage of C60 increased from 14% in figure S6a to 32% in figure S11b. In figure S11c we can see that this is a local effect, caused by the scanning procedure. The coverage in the area surrounding the scanned area is clearly not as high (figure S11c).
11. Ideal shape of scratched area following the symmetry of the COF-1 network
Figure S12: STM image of C60 on top of COF-1 self-assembled from a saturated solution in phenyloctane. Vbias = -0.900 V, Iset = 0.02 nA. The black hexagon indicates an area where no
COF is present.
The spontaneously created empty area in figure S12 is more or less hexagonal. This means that preferentially, the symmetry of the COF-1 network is followed.
S14
[image:15.612.78.538.104.330.2]12. Uncontrolled scratching due to defects in the COF-1 network
Figure S13: STM images of self-assembly of C60 from a saturated solution in phenyloctane on top of COF-1 network. Vbias = -0.900 V, Iset = 0.02 nA. A scratching procedure at Vbias = -0.100 V, Iset = 0.5 nA was applied to the area in the black square.
The red arrows in figure S13a are pointing at defects in the COF structure. We found that scratching in the vicinity of these defects, and close to the domain border in this case, has a dramatic effect on the quality of the scratched shape.
The blue curved arrow in figure S13a points out a piece of the COF that has been moved going from figure a) to b) as a consequence of scratching.
13. Self-assembly of ISA-OC14 after scratching of C60/COF-1
Synthesis of ISA-OC14
Synthesis of Dimethyl 5-(tetradecyloxy) isophthalate
To a solution of dimethyl 5-hydroxyisophthalate (2.0 g, 9.52 mmol) in DMF (50 mL), K2CO3 ( 6.5 g, 47.6 mmol) was added and the reaction mixture was stirred at room temperature for 30 min, then 1-bromotetradecane (7.0 mL, 23.8mmol) was added and the reaction mixture was heated at 110ºC for 12 hours. After being cooled to room temperature the solid was filtered and solvent was concentrated under reduced pressure. The residue was dissolved in CH2Cl2 and the organic layer was washed with water and brine, dried over anhydrous MgSO4 and concentrated under vacuum to obtain dimethyl 5-(tetradecyloxy) isophthalate 1 as white solid (2.9 g, 75%). MS (ESI) m/z = 407 [MH]+; 1H NMR (300 MHz, CDCl3): 8.25 (s, 1H, ArH), 7.73 (s, 2H, ArH), 4.03 (t, J = 6.6 Hz, 2H, OCH2), 3.93 (s, 6H, COOCH3), 1.82-1.77 (m, 2H, CH2), 1.48-1.44 (m, 2H, CH2), 1.39-1.26 (m, 20H, CH2), 0.87 (t, J = 6.4 Hz, 3H, CH3).
S15
Synthesis of 5-(tetradecyloxy) isophthalic acid
To a suspension of dimethyl 5-(tetradecyloxy) isophthalate 1 (2.9 g, 7.14 mmol) in methanol (30 mL) was added a solution of NaOH (1.42 g, 35.7 mmol) in 15 mL water. The reaction mixture was heated to reflux for 5 hours. After completion of the reaction, the organic phase was evaporated under reduced pressure. The aqueous phase was acidified with concentrated HCl. A white solid precipitated from the solution and the solid was collected by filtration. After recrystallization from hot methanol 5-(tetradecyloxy) isophthalic acid 2 (2.2 g, 81%) was obtained as a white solid. MS (ESI-) m/z = 376 [M-H]; 1H NMR (300 MHz, DMSO-d6): 8.06 (s, 1H, ArH), 7.62 (s, 2H, ArH),
4.06 (t, J = 6.2 Hz, 2H, OCH2), 1.74-1.70 (m, 2H, CH2), 1.41-1.36 (m, 2H, CH2), 1.35-1.23 (m, 20H, CH2), 0.89 (t, J = 6.4 Hz, 3H, CH3).
The details of ISA-OC14 self-assembly are described elsewhere.7
[image:16.612.80.540.324.478.2]Self-assembly of ISA-OC14 in scratched areas
Figure S14: STM images of C60 self-assembly on COF-1 network from a saturated solution in phenyloctane. Vbias = -0.900 V, Iset = 0.02 nA. Figure a) is the network before scratching, b) after applying a scratching procedure at Vbias = -0.001 V, Iset = 1.100 nA in the white square in a) and ) is a zoomed-in current image of the scratched area in b).
Figure S14b is again a good example of uncontrolled scratching when there are defects in the COF network. The defects marked by red arrows in a) cause the formation of a trench towards the edge of the COF domain. The current image of the scratched area in figure c) gives less contrast between domains of C60 and ISA-OC14 which makes it easier to visualize the self-assembly in the scratched area. The scratched area contains the linear phase of ISA-OC14, while the area above the COF network also shows formation of the porous phase.
S16
14. Selective removal of COF-1 sheets when multilayers are formed
Figure S15: STM images of COF-1 double layer. The white numbers depict the number of COF sheets. Vbias = -0.600 V, Iset = 0.06 nA. The tunneling conditions for the scratching from a)b) are Vbias = -0.100 V, Iset = 0.700 nA and from b)c) are Vbias = -0.001 V, Iset = 2.000 nA.
Figure S15a is the COF double layer before scratching. In figure S15b a small area of the double layer has been removed and the COF monolayer is exposed. In figure S15c a small patch of the exposed monolayer in S15b has been completely removed and the pristine graphite surface has been exposed. Due to the invasive setting that are necessary for the scratching of the monolayer COF, an additional part of the double layer has been removed, but part of it is still present.
References
1. J. VandeVondele, M. Krack, F. Mohamed, M. Parrinello, T. Chassaing and J. Hutter,
Computer Physics Communications, 2005, 167, 103-128.
2. J. P. Perdew, K. Burke and M. Ernzerhof, Physical review letters, 1996, 77, 3865. 3. S. Grimme, Journal of computational chemistry, 2006, 27, 1787-1799.
4. S. Goedecker, M. Teter and J. Hutter, Physical Review B, 1996, 54, 1703. 5. S. F. Boys and F. d. Bernardi, Molecular Physics, 1970, 19, 553-566.
6. A. P. Cote, A. I. Benin, N. W. Ockwig, M. O'Keeffe, A. J. Matzger and O. M. Yaghi,
science, 2005, 310, 1166-1170.
7. K.-W. Park, J. Adisoejoso, J. Plas, J. Hong, K. Müllen and S. De Feyter, Langmuir, 2014,
30, 15206-15211.