This is a repository copy of
Evaluation of different computational modelling strategies for
the analysis of low strength masonry structures
.
White Rose Research Online URL for this paper:
http://eprints.whiterose.ac.uk/81439/
Version: Accepted Version
Article:
Giamundo, V, Sarhosis, V, Lignola, GP et al. (2 more authors) (2014) Evaluation of
different computational modelling strategies for the analysis of low strength masonry
structures. Engineering Structures, 73. 160 - 169. ISSN 0141-0296
https://doi.org/10.1016/j.engstruct.2014.05.007
[email protected] https://eprints.whiterose.ac.uk/ Reuse
Unless indicated otherwise, fulltext items are protected by copyright with all rights reserved. The copyright exception in section 29 of the Copyright, Designs and Patents Act 1988 allows the making of a single copy solely for the purpose of non-commercial research or private study within the limits of fair dealing. The publisher or other rights-holder may allow further reproduction and re-use of this version - refer to the White Rose Research Online record for this item. Where records identify the publisher as the copyright holder, users can verify any specific terms of use on the publisher’s website.
Takedown
If you consider content in White Rose Research Online to be in breach of UK law, please notify us by
EVALUATION OF DIFFERENT COMPUTATIONAL MODELLING STRATEGIES
1
FOR THE ANALYSIS OF LOW STRENGTH MASONRY STRUCTURES
2
3
Giamundo V.a, Sarhosis V.b,1, Lignola G.P.c, Sheng Y.d, Manfredi G.e
4
5
a
Corresponding author: Department of Structures for Engineering and Architecture,
6
University of Naples Federico II, Via Claudio 21, 80125, Naples, Italy,
7
8
Phone: +39 081 768 3663
9
b
School of Civil Engineering, University of Leeds, Woodhouse lane, LS2 9JT, Leeds, West
10
Yorkshire, UK,
11
1
Institute of Environment and Sustainability, University of Cardiff, Newport Road CF24 0DE,
12
Cardiff, UK, [email protected]
13
c
Department of Structures for Engineering and Architecture, University of Naples Federico II,
14
Via Claudio 21- 80125 Naples, Italy, [email protected]
15
d
School of Civil Engineering, University of Leeds, Woodhouse lane, LS2 9JT, Leeds, West
16
Yorkshire, UK, [email protected]
17
e
Department of Structures for Engineering and Architecture, University of Naples Federico II,
18
Via Claudio 21, 80125, Naples, Italy, [email protected]
19
20
ABSTRACT
21
Masonry is a composite material characterized by a large variability of its constituent materials.
22
The materials used, the quality of the bond and variations in the standard of workmanship
23
significantly affect the mechanical performance of the overall masonry structure. Masonry
24
structures, especially the historical ones, are usually characterized by low strength, due to a
25
variety of reasons, namely low units and/or mortar strength or low bond; this makes more
26
difficult to study these types of structures according to general rules because of different
27
*Manuscript
structural schemes. The aim of this paper is to evaluate the suitability of continuous FEM
1
(Finite Element Method) or discrete DEM (Distinct Element Method) approaches to analyse the
2
behaviour of low strength masonry and to contribute to the knowledge and selection of the best
3
approach with a cost and time effective solution. The comparison with experimental results on
4
different low strength masonry validated the approaches and showed that, for low bond strength
5
masonry, DEM approaches performed better compared to low unit strength masonry where the
6
emphasis on joint behaviour in DEM approaches is less effective because the weak component
7
is the unit.
8
Keywords: Masonry modelling, low strength masonry, finite element analysis, distinct
9
element analysis.10
11
1 INTRODUCTION12
Masonry is the generic term for a composite material made of a large number of separate small
13
elements (units) bonded together by some binding filler (mortar) in many very different
14
arrangements. The materials used, the quality of the bond and workmanship and the masonry
15
textures significantly affect the mechanical performance of the overall masonry structure.
16
Masonry structures, especially the historical ones, are usually characterized by low strength, due
17
to a variety of reasons, and mainly these different types of low strength masonry can be
18
outlined:
19
a) Low bond strength masonry;
20
b) Low unit strength masonry;
21
c) Low unit and mortar strength masonry.
22
Low bond strength masonry refers to masonry in which the bond at the unit/mortar interface is
23
such low so that it will have a dominant effect on the mechanical behaviour such as the
24
formation of cracks and the formation of the collapse mechanism. Such type of masonry is
25
encountered: a) in historic constructions where lime mortar were mainly used; b) masonry arch
26
disrupted by the action of water leeching through the masonry; and c) in more recent examples
1
of masonry construction due to lack of quality control on site.
2
Low unit strength masonry refers to masonry in which the strength of the unit blocks has a
3
dominant effect on the mechanical behaviour and failure mechanism. Such type of masonry is
4
encountered in constructions made of tuff blocks. Tuff is a building material used in wall
5
constructions around the world since ancient times. Tuff is characterised as soft, porous rock
6
formed by the compaction and cementation of volcanic ash. Such type of structures is often
7
encountered in Italy, Turkey and Japan.
8
Low unit and mortar strength masonry refers to masonry in which the strength of the units is
9
comparable to the strength of the mortar. Therefore both the unit and the mortar strength will
10
have a dominant effect on the mechanical behaviour and failure mode. Such type of masonry is
11
encountered in adobe constructions.
12
1.1 Available strategies to model masonry and difficulties for modelling masonry
13
The need to predict the in-service behaviour and load carrying capacity of masonry structures
14
has led researchers to develop several numerical methods and computational tools which are
15
characterized by their different levels of complexity. For a numerical model to adequately
16
represent the behaviour of a real structure, both the constitutive model and the input material
17
properties must be selected carefully by the modeller to take into account the variation of
18
masonry properties and the range of stress state types that exist in masonry structures. A broad
19
range of numerical methods is available today ranging from the classical plastic solution
20
methods [1] to the most advanced non-linear computational formulations (e.g. finite element
21
and discrete element methods of analysis). The selection of the most appropriate method to use
22
depends on, among other factors, the structure under analysis; the level of accuracy and
23
simplicity desired; the knowledge of the input properties in the model and the experimental data
24
available; the amount of financial resources; time requirements and the experience of the
25
modeller [2]. It should also be expected that different methods should lead to different results
26
approach selected to model masonry should provide the desired information in a reliable manner
1
within an acceptable degree of accuracy and with least cost.
2
However, the selection of a suitable method of analysis is not an easy task. Several comparative
3
studies to identify the capabilities and limitations of each method of analysis have been carried
4
out in the past [3,4,5,6,7]. Such studies are mainly focused on comparing the load displacement
5
results of the large scale experiments against those obtained from the different computational
6
model. However, none of these studies investigated the suitability of the method to different
7
types of masonry.
8
1.2 Research Significance
9
The aim of this paper is to evaluate the suitability of different modelling approaches for the
10
analysis of two different types of masonry by comparing the numerical results with the
11
experimental data obtained. The low strength masonry constructions investigated are: a) a low
12
bond strength brick masonry wall panel with opening and b) a low unit strength masonry wall
13
constructed with tuff. Analysis is being carried out using the computational software DIANA
14
for the application of the finite element method with continuous elements and the software
15
UDEC for the distinct element modelling. Comparisons are made in respect to the suitability of
16
the software to predict the development of the crack patterns under incremental loading; the
17
load at first visible cracking; the failure load; the failure mechanism and the load against
18
deflection relationship.
19
20
2 MODELLING APPROACHES FOR MASONRY
21
Masonry structures are made up of several assemblages of constituent materials. This large
22
variability results in a very difficult definition of specific structural and damage analysis
23
techniques for masonry structures. Refined Finite Element Method (FEM) or Distinct Element
24
Method (DEM) can be profitably employed to investigate the mechanical behaviour of masonry
25
structures through different numerical strategies. However their use in prediction analyses is
26
interpretation of numerical results. A significant progress has been attained in the last years
1
about the possibility of performing linear and non linear approaches that can be carried out
2
according to different levels of detail. Several models based on both DE and FEM have been
3
developed. However, performing affordable non linear analyses still require high expertise.
4
2.1 Overview of modelling masonry with FEM
5
To perform a FEM analysis on masonry structures it is possible to use different modelling
6
approaches. These include equivalent frame [8,9,10], equivalent material approach [11,12] and
7
micro modelling [13,14]. The equivalent frame approach is typically used to study the in plane
8
behaviour of masonry structures containing opening or entire structures under vertical and
9
horizontal forces. In this approach each wall with openings is meshed as a two dimensional
10
frame by extending of the contour lines of the openings into “pier panels”, “spandrel panels”
11
and “joint panels” which are respectively vertical, horizontal and jointing components. In the
12
equivalent material approach also known as “macro element approach” the masonry is modelled
13
as a homogeneous material achieving equivalent mechanical properties using homogenization
14
techniques. The micro modelling approach, introduced for the first time by Page [15] which is
15
the more refined, bricks and mortar are modelled separately. This approach make possible to use
16
different mechanical parameters, different constitutive laws and to allow for local failure of the
17
bricks and the mortar. Furthermore it is possible to model the mortar bed with frictional
18
interfaces [16] or without frictional interfaces according to the smeared cracking approach [17].
19
2.2 Overview of modelling masonry with DEM
20
According to Lemos [18], several numerical modelling techniques (e.g. DDA, YADE, EDEM,
21
BALL, DEM) are based on the Discrete Element (DE) method. In particular, there are four main
22
classes of numerical codes that conform to the definition of DE:
23
Distinct Element codes: these programs use explicit time-marching to solve the
24
equations of motion directly. Bodies may be rigid or deformable; contacts are
25
Modal Method codes: the method is similar to the distinct element method in the case of
1
rigid bodies but, for deformable bodies, modal superposition is used.
2
Discontinuous Deformation Analysis codes: contacts are rigid, and bodies may be rigid
3
or deformable. The condition of no-interpenetration is achieved by an iteration scheme;
4
the body deformability comes from superposition of strain modes.
5
Momentum-Exchange Method codes: Both the contacts and the bodies are rigid:
6
momentum is exchanged between two contacting bodies during an instantaneous
7
collision. Frictional sliding can be represented.
8
In particular, a numerical code falls into the category of Distinct Element Method (DEM) only
9
if:
10
It allows finite displacements and rotations of distinct bodies, including complete
11
detachment;
12
It recognizes new contacts automatically as the calculation progresses.
13
Without the first attribute, a numerical code cannot reproduce some important mechanisms in a
14
discontinuous medium; without the second, the numerical code is limited to small numbers of
15
bodies for which the interactions are known in advance. The term Distinct Element Method
16
(DEM) was coined by Cundall [19] to refer to the particular DE scheme that uses deformable
17
contacts and an explicit, time-domain solution of the original equations of motion (not the
18
transformed, modal equations). In particular, such method was originally used in rock
19
engineering projects where continuity between the separate blocks of rock does not exist.
20
However, recently, DEM modelling has also been used for masonry structures. The software
21
UDEC falls into the category of DEM codes and typical examples of masonry structures that
22
have been modelled using UDEC are described by [6,19,20]. In the distinct element method
23
masonry bricks or blocks are represented as an assembly of rigid or deformable blocks which
24
may take any arbitrary geometry. Rigid blocks do not change their geometry as a result of any
25
zones. These zones are continuum elements as they occur in the finite element method (FEM).
1
However, unlike FEM, in the distinct element method a compatible finite element mesh
2
between the blocks and the joints is not required. Mortar joints are represented as zero thickness
3
interfaces between the blocks. Representation of the contact between blocks is not based on
4
joint elements, as occurs in the continuum finite element models. Instead the contact is
5
represented by a set of point contacts with no attempt to obtain a continuous stress distribution
6
through the contact surface. The assignment of contacts allows the interface constitutive
7
relations to be formulated in terms of the stresses and relative displacements across the joint.
8
The unknowns are the nodal displacements of the blocks. However, unlike FEM, the unknowns
9
in the distinct element method are solved explicitly by differential equations from the known
10
displacement while Newton‟s second law of motion gives the motion of the blocks resulting
11
from known forces acting on them. So, large displacements and rotations of the blocks are
12
allowed with the sequential contact detection and update of tasks automatically. This differs
13
from FEM where the method is not readily capable of updating the contact size or creating new
14
contacts. This method is also applicable for quasi-static problems using artificial viscous
15
damping controlled by an adaptive algorithm.
16
17
3. LOW BOND STRENGTH MASONRY WALL PANELS WITH OPENINGS
18
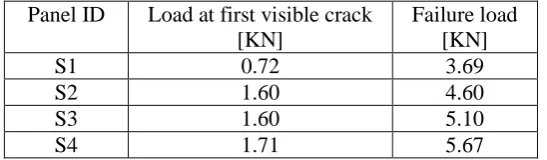
Four single leaf unreinforced masonry wall panels (S1, S2, S3 & S4) were tested in the Heavy
19
Structures laboratory [21]. The wall panels were developed to represent the clay brickwork
20
outer leaf of an external cavity wall containing openings for windows. All panels were built
21
with a soldier course immediately above the opening with the remainder of the brickwork being
22
constructed in stretcher bond. All wall panels had an opening of 2.025 m (see Fig. 1). The bricks
23
were UK standard size (215 mm × 102.5 mm × 65 mm) Ibstock Artbury Red Multi Stock with a
24
water absorption of 14% and a sand faced finish. The joints were all 10 mm thick, 1:12 (opc:
25
sand) weigh-batched mortar. The bricks and mortar were selected to produce brickwork with a
26
in the authors‟ experience, is fairly typical of low rise domestic construction in the UK. Each
1
panel was constructed on the rigid concrete laboratory floor. As a result the bottom edge of each
2
panel was rigidly supported both in horizontal and vertical direction and the vertical edges were
3
left free. Each wall panel was subjected to a single vertical point load applied at the top of the
4
wall at midspan. The point load was distributed through a steel spreader plate. The load was
5
applied to each wall incrementally. The midspan deflection was recorded at each load increment
6
and each wall was inspected visually for signs of cracking throughout the test. Deflections at
7
ultimate load were not taken for safety reasons and to avoid damage to the dial gauge. The test
8
results are summarised in Table 1.
9
3.1 Modelling with UDEC
10
Geometric models representing the clay brick wall/beam panels tested in the laboratory were
11
created in UDEC. Each brick was represented by a deformable block separated by zero
12
thickness interfaces at each mortar joint. To allow for the 10mm thick mortar joints in the real
13
wall panels, each deformable block was based on the nominal brick size increased by 5mm in
14
each face direction to give a UDEC block size of 225 × 112.5 × 75mm. Each block was
15
internally discretised by UDEC into finite-difference zone elements (Fig. 2), each assumed to
16
behave in a linearly elastic manner. In practice, the stresses in the bricks would be well below
17
their strength limit and no significant deformation would be expected to occur in them. In order
18
to replicate this, brick material parameters were specified but no significant block deformation
19
occurred yet the software was enabled to calculate the theoretical stresses in each zone element.
20
The mortar joints were represented by interfaces modelled using UDEC‟s elastic-perfectly
21
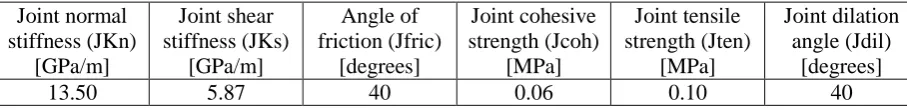
plastic coulomb slip-joint area contact option [22]. This provides a linear representation of the
22
mortar joint stiffness and yield limit and it is based upon six parameters namely: normal
23
stiffness of the joint (JKn); shear stiffness of the joint (JKs); joint friction angle (Jfric); joint
24
cohesive strength (Jcoh); joint tensile strength (Jten); and joint dilation angle (Jdil). The normal
25
stiffness (JKn); the shear stiffness (JKs) and the tensile strength (Jten) of the interface,
26
cohesive strength (Jcoh); the angle of friction (Jfric) and the angle of dilation (Jdil) influence
1
more on the behaviour of the panels after first cracking up to collapse. UDEC also provides a
2
residual strength option to simulate tension softening effects. However, this constitutive law
3
was not selected since the bond strength of the masonry used in the research was much lower
4
than that exhibited by modern masonry materials. Thus, any tension softening effects were
5
considered to be insignificant. The material parameters defined in UDEC to represent the
6
characteristics of the zero thickness interfaces between the mortar joints and the bricks can be
7
difficult to measure in practice [22]. Also, masonry is highly variable, stress-state type
8
dependant material which experiences non uniform distributions of stress in real structures
9
[23,24,25]. To address these difficulties, the material parameters have been obtained by using a
10
method proposed by Toropov [26] based on an advanced optimization of the responses of
11
relatively complex or „„non-trivial‟‟ large scale masonry elements. According to such method,
12
numerical analysis for each large scale experiment is carried out and values of material
13
parameters are tuned so that the difference between experimental and numerical responses can
14
be minimised. In particular, an initial range of material parameters (which are based on results
15
of conventional small-scale experiments or on the codes of practice or on engineering judgment)
16
are used in the model for the numerical simulation. These material parameters can then be
17
modified and tuned through an optimization process in which the function to be minimized is an
18
error function that expresses the difference between the responses measured from experiments
19
and those obtained from the numerical analysis. Such technique better reflects the complex
20
nature of masonry. In particular, in the presented case, the parameter identification was based on
21
the results from the laboratory testing of unreinforced full-scale wall/beam panels constructed of
22
low strength clay brick masonry (a comprehensive overview on the material parameter
23
identification is provided in [26]). The optimization process allowed the authors to tune the
24
UDEC parameters to best simulate pre- and post-cracking behaviour [27]. The UDEC material
25
parameters obtained using this approach are summarised in Table 2.
26
horizontal direction whilst the vertical edges of the wall panel were left free. Self-weight effects
1
were assigned as gravity load. Initially the model was brought into a state of equilibrium under
2
its own self weight and then the externally applied load was assigned in displacement control (in
3
order to have a higher control close to collapse, even if the test was conducted increasing the
4
load). Histories of mid-span displacement were recorded and a load against displacement
5
relationship was determined (Fig. 3). Fig. 3 shows that at low levels of applied load, the
6
experimental stiffness of the panel is similar to the numerical (i.e. achieved by means of UDEC
7
modelling). For a load of 1.2 kN a drop in the numerical curve is visible, such drop corresponds
8
to the first crack occurred to the panel (relaxation of the loading and moment redistribution in
9
the panel). When a crack propagates there is an abrupt loss of stiffness in the panel. As the load
10
applied to the panel increases, the numerical curve shows a slight deviation from the numerical
11
one. This difference could be due to short term creep effects and load redistribution that
12
occurred in the panel with the application of load. Indeed, such phenomena are very difficult to
13
record in the lab test. Another factor contributing towards this difference is that under force
14
control during test, as the panel neared a state of impending collapse, cracks developed and
15
propagated throughout the panel influencing the accuracy of the record of the test results.
16
Figs. 4 and 5 show respectively the failure mode of the masonry wall panel predicted with
17
UDEC and the effective failure mode observed experimentally. Despite the great variability of
18
masonry [22,23], good correlation was obtained between the results from the UDEC model and
19
those obtained from the tests in the laboratory.
20
3.2 Modelling with FEM
21
The FEM analysis of the low bond strength masonry wall panels was performed in 2D using the
22
software DIANA developed by TNO DIANA bv [28]. The interaction between mortar joints
23
and brick units modelled using the detailed micro-modelling approach [16]. The geometry of
24
the experimental tests was reproduced modelling mortar and bricks individually without
25
interface elements between them. In Fig. 6 the geometry of the model adopted in DIANA is
26
plasticity models were already successfully employed in previous studies [14,29,30] and they
1
are replicated herein. Interface elements were not considered between mortar and bricks, mainly
2
because reliable experimental mechanical properties of interfaces are not available for this case
3
study. Cracking and plasticity behaviour is provided by combined nonlinear behaviour of mortar
4
and bricks. A regular and dense discretization was used [31] based on the CQ16M eight-node
5
quadrilateral isoparametric plane stress elements with an average dimension of 10 mm have
6
been used for the meshing of both the mortar and the bricks (according to previous studies
7
[14,29,30]. These elements are based on quadratic interpolation and Gauss integration [28].
8
Boundary conditions reproduced the experimental setup. The base sections of the piers of the
9
wall were fixed and the load was applied by means of an imposed displacement (like as in
10
UDEC) by means of a loading platen reproducing the steel platen used in the experimental
11
activity. In Fig. 6the adopted fine mesh is shown. The main causes of non-linear behaviour of
12
brick masonry are usually non-linear deformation of the bricks and local crack in the masonry
13
[32,33] hence both these effects should be considered in the modelling. The elastic in-plane
14
behaviour of both the mortar and the bricks was defined by means of Young‟s modulus, E, and
15
Shear Modulus, G, while the post elastic in-plane behaviour was defined by the multidirectional
16
fixed crack model. In particular Rankine yield criteria in tension and Von Mises yield criterion
17
in compression were adopted. The multidirectional fixed crack model is based on fracture
18
energy. In particular linear softening model in both tension and compression were adopted (Fig.
19
7). The linear softening curve, which is the simpler softening model, was chosen because the
20
lack of experimental data and because the overall non-linear behaviour of masonry is not
21
strongly conditioned by the deformation characteristics of its components [32,33,34]. This
22
softening model is defined by means of two characteristic values: the strain at the maximum
23
compressive, fc, (and tensile, ft, similarly) stress and the ultimate strain (reached when the
24
material is completely softened). The softening behaviour is related to the fracture energy to the
25
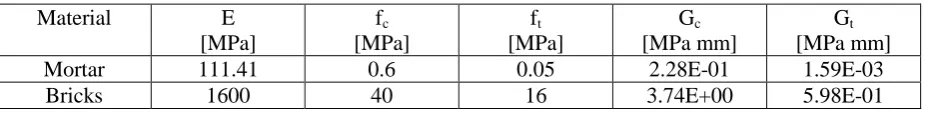
equivalent crack bandwidth (this value is automatically computed by the Software [28]. Tensile
26
and compressive strength, fracture energy in compression, Gc, and in tension, Gt, were
calibrated by means of the global experimental force/deflection curve and sensitivity analyses
1
for both mortar and bricks. Except for the Poisson‟s ratio, which is assumed equal to 0.15 for all
2
the materials [30], inTable 3, all the used material parameters are reported. Numerical analyses
3
were carried out under displacement control measuring in plane forces and the smeared crack
4
pattern evolution. The results of the analyses were compared to the experimental outcomes in
5
terms of force-deflection curve and crack pattern. As shown in Fig. 8, the theoretical curve up to
6
about 0.5 mm, is predicted satisfactorily by numerical simulation and the theoretical crack
7
pattern also is close to the experimental as well. On the other hand, the theoretical curve doesn‟t
8
simulate the post peak behaviour of the experimental tested panels. In particular the scatter
9
between the theoretical failure point and the experimental failure points is, probably, due to the
10
brittle collapse adopted model. Cracking yields to a fast redistribution of tensile stresses in the
11
cracked areas, and at increasing displacement cracking spreads, yielding to premature failure of
12
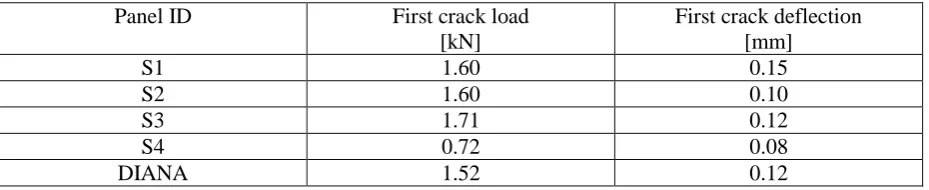
the panel. Theoretical and experimental tests mainly showed the same crack pattern (see Fig. 9).
13
The first crack always occurs in the vertical joint in the lower part of the span because of the
14
low bond strength of the vertical joints. It is worth noting that plastic yielding did not occur in
15
the bricks. In the following Table 4 is a comparison between experimental and theoretical
16
results with DIANA in terms of first crack load-first crack deflection is reported.
17
18
4 LOW UNIT STRENGTH MASONRY WALL PANELS
19
Four as built panels were tested, in the laboratory, under displacement control in order to
20
measure in-plane deformations and strength properties, including the post peak softening
21
behaviour of the specimens. The test setup followed a modified version of ASTM [35],
22
accounting for the dimensions of tuff blocks. Two steel loading supports were placed on the two
23
diagonally opposite corners of the panels to prevent a premature splitting failure of panel edges.
24
All the panels were subjected to diagonal compressive loads forming a 45° angle with the
25
direction of the mortar bed joints (compressive edge load) transferred to the specimen by means
26
1030×1030 mm2 (aspect height-to-length ratio equal to 1) and bricks size 400 × 110 × 250 mm3.
1
Masonry units were overlapped on alternate courses and the mortar joint layer dimension was
2
about 15 mm in thickness and less than 250 mm in width (out of plane dimension) as shown in
3
Fig. 10. Tuff bricks were pre-wetted before to build the panel in order to prevent the mortar
4
drying out due to the water absorption of tuff, resulting in poor bond. The used mortar mixture
5
was designed to reproduce typical mechanical properties of mortars used for old tuff masonry
6
buildings. Two LVDTs placed along the diagonals were used to survey the shear deformation
7
over a gauge length of 400 mm. Table 5 shows the main test results. The crack pattern for all the
8
reference tested panels shows a development of initial cracks along the diagonal mortar joints
9
starting at the middle of the diagonal of the wall. The diagonal cracks involve both mortar and
10
bricks; they opened along the compression strut. The workmanship defects can have a big
11
influence on the global response, indeed, for the panel P2, the failure was due to a combination
12
of tensile failure of mortar joints and tuff units (as shown in the Fig. 11a) while in the other
13
cases (i.e. panel P4) the cracks follow a single line of least resistance mainly through the
14
diagonal mortar joints (as shown in Fig. 11b). A full description of the experimental diagonal
15
compression tests on tuff masonry panels is reported by ref. [36].
16
4.1 Modelling with DIANA
17
In the case of tuff masonry the weakness of the tuff bricks makes possible the propagation of the
18
crack all over the masonry panel even involving the bricks, so a model able to simulate possible
19
crack in the brick is needed (i.e. it is not possible to model the brick as rigid block). The
20
approach adopted for the FEM modelling was the Micro-modelling. Accurate FEM two
21
dimensional numerical analyses have been conducted under plane-stress assumption by means
22
of the TNO DIANA v9.1 code. The panel was modelled by eight-node quadrilateral
23
isoparametric plane stress elements based on quadratic interpolation and Gauss integration (see
24
Fig. 12) while the two steel supports were modelled by means of three-node triangular elements.
25
Bricks and mortar are modelled individually, based on exactly the same approach used in the
26
involved in the numerical simulation are reported in Table 6. Except for both the tensile strength
1
and the Poisson‟s ratio, the parameters are obtained as the average of the values achieved in the
2
experimental tests [36]. The tensile strength has been computed dividing the flexural strength
3
values by 1.2, and the Poisson‟s ratio has been assumed equal to 0.15 for all the materials.
4
Numerical analyses were carried out under displacement control measuring in-plane
5
deformations and stress evolution applying the load through the steel devices according to
6
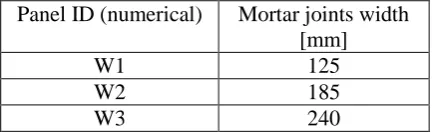
experimental tests. A uniform probability of defects along the mortar joints has been assumed.
7
Therefore, the workmanship defects (i.e. mortar joints not uniformly and not fully filled) have
8
been simulated by modelling an equivalent reduction of the width (out of plane dimension) of
9
the mortar joints. A numerical test matrix with the considered mortar joint widths is reported in
10
Table 7. The results of the analyses were compared to the experimental outcomes in terms of
11
shear stress against average diagonal strains, and shear stress against average shear strain
12
curves. According to ASTM [35] standard method, the shear stress, , has been computed as =
13
0.707 V/An, were V = diagonal load and An = net section area of the uncracked section of the
14
panel (in considered case An = 0.092 m
2). The average vertical and horizontal strains,
vand h
15
have been computed as the average displacement along the compressive and tensile diagonals,
16
respectively, over the same gauge length (400 mm). The shear strain, , according to [35], is =
17
v+ h. The Shear modulus, G, and the Poisson‟sratio, , were computed according to the
well-18
known solid mechanics relationship, as = - h/ v and G = / respectively, where E is the
19
Young‟s modulus. The numerical analyses, in terms of shear strength against average shear
20
strain, fit the experimental results. In particular the smaller considered mortar filling matches
21
the experimental behaviour of the panel P1 (in this case it was argued that the panel P1 had
22
worse behaviour due to the workmanship defects and variability of mortar geometrical
23
properties) and both the fully-filled and half-filled mortar joints analyses match the behaviour of
24
the other as-built panels. A comparison between the numerical and experimental outcomes is
25
plotted in Fig. 13. The partial filling or reduced width (out of plane dimension) of the mortar
26
outcome becomes evident comparing the experimental crack pattern with the DIANA smeared
1
cracking planes for the fully filled and partially filled panels (Fig. 14). The stress field in the
2
panels tends to force the fracture cracks to follow the line of least resistance rather than the line
3
of action of the splitting load just like happened in the experimental tests. The results of this
4
study indicate that the numerical FEM analyses were able to describe well both the trends and
5
the variability of the four experimental tests.
6
4.2 Modelling with UDEC
7
Geometric models of the wall panels tested in the laboratory were created in UDEC. Tuff blocks
8
were modelled as deformable blocks behaving according to UDEC‟s Mohr Coulomb plasticity
9
model. Mortar joints were represented by interfaces behaving according to UDEC‟s Coulomb
10
slip model. As well as in the case of FEM modelling, the workmanship defects have been
11
simulated by modelling an equivalent reduction of the width (out of plane dimension) of the
12
mortar joints. The mortar joint widths considered are the same used in the FEM modelling and
13
they are reported in Table 7. Material parameters have been obtained from micro-scale
14
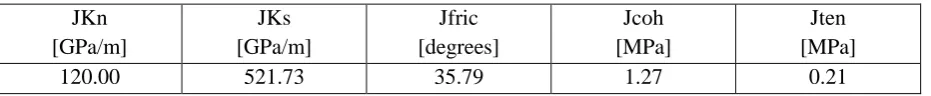
experiments (Table 8) while other modelling parameters have been computed (Table 9). In
15
particular the elastic normal stiffness (JKn) has been computed as the ratio between the Young‟s
16
modulus, E, and the mortar joint thickness, t: JKn = E/t. The angle of friction (Jfric) has been
17
computed as: Jfric = (fc-ft)/(fc+ft), where fc is the mortar compressive strength and ft is equal to
18
Jten. The cohesive strength (Jcoh) has been computed as Jcoh = 1/2 (fcft) 1/2
. The boundary
19
conditions assigned in the model were to represent the conditions of the laboratory test set up.
20
Thus, the base has been fixed and the platen has been constrained to move only in the vertical
21
direction. The model was brought initially at equilibrium. Then external loading has been
22
applied in displacement control. A constant vertical velocity was applied at the load spreader
23
plate on the top of the wall panel. The velocity was converted to a vertical displacement and the
24
force acting on the spreader plate for each load increment was estimated. Hence, load versus
25
displacement relationships were determined for the panel. Convergence tests were carried out
26
loading condition was achieved (in the present case it is equal to 0.756 mm/sec). Fig. 15
1
compares the UDEC against the results obtained from the experiment. Fig. 15 shows the failure
2
mode of the tuff masonry wall panel as predicted from UDEC. Also, Fig. 16 compares the load
3
displacement curves obtained from UDEC against those from the experiments. The results
4
predicted from UDEC (Fig. 16) are higher than those achieved experimentally. The
5
experimental tests have shown that the brittle nonlinear behaviour of the blocks strongly
6
influences and limits the performance of the wall panel. On the other hand, according to [22]
7
due to the constant-strain triangular elements meshing, an overestimation of the collapse load,
8
when using the block plasticity model, is expected in UDEC. Therefore, numerical and
9
experimental curves are different mainly because, in this case, UDEC is not sufficiently
10
accurate in predicting the brick nonlinear behaviour. Furthermore, such overestimation of the
11
block failure load limits the effects of the different widths (out of plane dimension) of the joints.
12
In Fig. 16 the curves of the panels W1, W2 and W3 remarks such aspect.
13
CONCLUSIONS
14
An evaluation of the suitability of FEM and DEM approaches to analyse the behaviour of low
15
strength masonry has been conducted. The approaches have been validated by means of two
16
case-studies. In particular, numerical FEM and DEM outcomes and experimental results, for
17
different low strength masonries have been compared. The main purpose of the current study
18
was to give a contribution to the knowledge and selection of the more reliable approach to study
19
this kind of structures. The analyses have shown that, for low bond strength masonry, where the
20
emphasis is on joint behaviour, DEM approaches perform better. Since the bricks are highly
21
stronger than the mortar, the nonlinear behaviour of the bricks does not have a great influence
22
on the global results. Moreover the small displacement assumption could not be always satisfied
23
and the rocking effect could be crucial. In these conditions the use of a refined plasticity model,
24
for the bricks, became less significant, while a large displacement assumption could become
25
necessary. Then the DEM approach is more reliable, in particular to predict the behaviour till
26
approaches are good to model the behaviour until the first crack though. In the case of low unit
1
strength masonry, the FEM approach is more reliable. In the considered case study, by means of
2
the FEM modelling, the experimental behaviour in terms of first crack, trend, failure and
3
smeared crack pattern has been simulated. Conversely the DEM model was not able to catch the
4
experimental behaviour. In the case of the low unit strength masonry, indeed, a refined and
5
reliable plasticity (and cracking model) for both the brick and the mortar, is crucial. In
6
conclusion, despite the larger number of parameters required for the modelling, the FEM
7
approach is a good choice for the low unit strength masonry. On the other hand, DEM is the
8
preferable approach for the low bond strength masonry and, apparently, less parameters are
9
needed for the modelling. It is not trivial to achieve those parameters, even performing specific
10
tests. Therefore, often, optimization analysis is needed to obtain reliable mechanical parameters.
11
Neither the FEM nor the DEM approach could be considered “reliable in every case”. At the
12
micro scale, careful validation as well as a sensitivity analysis of the influence of parameters
13
and calibration of the model are always required.
14
ACKNOWLEDEGMENT
15
Part of the work presented in this paper is supported by an EPSRC Comparative Award in
16
Science and Engineering (CASE/CAN/07/22) and Bersche-Rolt Ltd. Particular thanks are due
17
to Bersche-Rolt Ltd for providing experimental data of the masonry wall panels with openings.
18
Part of the analyses were developed within the activities of Rete dei Laboratori Universitari di
19
Ingegneria Sismica – ReLUIS for the research program funded by the Dipartimento di
20
Protezione Civile – Progetto Esecutivo 2010-2013.
21
22
REFERENCES
23
[1] Heyman J. Structural analysis: a historical approach. Cambridge: Cambridge University
24
Press; 1998.
25
[2] Lourenço P.B. Computations of historical masonry constructions. Prog. Struct. Engng Mater
26
[3] Baggio C, Trovalusci P. Stone assemblies under in-plane actions. Comparison between non
1
linear discrete approaches. Computer methods in structural masonry-3, Middleton J. and Pande
2
(Eds.), G. N., BIJ, Swansea (UK), 1995; 184-193.
3
[4] Thavalingam A, Bicanic N, Robinson JI, Ponniah DA. Computational framework for
4
discontinuous modelling of masonry arch bridges. Comput Struct 2001;79(19):1821-1830.
5
[5] Giordano A, Mele E, De Luca A. Modelling of historical masonry structures: comparison of
6
different approaches through a case study. Engineering Structures 2002; 24:1057-1069.
7
[6] Zhuge Y. Micro-modelling of masonry shear panels with distinct element approach.
8
Proceedings of the 17th Australian conference on the mechanics of structures and materials”,
9
Gold Coast, Australia, 2002; 131-136.
10
[7] Schlegel R, Rautenstrauch K. Failure analysis of masonry shear walls. In: Konietzky H.
11
editor. Numerical modelling of discrete materials in engineering, London: Taylor and Francis,
12
2004; p.33-42.
13
[8] Magenes G, Della Fontana A. Simplified non-linear seismic analysis of masonry buildings
14
Procedings of British Masonry Society, Vol. 8, International Masonry Society, Whyteleafe,
15
Surrey, United Kingdom, 1998; 190–195.
16
[9] Brencich A, Gambarotta L, Lagomarsino S. A macro-element approach to the
three-17
dimensional seismic analysis of masonry buildings. Procedings of 11th European Conf. on
18
Earthquake Engineering, Paris, France, 1998.
19
[10] Augenti N, Parisi F, Prota A, Manfredi G. In-plane lateral response of a full-scale masonry
20
sub-assemblage with and without an inorganic matrix-grid strengthening system. J Compos
21
Constr 2011; 15(4):578-590.
22
[11] Massart TJ, Peerlings RHJ, Geers MGD. Structural damage analysis of masonry walls
23
using computational homogenization. Intern J of Damage Mechanics 2007; 16(2):199-226.
24
[12] Lee J.S, Pande GN, Middleton J, Kralj B. Numerical modelling of brick masonry panels
25
subject to lateral loadings. Comput Struct 1996; 61:735-745.
26
plane laterally-loaded masonry walls with openings. Eng Struct 2013. 56:1234-1248. DOI:
1
/10.1016/j.engstruct.2013.06.041.
2
[14] Giamundo V, Lignola GP, Prota A, Manfredi G. Diagonal strength of adobe brick walls.
3
Proceedings of 8th International Conference on Structural Analysis of Historical Constructions,
4
SAHC 2012; Wroclaw, Poland.
5
[15] Page AW. Finite element model for masonry. J Struct Div 1978; 104(8):1267-1285.
6
[16] Lourenço PB, Computational strategies for masonry structures. Ph.D. thesis, Delft
7
University of Technology 1996; Delft, Netherlands.
8
[17] Parisi F, Lignola GP, Augenti N, Prota A, Manfredi G. Nonlinear behavior of a masonry
9
sub-assemblage before and after strengthening with inorganic matrix-grid composites. J
10
Compos Constr 2011; 15(5): 821-832.
11
[18] Lemos JV. Discrete element modelling of masonry structures. Int J of Arch herit 2007; 1:
12
90-213.
13
[19] Cundall PA. A computer model for simulating progressive large scale movements in
14
blocky rock systems. Proceedings of the Symposium of the International Society of Rock
15
Mechanics 1971; Nancy, France
16
[20] Toth AR, Orban Z, Bagi K. Discrete element analysis of a masonry arch. Mech Res
17
Commun 2009; 36(4):469-480.
18
[21] Sarhosis V. Computational modelling of low bond strength masonry. PhD thesis,
19
University of Leeds 2011; Leeds, UK.
20
[22] ITASC. UDEC - Universal Distinct Element Code Manual. Theory and Background. Itasca
21
Consulting Group 2004; Minneapolis, USA.
22
[23] Hendry AW. Structural masonry. 2nd Edition, London, UK: Palgrave Macmillan;1998.
23
[24] Van der Pluijm R. Material properties of masonry and its components under tension and
24
shear. Proceedings of the 6th Canadian Masonry Symposium. Saskatoon University of
25
Saskatchewan, Canada 1992; 675-686.
26
masonry under compression. Can J of Civ Eng 2007; 34(1):1475-1485.
1
[26] Toropov VV, Garrity SW. Material parameter identification for masonry constitutive
2
models. Proceedings of the 8th Canadian Masonry Symposium. Jasper, Alberta, Canada, 1998;
3
551-562.
4
[27] Sarhosis V, Sheng Y. Identification of material parameters for masonry constitutive
5
models. J of Eng Struct 2014; 60:100-110.
6
[28] DIANA Release 9.4 (Computer software). TNO DIANA BV. Delft, Netherlands.
7
[29] Lignola GP, Prota A, Manfredi G. Nonlinear analyses of tuff masonry walls strengthened
8
with cementitious matrix-grid composites. J Compos Constr 2009; 13(4):243-251.
9
[30] Lignola GP, Prota A, Manfredi G. Numerical investigation on the influence of FRP retrofit
10
layout and geometry on the in-plane behavior of masonry walls. J Compos Constr 2012;
11
16(6):712-723.
12
[31] Zienkiewicz O, Taylor R, Zhu J. The Finite Element Method, Its Basis and Fundamentals,
13
6th edition, Oxford, UK: Elsevier; 2005.
14
[32] Dhanasekar M, Page AW. Influence of brick masonry infill properties on the behaviour of
15
infilled frames. Proceedings of Inst Civ Eng Struct Build 1986; 81:593-605.
16
[33] Ali SS, Page AW. Finite element model for masonry subjected to concentrated loads. J of
17
Struct Eng 1988; 114(8):1761-1784.
18
[34] Page AW. A model for the in-plane behaviour of masonry and sensitivity analyses of its
19
critical parameters. Proceedings of 5th Int. Brick Masonry Conference, Brick Inst of America,
20
1979; 262-267.
21
[35] American Society for Testing Materials (ASTM). Standard test method for diagonal
22
tension (shear) in masonry assemblages. 1981; ASTM E 519-81.
23
[36] Prota A, Marcari G, Fabbrocino G, Manfredi G, Aldea C. Experimental in-plane behavior
24
of tuff masonry strengthened with cementitious matrix-grid composites. J Compos Constr 2006;
25
Table 1. Masonry wall panel test results
Panel ID Load at first visible crack [KN]
Failure load [KN]
S1 0.72 3.69
S2 1.60 4.60
S3 1.60 5.10
S4 1.71 5.67
Table
Table 2 Material properties used in UDEC for clay brick masonry
Joint normal stiffness (JKn)
[GPa/m]
Joint shear stiffness (JKs)
[GPa/m]
Angle of friction (Jfric)
[degrees]
Joint cohesive strength (Jcoh)
[MPa]
Joint tensile strength (Jten)
[MPa]
Joint dilation angle (Jdil)
[degrees]
Table 3 Material properties for clay brick masonry used in DIANA
Material E [MPa]
fc
[MPa]
ft
[MPa]
Gc
[MPa mm]
Gt
[MPa mm]
Mortar 111.41 0.6 0.05 2.28E-01 1.59E-03
Table 4 Comparison of experimental against numerical results for first cracking as obtained from
DIANA
Panel ID First crack load [kN]
First crack deflection [mm]
S1 1.60 0.15
S2 1.60 0.10
S3 1.71 0.12
S4 0.72 0.08
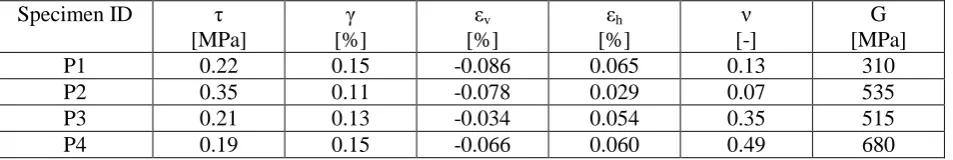
[image:25.595.67.532.146.241.2]Table 5 Main test results for low unit strength masonry wall panels
Specimen ID
[MPa] [%]
v
[%]
h
[%] [-]
G [MPa]
P1 0.22 0.15 -0.086 0.065 0.13 310
P2 0.35 0.11 -0.078 0.029 0.07 535
P3 0.21 0.13 -0.034 0.054 0.35 515
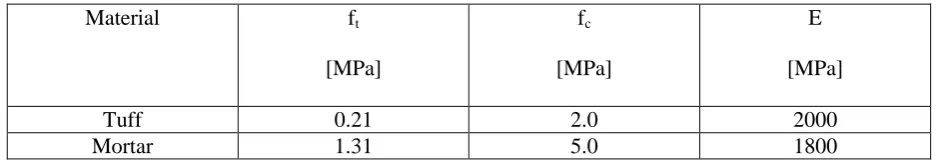
Table 6 Material properties for low unit strength masonry wall panels used in DIANA
Material ft
[MPa]
fc
[MPa]
E
[MPa]
Tuff 0.21 2.0 2000
Table 7 Test matrix for low unit strength masonry wall panels used in DIANA to account for
workmanship defects
Panel ID (numerical) Mortar joints width [mm]
W1 125
W2 185
[image:28.595.190.409.147.213.2]Table 8 Material properties for the tuff masonry blocks used in UDEC
Density [Kg/m3]
E [MPa]
G [MPa]
Bulk Modulus
[MPa] [-]
ft
[MPa]
fc
[MPa]
Table 9 Material properties for the interface of the tuff masonry used in UDEC
JKn [GPa/m]
JKs [GPa/m]
Jfric [degrees]
Jcoh [MPa]
Jten [MPa]
Fig. 1 Typical low bond strength masonry wall panel with 2.025m span opening tested in the
[image:31.595.75.442.375.508.2]laboratory
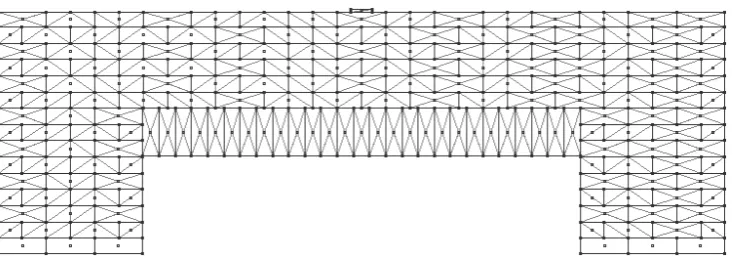
Fig. 2. UDEC geometric model of a masonry wall panel with a 2.025m opening
Soldier course (225mm) Applied Load
6 courses (450mm)
6 courses (450mm)
665m 2,025 mm clear opening 665m
Figure
0.0
0.5
1.0
1.5
2.0
2.5
3.0
3.5
4.0
4.5
5.0
0.0 0.5 1.0 1.5 2.0 2.5 3.0 3.5 4.0 4.5 5.0 5.5 6.0 6.5 7.0
Load (kN)
Displacement (mm)
S1
S2
S3
S4
UDEC
S2
S4
S1
S3
[image:32.595.80.515.125.450.2]UDEC
Fig. 6. Details of the adopted fine mesh for the DIANA FEM model of the wall panel (note that the
0.0 1.0 2.0 3.0 4.0 5.0
0.0 0.3 0.5 0.8 1.0 1.3 1.5
Load (kN)
Displacement (mm)
S1
S2
S3
S4
DIANA
S4 W1
P4
[image:37.595.80.500.101.381.2]S1 DIANA
a) Panel P2 b) Panel P4
0.0 0.1 0.1 0.2 0.2 0.3 0.3 0.4 0.4
0.0 0.1 0.2 0.3 0.4 0.5 0.6
Shear
s
tr
ess
[
MPa]
Shear strain
[%]
P1
P2
P3
P4
W1 (DIANA)
W2 (DIANA)
W3 (DIANA) W2
P3 P2
W3
P4 P1
W1
Figure 13. Comparison of experimental against numerical results as obtained from DIANA
[image:42.595.82.519.103.380.2]a) Full joint (W3) b) Partial joint (W1, W2)
0.0 0.1 0.2 0.3 0.4 0.5 0.6 0.7
0.0 0.1 0.2 0.3 0.4 0.5 0.6
Shear
st
ress
[
MPa]
Shear strain
[%]
P1
P2
P3
P4
W1 (UDEC)
W2 (UDEC)
W3 (UDEC) P2
P1
P3
P4 W1
[image:45.595.82.501.101.380.2]W2 W3