A National Statistics publication
National Statistics are produced to high professional standards set out in the National Statistics Code of Practice.
Quality and Methodology Information
16-18 attainment in schools and colleges in England
Date 29 January 2015
Coverage England
Theme Children, Education and Skills
Issued by Department for Education, Sanctuary Buildings, Great Smith Street, London SW1P 3BT
Press office 020 7783 8300
Public enquiries 0370 000 2288
Statistician Christopher Casanovas
Email [email protected] Internet 16 to 19 attainment statistics
Contents
1. Introduction ... 2
2. About the data ... 2
3. Data coverage ... 2
4. Data sources ... 4
5. Relevance to key users ... 5
6. Timeliness and punctuality ... 6
7. How the output is created... 8
8. Accuracy of the data ... 10
9. Reliability ... 12
10. Accessibility and Clarity... 13
11. Coherence and comparability ... 14
12. Got a query? Like to give feedback? ... 15
Annex A: Further detail on school types ... 16
Annex B: Process map ... 19
Annex C: Example performance tables tariff points ... 20
Annex D: Grading structure used for average grade ... 21
1.
Introduction
This document provides an overview of the data used in the production of the ‘A level and other level 3 results’ statistical first releases (SFRs) and the 16-18 performance tables. It describes the methodology used to calculate student attainment in these publications. It provides information on the data sources, coverage, quality and how the data is validated and processed. The content is based on the Office for National Statistics’ guidelines for measuring statistical quality.
2.
About the data
The A level and other level 3 results (provisional) SFR is published in October, and the revised release is published in January. Links to the releases are below.
Current and historical statistics can be found here: 16- 18 statistics
School and college level information for 16-18 students can be found on the performance tables website:
Performance tables
3.
Data coverage
This section explains the scope and coverage of the data. It outlines the criteria for how we determine which students and qualifications are reported in the SFR and 16-18 performance tables.
Age range of students
The age range of students is restricted to 16 to 18 year old students. These students will be at the end of their final year of study typically lasting two years (often referred to as ‘being at the end of key stage 5’ or KS5) in schools and colleges in England.
Qualifications reported
Results reported only cover level 3 academic and vocational qualifications approved under
Section 96 of the Learning and Skills Act (2000). Other qualifications or learning provision such as level 2 qualifications or work-based learning are not included.
A level, academic and vocational cohorts
The data is broken down into the following student cohort types:
1. A level cohort: students entered for at least one A level, applied single award A level or applied double award A level in the 2013/14 academic year
qualification1 in the 2013/14 academic year. The Academic cohort includes A level
cohort students.
3. Vocational cohort: students entered for a substantial2 advanced level vocational
qualification3 in the 2013/14 academic year.
Criteria used to include students
Students will be eligible to be reported in the 2014 16 to 18 performance tables if they satisfy the following criteria:
1. Were aged 16, 17 or 18 on 31 August 2013 2. Were on roll in January 2014
3. Were in, or deemed to be in, Year 13
4. Completed their advanced studies in the 2013/14 academic year 5. Entered for at least one substantial level 3 qualification
A similar set of ‘inclusion’ criteria are also used in the SFR. Tables 1a-e; 12a and 12b show cumulative results obtained by level 3 16-18 students.
Institutions reported
The performance of schools and colleges are in scope for reporting purposes but other education and training provider types are not, such as independent training providers (see
annex A for further information).
Institution status
The date of 12 September 2013 is being used to determine the status of a school or college. Any schools or colleges which converted to an academy on or before this date have been published as an academy and those that have converted after this date have been treated as their predecessor school type.
Future changes
From 2016, the 16-18 performance tables will be expanded to provide a more comprehensive view of institution performance. They will cover a broader range of learning providers, type and level of qualifications, and other aspects of achievement aside from attainment and progress. The future headline measures will focus on progress, attainment, progress towards GCSE English and maths, student retention rates and destinations.
At present, the 16-18 performance tables report some contextual information alongside performance measures. This includes student cohort information and measures that take account of prior attainment. In the future, as part of the 16-19 accountability reforms, more contextual information will be included which will recognise all ability learners and those who are from disadvantaged backgrounds.
1
Level 3 academic qualifications include GCE A level, AS level, Free Standing Maths Qualifications, International Baccalaureate, Pre-U, Advanced Extension Awards, AQA Baccalaureate and Extended Projects.
2
A ‘substantial’ level 3 academic or vocational qualification is a qualification that is the size of an A level (180 guided learning hours per year).
Further information on the accountability reforms can be found in the government response to the 16-19 accountability consultation at: 16-19 accountability consultation
And technical information on the headline measures can be found: 16-19 accountability headline measures technical guide
4.
Data sources
This section outlines the sources of the data that are used to calculate the performance measures. This information should help users evaluate whether the data contained within the SFR and 16-18 performance tables are relevant to them.
Data sources in scope
16-18 datasets are compiled using information matched together from four main data sources: i. Level 3 qualification entries and results collected from awarding organisations by the
department’s contractor
The key strength of the data is that it is derived from administrative data from awarding organisations. This means that data can be shown accurately at institution level. Pupil level data from key stage 4 can also be merged with 16-18 data so that we can produce precise measures of progress between key stage 4 and 5. For further information on the accuracy of the data see the section on accuracy (see section 8).
ii. School Census records
The school census collects information about individual pupils and about the schools. Census data allows the Department to publish statistics by gender, as well as by school characteristics. The following school types participate in the census.
Local authority-maintained schools: community, foundation, voluntary-aided
voluntary-controlled schools, Pupil referral units (PRUs) and special schools (including hospital schools)
Academies, including alternative provision (AP) academies
Free schools, including AP free schools
Studio schools
University Technical Colleges (UTCs)
Non-maintained special schools
More detail is available from the following link: school census guidance iii. Key stage 4 performance tables data (prior attainment information) Key stage 4 use the following sources of data:
Prior attainment records (key stage 2 results);
School Census records; and
Qualification entries and results collected from awarding bodies
iv. Edubase
EduBase is a register of educational establishments in England and Wales, maintained by the Department for Education. It provides information on establishments providing compulsory, higher and further education. More information on Edubase is available at the following link:
edubase guidance
Data sources out of scope
The individual learner record (ILR) administrative data is not used for the purposes of the SFR and 16-18 performance tables. This is an equivalent dataset to the school census but includes information on colleges and other learning providers. The lack of this data within our publication means we are unable to identify students on roll at colleges and whether they are full-time or part-time. We rely on gaining this information through awarding organisation data and by colleges checking their data prior to final publication. A very high proportion of colleges check their data in this way (approximately 85 per cent).
5.
Relevance to key users
This section outlines the key users of the SFR and performance table statistics, and how the statistics meet the needs of those users.
Department for Education
Used to monitor national standards of 16-18 attainment in England. The national figures are used to determine whether standards are improving or declining.
Institution level figures are used to identify institutions where intervention may be needed to bring standards up to an acceptable level.
Ofsted Used as part of the background information to inform school and college inspections.
Ofqual Used as part of the evidence it reviews on the setting and maintenance of standards in national assessments.
Local authorities National data and that for other LAs used to set the attainment of their area into context.
Institution level information used to hold maintained schools and colleges to account.
Schools and colleges Used to evaluate their own performance against national standards and other local schools and colleges.
Used to identify high performing institutions that they can work with to improve their own standards.
Teachers and head teachers/principals
Used to carry out analysis and self-evaluation, and to aid planning of school/college improvement strategies.
Information used to inform decisions about whether to apply for vacancies in particular schools or colleges and also as background information when preparing for interviews.
Parents Used to compare their own children’s performance to others in their school or college, LA and nationally.
Used to hold their children’s schools and colleges to account and identify areas where improvement is needed.
Used to inform choice of a school sixth form or college.
Performance of schools and colleges in the local area is also a key consideration for parents and prospective parents when moving house.
Others Researchers from this country and abroad. Others use the information to identify schools and colleges with particular levels of attainment that they may wish to market their services to.
6.
Timeliness and punctuality
This section describes the timelines used to produce the SFR and information on how DfE announce the publication dates.
Timeliness of data
The timetable for delivering the SFR and performance tables is shown below.
May and June
Main A level and AS level examinations taken.
July and August
The Joint Council for Qualifications (JCQ) collects results data from the awarding bodies. JCQ publish A level and AS level results in mid-August.
The department’s contractor collects attainment data from awarding bodies (data is collected throughout the year but the majority is collected in the summer).
September
The department receives unamended attainment (provisional) data from the contractor.
The schools and colleges performance tables checking exercise takes place in late September/early October providing schools and colleges with the opportunity to check and, where necessary, amend their results. In addition, institutions such as colleges which do not complete the school census can check that students assigned to them are on roll.
October to December
The department publishes the provisional A level and other level 3 results SFR in mid-October based on unamended data.
Amendment requests from schools and colleges are scrutinised following the checking exercise. The department receives three sets of revised data during November and December, which take account of changes made during the checking exercise, and any further results.
January
The department publishes the revised A level and other level 3 results SFR and the 16-18 performance tables, based on the third revised version of the data.
February
Post errata period commences for schools and colleges. This provides a further opportunity to request additional amendments to the data.
March
Punctuality of the release
The proposed month of publication for the SFR and performance tables is announced on gov.uk
website at least twelve months in advance. The precise dates are announced in the same place at least four weeks prior to publication. In the event of a change to the pre-announced release schedule, the change and the reasons for it would be announced.
7.
How the output is created
This section explains how we produce the statistics required for the SFR and performance tables.
Derived variables
A large number of variables published within the SFR and performance tables are calculated by the Department for Education. The methodology used to calculate the variables can be found in the metadata section of the performance tables website, available at Performance Tables metadata. Key indicators are also summarised below.
A level AAB indicators
There are three ‘AAB’ variables published in this SFR for A level cohort students (see tables 1a, 1c, 12a, 12b):
1. The percentage of students achieving grades AAB or better at A level, applied single award A level or applied double award A level = the number of students achieving grades AAB or better at A level, applied single A level or applied double award A level / number of students entered for at least one A level, applied single A level or applied double award A level
2. The percentage of students achieving grades AAB or better at A level, of which at least two are in facilitating subjects = the number of students achieving grades AAB or better at A level of which at least two are in facilitating subjects / number of students entered for at least one A level, applied single A level or applied double award A level
3. The percentage of students achieving grades AAB or better at A level, all of which are in facilitating subjects = the number of students achieving grades AAB or better at A level all of which are facilitating subjects / number of students entered for at least one A level, applied single A level or applied double award A level
Facilitating subjects cover biology, chemistry, physics, mathematics, further mathematics, geography, history, English literature, modern and classical languages. A full list of facilitating subjects is available here: Facilitating subjects for the AAB indicator.
The 2014 performance tables report only the percentage of students achieving grades AAB or better at A level, of which at least two are in facilitating subjects.
Average point score
This SFR reports average point score indicators for the A level, academic and vocational cohorts. The indicators include: average point score per entry and average point score per full-time equivalent student. These indicators were reported for the first full-time in 2013.
used to calculate these indicators is available in the performance tables technical guides and documents.
The average point score per entry is assigned an indicative grade based on the average point score band rules set out in Annex D. The average grade per A level and academic entry is reported in terms of grades A* to E. Table D1 presents the relevant point score bands for A levels and academic qualifications. While the average grade per vocational entry is reported in terms of BTEC Subsidiary Diploma (level 3) grades. Table D2 presents the relevant point score bands for vocational qualifications
Other methodologies
Other methodologies are applied in the production of the data which are summarised below.
Discounting
A technique called discounting is used to avoid double counting of qualifications. This is used when a student takes two or more qualifications in the same subject area and where there is significant content overlap. For example, where a student has gained an AS en route to an A level in the same subject, only the A level result will count (i.e. the AS is ‘discounted’ as it is part of the A level). However, if a student fails to obtain a pass grade at A level, the AS pass grade would be reported.
By applying discounting, the number of examination entries and results is underestimated for the reporting year in this SFR. In order to show the effect of AS discounting, this SFR shows two sets of AS tables, one with discounting applied (Table 3) and one which shows the discounted AS entries (Table 4).
In addition to discounting, the number of AS examination entries and results is also affected by whether an AS entry is claimed or ‘cashed-in’ on completion with the examination board. If an AS is not cashed-in then it will not appear in the figures presented in this SFR. For this reason, entry data presented in Table 4 should not be taken as a measure of participation. The Department for Education SFR ‘Participation in Education, Training and Employment by 16 to 18
Year Olds in England’ should be consulted for participation data.
A DfE analysis paper investigating the impact of discounting and ‘cashing-in’ was published with SFR27/2011 and is provided in the ‘Additional text’ document at:
Provisional GCE or applied GCE A and AS and equivalent examination results in England: academic year 2010 to 2011
Deferring students
As part of the performance tables checking exercise, schools and colleges can manually defer students in year 13 if they have not completed their 16-18 study. Students deferred in 2013 have been automatically ‘added’ back and included in the 2014 data. This practice will continue going forward and is consistent with key stage 4 performance tables’ policy.
Performance tables’ qualifications tariff
Other approved qualifications at Level 3 and their point scores can be found on the Ofqual Register website.
8.
Accuracy of the data
This section describes the quality control measures which ensure the data is of high quality.
Examinations and marking
The validity of examination results is assured through a number of measures outlined below. Clear guidance is provided to schools and colleges regarding the administration of advanced level examinations, including instructions for keeping the exam materials secure prior to the exams and storage of completed scripts until they are collected for marking.
Once schools and colleges have completed their advanced level exams they are required to send their exam materials and attendance registers to the awarding organisations for external marking and data capture.
The exam papers are externally marked by the awarding organisations to ensure that marking is consistent between institutions. There are no quotas set or underlying assumptions about the proportion of students who should be at each grade. Proportions are decided entirely by how student attainment measures up to the exam standards.
After marking, results are returned to schools and colleges. In 2014 this was 14 August. Data is then passed from the awarding organisations to the department’s contractor for use in the statistical first releases and 16-18 performance tables. If schools and colleges have concerns over the marking of an exam paper, they may request for it to be re-marked. Outcomes of reviews are not reflected in the provisional SFR data but are included in the revised data and
performance tables.
Further information on the general regulations for schools and colleges and how exams are conducted/marked can be found on the JCQ website: Joint Council for Qualifications (JCQ) website
Qualifications
Ofqual sets the standards and rules that awarding organisations need to meet when they design, deliver and award regulated qualifications. They monitor awarding organisations and qualifications to maintain standards. They are a risk-based regulator and concentrate their resources on where they are most needed. For example, they may discover that an awarding organisation’s processes need updating or that there are risks connected to a qualification taken by thousands of students every year. Further guidance on the role of Ofqual can be found at:
How Ofqual regulate
School and college checking exercise
September/October. Schools and colleges are required to check the data and notify the department of any students that are included in their school in error, or of any missing students. They can also notify us of any other errors in the data such as errors in matching prior attainment results. Any changes requested are validated to ensure that they comply with the rules before being accepted. Overall, approximately 60 per cent of schools and colleges check their data during this process.
Following the checking exercise the revised data is supplied to the department through our contractors. This data takes account of changes requested during the checking exercise, including successful marking reviews, late results and changes to number of students on roll. The data is then published in the revised SFR and in the 16-18 performance tables in January. Following publication of the performance tables, some schools and colleges notify us of further changes required to the data. These changes are validated in the same way as those which are received during the checking exercise and final data is produced in March in the performance tables but is not updated in the SFR.
Departmental quality assurance
Internal quality protocols are also applied by the Department for Education. First, the school and college checking exercise process is subject to a ‘dry run’ during the summer. This involves producing a dummy dataset, from the previous year’s dataset, which conforms to how the current year’s data will be supplied (e.g. if new subjects have been introduced, then dummy data would be added to last year’s data to simulate these). This dummy dataset is used to test the contractor’s systems and the department’s checking processes. This allows potential problems to be resolved prior to the receipt of the live data.
In addition, at every stage in the data cycle, the department checks all calculations used in the production of the figures by independently dual-running the methodologies at institution, local authority and national level. Further quality assurance is then carried out on the data produced (see examples below). Any discrepancies in the data are discussed and resolved prior to publication.
Examples of further quality assurance:
Comparisons with previous years’ figures to identify any large unexpected changes Comparisons with provisional data to identify any large changes (revised/final data only) Check totals are consistent across tables
Check patterns in the data (e.g. expected differences between subjects, high/low performing local authorities)
9.
Reliability
This section outlines the changes between the provisional, revised and final versions of the data. It also explains the comparability between the SFR and performance tables and how the statistics have changed during the time series available.
Change between releases
16-18 attainment data is subject to change between provisional and revised data, amendments can include:
late results
outcomes of the appeals process where schools and colleges ask for reviews for one or more of their students in the belief that a clerical error has been made or the mark scheme has not been correctly applied
changes resulting from requests from schools and colleges to defer students who are continuing with their advanced level studies
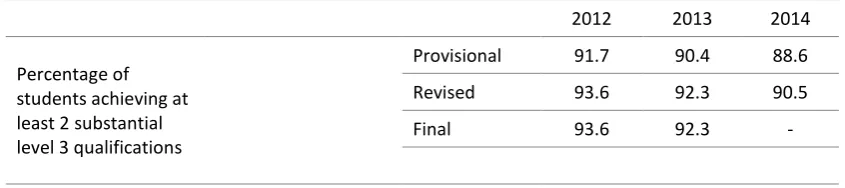
[image:12.595.61.484.414.508.2]Over the past three years, national indicators changed by nearly two percentage points between provisional and revised data. Table 1 shows the change in the percentage of students achieving at least two substantial level 3 qualifications at national level over the last three years. Changes in national, LA and institution level data between revised and final data are typically small.
Table 1: Changes in national 16-18 data
2012 2013 2014
Percentage of students achieving at least 2 substantial level 3 qualifications
Provisional 91.7 90.4 88.6
Revised 93.6 92.3 90.5
Final 93.6 92.3 -
There can be more variability in the data at school and college level between provisional and revised data. As a result, school and college level results based on provisional data are not published.
Comparability of SFR and performance tables
The majority of the data published within the SFR and performance tables are the same. Both publish data on cumulative results for students at the end of their 16-18 study. The same methodology is used in both so national and LA figures will match. The SFR also contains additional data based on a single year of academic study (tables 2-11), which is not published within the performance tables.
Changes over time
There have been some changes to 16-18 attainment data which can make comparisons over time difficult. These changes are listed in Annex E. In order to provide a historical context of attainment introduced for the first time in 2012/13 a supplementary table (table S1) showing average point score by cohort since 2008/09 has been included.
Impact of new ‘add back’ functionality
As part of the performance tables checking exercise, the department shares student level attainment data with schools and colleges. Institutions are able to request that their students’ results are deferred from the performance tables by one year if they have not reached the end of 16-18 study. The following year, these students should be added back into institution figures to count towards that year’s results, regardless of whether they have achieved any further results. This is the first year that students have been added back automatically. This will become standard practice from now on. In addition, from this year a student cannot be deferred at academic age 18 as they will be outside the scope of performance tables the following year. This is consistent with key stage 4 performance tables policy.
Analysis shows that this change has had little impact on level 3 attainment at a national level. The average point score per entry across all level 3 qualifications is 214.6 (table 1a); when the add-back students are removed the average point score per entry is 214.7. The majority (75.8 per cent) of add back students were in the FE sector (excluding sixth form colleges), of which 89.0 per cent were on a vocational programme. The adding-back of students deferred last year has lowered the average point score per entry across all level 3 qualifications for this sector by 0.2 points, from 206.1 to 205.9.
10.
Accessibility and Clarity
This section explains how we ensure the statistics are accessible. It also describes the publication formats and disclosure policy.
SFR accessibility
The SFR is published at 16-19 statistics attainment. The text is published in pdf format so that it is accessible to all users irrespective of their choice of software. Care is also taken to ensure that the document meets accessibility guidelines. Key figures are highlighted in the SFR text which draws out the main messages such as changes over time and differences between groups of students. Small tables or charts illustrating key figures are also included in the text.
Performance tables accessibility
The performance tables website provides a number of ways to search for schools or colleges of interest (e.g. by name of school, by town, within x miles of a postcode or all schools within a LA) and presents the data in a series of web pages showing different aspects of the data. The selected schools and colleges are shown in alphabetical order by default but can be sorted by any indicator if the user requires ranked data.
Any user wishing to conduct more detailed research or analysis may request an anonymised pupil/student level extract of the national pupil database (NPD).
Disclosure Control
The Code of Practice for Official Statistics requires us to take reasonable steps to ensure that our published or disseminated statistics protect confidentiality.
In the SFRs, an ‘x’ indicates that a figure has been suppressed due to small numbers. Values of 1 or 2 or a percentage based on 1 or 2 students are suppressed. Some additional figures have been suppressed to prevent the possibility of a suppressed figure being revealed. This suppression is consistent with the departmental statistical policy on confidentiality.
In the performance tables any figures relating to a cohort of 5 students or fewer will be suppressed.
11.
Coherence and comparability
Similar statistics are also published by the Department for Education and other organisations. There are key differences to note, which have been summarised below.
Joint Council for Qualifications (JCQ)
The figures in these tables differ from those published by JCQ in August 2014. JCQ figures relate to the outcome of all students in England, Wales and Northern Ireland, regardless of their age. The examination results published in this SFR are for the 2013/14 academic year and include the performance of students aged 16, 17 or 18 taking these examinations in England only.
Wider UK education data
The Welsh Government has published the results of external examinations taken by students aged 15 or 17 in 2013/14, available at:
Welsh government statistics and research
The Department for Education Northern Ireland (DENI) publishes AS and A level headline statistics here:
Department for Education Northern Ireland (DENI)
The publication, ‘Summary statistics for attainment, leaver destinations and healthy living, No. 4: 2014
Edition’,is published by the Scottish Government and is available at:
Other statistics from the Department for Education
The statistics shown below are produced by the Department for Education but provide different information to what is published in the 16-18 SFR and performance tables.
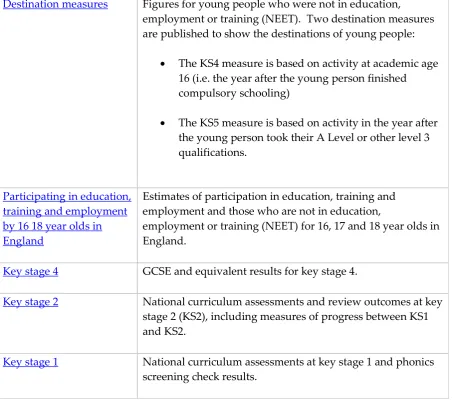
Destination measures Figures for young people who were not in education,
employment or training (NEET). Two destination measures are published to show the destinations of young people:
The KS4 measure is based on activity at academic age 16 (i.e. the year after the young person finished compulsory schooling)
The KS5 measure is based on activity in the year after the young person took their A Level or other level 3 qualifications.
Participating in education, training and employment by 16 18 year olds in England
Estimates of participation in education, training and employment and those who are not in education,
employment or training (NEET) for 16, 17 and 18 year olds in England.
Key stage 4 GCSE and equivalent results for key stage 4.
Key stage 2 National curriculum assessments and review outcomes at key stage 2 (KS2), including measures of progress between KS1 and KS2.
Key stage 1 National curriculum assessments at key stage 1 and phonics screening check results.
12.
Got a query? Like to give feedback?
If you are from the media
Press Office News Desk, Department for Education, Sanctuary Buildings, Great Smith Street, London SW1P 3BT.
Telephone Number: 020 7783 8300
If you are non-media Christopher Casanovas, Education Data Division, Department for Education, Sanctuary Buildings, Great Smith Street,
London SW1P 3BT.
[image:15.595.61.516.120.522.2]Annex A: Further detail on school types
This section shows the school type data we receive from Edubase. More information can be found at the following link: edubase guidance
School Admission Basis
The school admission basis is taken from Edubase. Schools are classified as per their status on 11 September. They are defined as follows:
Comprehensive schools Takes all pupils, usually regardless of their ability, aptitude or whether they have been selected for a place at a selective school. Includes school operating pupils banding admission arrangements.
Modern schools Takes pupils regardless of their ability or aptitude, including those who have not been selected for a place at a local selective school.
Selective schools Admits pupils wholly or mainly with reference to ability. These schools are formally designated as grammar schools.
Institution Type
The institution types are taken from Edubase and are given at 11 September at the start of the academic year. They are defined as follows:
Academy Sponsor Led Sponsored academies are all-ability, state-funded schools established and managed by sponsors from a wide range of backgrounds, including high performing schools and colleges, universities, individual philanthropists, businesses, the voluntary sector, and the faith communities.
Academy Converter Schools that have chosen through Governing Body Resolution and application to the Secretary of State to become an academy under the Academies Act 2010.
Free School Free Schools are all-ability state-funded schools set up in response to what local people say they want and need in order to improve education for children in their community. They have the same legal requirements as academies and have the same freedoms and flexibilities.
Further Education (FE) colleges
Studio School Studio schools are all-ability and mixed sex state funded schools, independent of local authorities. They are an innovative new model of educational provision, delivering mainstream qualifications through practical project-based learning. They are not extensions or conversions from existing provision, but are new 14-19 academies, typically with around 300 pupils.
University Technical College (UTC)
UTCs are all-ability and mixed sex state funded schools, independent of local authorities. They are not extensions of or conversions from existing provision, but new 14-19 Academies, typically with 500-800 pupils. UTCs specialise in subjects that need modern, technical, industry-standard equipment, such as engineering and construction, and teach these disciplines alongside business skills and a broad, general education. Pupils integrate academic study with practical learning, studying core GCSEs alongside technical qualifications.
City Technology College Independent all-ability, non-fee-paying schools offering students and pupils the opportunity to study a curriculum geared, with the help of private sector sponsors, towards the world of work.
LA maintained school Schools fully or partially under LA control that are state-funded, mainly by the Dedicated Schools Grant. These include community schools, foundation schools, voluntary aided school and voluntary controlled schools and also LA maintained special schools.
Registered
independent school
Any school which provides full time education for 5 or more students which is not state-funded or a non-state-funded special school.
Independent special school
Approved by the Secretary of State for Education. They are run on a not-for-profit basis by charitable trusts and normally cater for children with severe and/or low incidence special educational needs. This group includes non-maintained special schools.
State-funded school Includes LA maintained schools, academies, free schools, city technology colleges and state-funded special schools (excluding hospital schools, pupil referral units, alternative provision and independent schools).
State-funded mainstream schools
Includes LA maintained mainstream schools, academies, free schools, city technology colleges (excluding all special schools, pupil referral units, alternative provision and independent schools).
State-funded special schools
Includes LA maintained special schools, academy sponsor led special schools, academy special schools and special free schools.
Annex C: Example performance tables tariff points
Advanced Free Standing Maths
Grade Size Points A 0.17 45 B 0.17 40 C 0.17 35 D 0.17 30 E 0.17 25
Advanced Extension Award
Grade Size Points D 0 27 M 0 23
Level 3 Key Skill
Grade Size Points P 0.3 63
GCE/Applied A level
Grade Size Points A* 1 300
A 1 270 B 1 240 C 1 210 D 1 180 E 1 150
GCE/Applied AS level
Grade Size Points A 0.5 135 B 0.5 120 C 0.5 105 D 0.5 90 E 0.5 75
GCE Applied Double Award
Grade Size Points A*A* 2 600
A*A 2 570 AA 2 540 AB 2 510 BB 2 480 BC 2 450 CC 2 420 CD 2 390 DD 2 360 DE 2 330 EE 2 300
BTEC Level 3 Diploma (QCF)
Grade Size Points D*D* 2 540
D*D 2 495 DD 2 450 DM 2 420 MM 2 390 MP 2 360 PP 2 330
BTEC Level 3 Subsidiary Diploma (QCF)
Grade Size Points D* 1 270
D 1 225 M 1 195 P 1 165
BTEC Level 3 Extended Diploma (QCF)
Grade Size Points D*D*D* 3 810
D*D*D 3 765 D*DD 3 720 DDD 3 675 DDM 3 645 DMM 3 615 MMM 3 585 MMP 3 555 MPP 3 525 PPP 3 495
International Baccalaureate Diploma
Annex D: Grading structure used for average grade
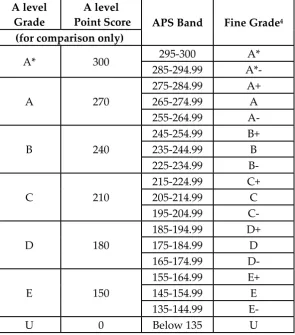
Table D1: Average grade per A level or other academic qualifications
4
Fine grades such as B-, B and B+ are assigned by evenly distributing the points and centring the points associated with the A level in the fine
A level Grade
A level
Point Score APS Band Fine Grade4
(for comparison only)
A* 300 295-300 A* 285-294.99 A*-
A 270
275-284.99 A+ 265-274.99 A 255-264.99 A-
B 240
245-254.99 B+ 235-244.99 B 225-234.99 B-
C 210
215-224.99 C+ 205-214.99 C 195-204.99 C-
D 180
185-194.99 D+ 175-184.99 D 165-174.99 D-
E 150
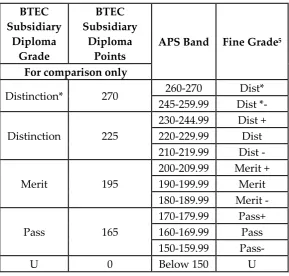
Table D2: Average grade per vocational qualification
BTEC Subsidiary
Diploma Grade
BTEC Subsidiary
Diploma Points
APS Band Fine Grade5
For comparison only
Distinction* 270 260-270 Dist* 245-259.99 Dist *-
Distinction 225
230-244.99 Dist + 220-229.99 Dist 210-219.99 Dist -
Merit 195
200-209.99 Merit + 190-199.99 Merit 180-189.99 Merit -
Pass 165
170-179.99 Pass+ 160-169.99 Pass 150-159.99 Pass- U 0 Below 150 U
5
Annex E: Timeline of changes to 16-18 qualifications and
performance measures
2009/10 New specification of A levels:
• Introduction of A* grade at A level
• Change from 6 to 4 units for most A-level subjects
• Introduction of 'stretch & challenge' elements in assessment
2010/11 New performance tables indicators:
• % attaining 3 or more A Levels at grades A*-E or equivalent • % attaining 2 or more A Levels at grades A*-E or equivalent • % attaining at least one Level 3 qualification
Performance tables extended to include finance, workforce and Ofsted inspection judgements
Ceased to report contextual value added in 16-18 tables.
More data published under transparency agenda showing school and college performance at individual subject level for every level 3 qualification.
2011/12 New performance tables indicators:
Level 3 Value Added6 scores for each main qualification type
• Students achieving three A levels at grades AAB, of which two are in “facilitating” subjects
• Introduced A level only indicators.
• Introduced A level and other academic ( eg. IB, Pre-U, AQA Bacc) indicators. Experimental Statistics published on attainment of Level 1 and Level 2 English and maths for students who did not achieve a GCSE grade C or above in these subjects by the end of Key Stage 4.
2012/13 New performance tables indicators:
Performance measures reported separately for academic and vocational cohorts
Removal of combined level 3 attainment measures at institution-level
Aggregate Level 3 Value Added scores introduced for academic and vocational cohorts.
Published an average point score per entry expressed as a grade for A level, academic and vocational cohorts to support interpretation.
Average point score per full time equivalent (FTE) student7.
Published 16 to 19 accountability consultation: Government Response September 2013
6 For more information please see:
http://www.education.gov.uk/schools/performance/archive/schools_05/sec4.shtml
7
2013/14 Changes to performance tables:
Ceased to report percentage of A level students achieving AAB in 3 facilitating subjects, following 16-19 accountability consultation.
Implemented a penalty add-back of students rule to capture all students in performance tables that are funded but may leave before being reported in performance tables.
Raising age of participation:
All young people are required to continue in education or training: • Until the end of the academic year in which they turn 17
• From summer 2015 this will be until their 18th birthday 16-19 accountability reforms:
© Crown copyright 2015
You may re-use this information (excluding logos) free of charge in any format or medium, under the terms of the Open Government Licence. To view this licence, visit Open Government Licence or e-mail:
Where we have identified any third party copyright information you will need to obtain permission from the copyright holders concerned.
Any enquiries regarding this publication should be sent to us at Christopher Casanovas, Education Data Division, Department for Education, Sanctuary Buildings, Great Smith Street, London SW1P 3BT
Tel: