The effects of ocean acidification and warming on the early life history stages of corals
159
0
0
Full text
(2) The effects of ocean acidification and warming on the early life history stages of corals. Thesis submitted by. Chia-Miin CHUA BSc (Hons) In January 2012. For the degree of Doctor of Philosophy in Marine Biology within the ARC Centre of Excellence for Coral Reef Studies and the School of Marine and Tropical Biology James Cook University Townsville Queensland Australia.
(3) Statement of Access I, the undersigned, the author of this thesis, understand that James Cook University will make it available for use within the University Library and via the Australian Digital Thesis Network for use elsewhere.. I understand that as an unpublished work this thesis has significant protection under the Copyright Act and I do not wish to put any further restrictions upon access to this thesis.. 23/01/2012 (Signature). (Date).
(4) Statement of Sources Declaration I declare that this thesis is my own work and has not been submitted in any form for another degree or diploma at my university or other institution of tertiary education. Information derived from the published or unpublished work of others has been acknowledged in the text and a list of references is given.. 23/01/2012 (Signature). (Date).
(5) Electronic copy declaration I, the undersigned, the author of this work, declare that the electronic copy of this thesis provided to the James Cook University library, is an accurate copy of the print thesis submitted, within the limits of the technology available.. 23/01/2012 (Signature). (Date).
(6) Statement on the contribution of others. Some of the chapters of this thesis are also manuscripts that have been submitted for publication in peer-reviewed journals or are in preparation for submission. Several researchers have made contributions to these manuscripts and it is necessary to recognise their contribution. Chapter 2 is a manuscript currently in review at 'Coral Reefs' and is co-authored by W. Leggat, A. Moya and A. H. Baird. Experiments for this manuscript were performed by CMC and AM. The statistical analyses were performed by CMC and AHB. AHB, AM and WL provided constructive comments in shaping the manuscript. All authors provided intellectual input into this manuscript. Chapter 3 is a manuscript currently in review at PLOS one and is co-authored by W. Leggat, A. Moya and A. H. Baird. AHB and WL provided ideas and helped to design the study. Experiments for this manuscript were performed by CMC and AM. The statistical analyses were performed by CMC and AHB. AHB, AM and WL provided constructive comments in shaping the manuscript. All authors provided intellectual input into this manuscript. Chapter 4 is a manuscript nearing submission and is co-authored by W. Leggat, A. Moya and A. H. Baird. Experiments for this manuscript were performed by CMC and AM. The statistical analyses were performed by CMC and AHB. AHB, AM and WL provided constructive comments in shaping the manuscript. All authors provided intellectual input into this manuscript..
(7) I was supported by a postgraduate scholarship from the Ministry of Higher Education of Malaysia. Funding from this study came from ARC grant to WL, ARC future fellow grant to AHB and GRS research scheme to CMC. Fieldwork assistance was provided by E. Woolsey, L. Huisman, G. Torda, P. Cross, S. Sprungla, D. Miller’s lab crew and Willis’s lab crew. Technical support for culture system was provided by JCU Marine Aquarium Research Facility Unit (MARFU). L. Harrington provided crustose coralline algae (CCA) identification and constructive comments to the experiment set up and CCA culture..
(8) Acknowledgements I thank everyone who has assisted me over the years with this PhD and I am particularly grateful to the people mentioned below. Apologies to anyone that I have forgotten to mention, and I hope I have thanked you along the way. First, I would like to thank my supervisors and JCU staff members who have spent time providing valuable guidance and feedback. I thank my primary supervisors Andrew Baird and Bill Leggat who were instrumental in my development as an independent researcher. I also thank Aurelie Moya for her continuous support and countless late night’s sessions in the lab working on this study. I am very grateful for the valuable insights gained through discussion and advice from Maria Byrne and I thank Lindsay Harrington for her knowledge, advice and information on the settlement substrate component in this study. I would like to thank Philip Munday for letting us replicate and modify his ocean acidification manipulation system. For technical assistance, I would like to thank Geoff Endo, Rob Gegg, Ross Barrett and the MARFU team. And to Peter Schupp and Alex Kerr from University of Guam, thank you for your generosity and collaboration in this study. For financial assistance, I acknowledge the support of James Cook University and the Australian Research Council. I was supported by the Ministry of Higher Education Malaysia. And I thank Great Barrier Reef Marine Park Authority for allowing us to conduct this research on Australian reefs. Thank you CSIRO, ACRS and ANNIMS for travel subsidies to conferences..
(9) I would like to give a special mention to everyone that has helped me with my field and laboratory work, especially Erika Woolsey, Greg Torda, Lotte Huisman, Erin Graham and Peter Cross. Thank you for making the strenuous coral collection, groundhog days and the late nights awesome and fun. And thanks to everyone who has been involved in the various adventure trips and 'coral sex-trade’. It is through those experiences that I have discovered the beauty of science and new discoveries. Very special thanks to Kellie Johns who has continuously providing useful comments to my manuscripts and significantly improved my writing skills in a second language. Thank you to Duan Biggs for inspiring numerous creative artworks, and for bringing humour to Room 105 and the Centre of Excellence for Coral Reef Studies. Finally I would like to thank my family: Ju, Heng, Hui, Ma and Pa; and friends: Sally, Daisie, JK, Becs, Dom, Andy, Darren, Mi, Steph, Susie and lots more, for their support and encouragement through tough times. Thank you for always being there for me. I dedicate this thesis to my partner Ryan Anderson, for being the inspiration of my life, and for the patience and TLC in our relationship..
(10) Contents Abstract ............................................................................................................................. 8 Chapter 1: General Introduction ................................................................................ 10 Ocean acidification and ocean carbon chemistry ........................................................... 11 Calcification of Marine Organisms ................................................................................ 13 Aragonite saturation and calcification ........................................................................... 14 Mechanisms by which ocean acidification may affect the early life history of marine organisms ....................................................................................................................... 15 Responses of marine invertebrate larvae (MIL) to ocean acidification ......................... 15 Temperature elevation and corals .................................................................................. 17 Synergistic effects .......................................................................................................... 17 Thesis outline ................................................................................................................. 18 Chapter 2: Near-future reductions in pH have no consistent ecological effects in the early life history stages of reef corals .......................................................................... 28 Introduction .................................................................................................................... 28 Materials and method ..................................................................................................... 31 Collection of gravid colonies ...................................................................................... 31 Experimental manipulation of pH............................................................................... 31 The effect of acidification on development ................................................................ 32 The effect of pH on metamorphosis ........................................................................... 33 The effect of acidification on larval survivorship ....................................................... 33 Data analysis .................................................................................................................. 34 Results ............................................................................................................................ 34 1.
(11) The effect of pH on larval development ..................................................................... 34 The effect of pH on larval survivorship ...................................................................... 35 The effect of pH on metamorphosis ........................................................................... 35 Discussion ...................................................................................................................... 35 Chapter 3: Effects of ocean acidification on ocean warming on the early life history stages of corals. .............................................................................................................. 46 Introduction: ................................................................................................................... 46 Materials and method ..................................................................................................... 48 Collection of gravid colonies ...................................................................................... 48 Experimental manipulation of ocean acidification and warming ............................... 48 The effect of elevated pCO2 and warming on fertilization ......................................... 49 The effect of elevated pCO2 and warming on development ....................................... 49 The effect of elevated pCO2 and warming on metamorphosis ................................... 49 Data analysis .................................................................................................................. 50 Results: ........................................................................................................................... 51 Discussion: ..................................................................................................................... 52 Chapter 4: Effects of ocean acidification on metamorphosis of larvae of a brooding and spawning coral ....................................................................................................... 68 Introduction .................................................................................................................... 68 Materials and method ..................................................................................................... 70 Experimental manipulation of ocean acidification. .................................................... 71 The effect of pCO2on metamorphosis ........................................................................ 71 Data analysis .................................................................................................................. 72 2.
(12) Results ............................................................................................................................ 72 Discussion ...................................................................................................................... 72 Chapter 5: Effects of ocean acidification and ocean warming on the growth and patterns of skeletogenesis in juvenile corals. .............................................................. 79 Introduction .................................................................................................................... 79 Materials and method ..................................................................................................... 80 Larval culture and settlement ...................................................................................... 80 Experimental manipulation of pCO2 and temperature. .............................................. 81 Effects of acidification on juvenile growth................................................................. 81 Effects of acidification and warmingon juvenile growth............................................ 82 Data analysis .................................................................................................................. 83 Results ............................................................................................................................ 83 Growth of recruits ....................................................................................................... 83 Patterns of skeletogenesis ........................................................................................... 83 Discussion ...................................................................................................................... 84 Chapter 6: General Discussion .................................................................................... 91 References ....................................................................................................................... 96 Appendices.................................................................................................................... 109. 3.
(13) List of Tables Table 1.1: Projected changes in ocean surface carbonate chemistry based on IPCC IS92a CO2 emission scenario. pH is based on seawater scale. Percent changes from preindustrial values are in brackets. ..................................................................................................... 21 Table 1.2: A summary of previous research on the effects of ocean acidification on the early life history stages of corals. Columns are categorized according to the current pCO2, near future and past 2100 pCO2 value.. .......................................................................... 22 Table 1.3: A summary of previous research on the effects of ocean warming on the early life history stages of corals. Columns are categorized according to the current average sea temperature, near future and post-2100 sea temperature values.. ................................... 24 Table 2.1: Water parameters measurements Oct 2009 with 1 standard error value for experiments conducted ................................................................................................... 39 Table 2.2: Water parameters measurements Nov 2009 with 1 standard error value for experiments conducted ................................................................................................... 40 Table 2.3: Water parameters measurements Dec 2009 with 1 standard error value for experiments conducted ................................................................................................... 41 Table 3.1: Water chemistry parameters (±SE) value throughout the experiment with saturation values of Aragonite and Calcite and actual saturated values of pCO2 in treatments tanks calculated using CO2SYS.................................................................... 55 Table 3.2: Two-way ANOVA results for every fertilization experiment (single species tested against elevated pCO2 (abbreviated pCO2) and temperature treatment) with Bonferroni correction ...................................................................................................... 56. 4.
(14) Table 3.3: Two-way ANOVA results for every 'average time to gastrula stage' experiment (single species tested against elevated pCO2 (abbreviated pCO2) and temperature treatment) with Bonferroni correction.............................................................................................. 57 Table 3.4: Two-way ANOVA results for every 'average time to motile stage' experiment (single species tested against elevated pCO2 (abbreviated pCO2) and temperature treatment) with Bonferroni correction ............................................................................................. 58 Table 3.5: Median survivorship results for A. tenuis, Kaplan-meier analysis. df = 3, χ2= 16.4, p< 0.001. ............................................................................................................... 59 Table 3.6: Survivorship results for A. millepora, Kaplan-Meier analysis. df = 3, χ2= 4.814, p = 0.028. ........................................................................................................................ 60 Table 3.7: Two-way ANOVA results for every 'metamorphosis' experiment (single species tested against elevated pCO2 (abbreviated pCO2). and temperature treatment) with. Bonferroni correction ...................................................................................................... 61 Table 4.1: Water chemistry parameters (±SE) value throughout the experiment with saturation values. of Aragonite and Calcite and actual saturated values of pCO2 in. treatments tanks calculated using CO2SYS.................................................................... 74 Table 4.2: The number of Leptastrea cf transversa larvae completing metamorphosis under four level of pCO2. .......................................................................................................... 75 Table 6.1: A summary of the results compiled in this thesis... ...................................... 94. 5.
(15) List of Figures Figure 1.1: Coloured lines represent five projected IPCC scenario of CO2 emissions and concentration in the atmosphere within year 2100 (from Bindoff et al. 2007, IPCC report) ........................................................................................................................................ 19 Figure 1.2: Schematic diagram of the life cycle of acroporids, with emphasis on the early life history stages. (Ball 2000, unpublished diagram) .................................................... 20 Figure 2.1: Time in hours to reach gastrula (mean + SE) in four separate experiments (A = Acropora tenuis, B = A. hyacinthus, C = A. millepora Nov and D = A. millepora Dec) under four acidity treatments .................................................................................................... 42 Figure 2.2: Survivorship (mean number of larvae alive ±SE) in three separate experiments (A = A. tenuis, B = A. millepora Nov) under four acidity treatments ............................. 43 Figure 2.3: Metamorphosis (mean % ±SE) in three separate experiments (A = Acropora hyacinthus, B = A. millepora Nov and C = A. millepora Dec) under four acidity treatments ........................................................................................................................................ 44 Figure 3.1: Average percentile of fertilization under both elevated temperature and acidity exposure (±SE) for 4 experiments across 2 acroporid species (n = 20 for both species).62 Figure 3.2: Average time to gastrula under both elevated temperature and acidity exposure (±SE) for 4 experiments across 2 acroporid species.. ..................................................... 63 Figure 3.3: Average time to motile under both elevated temperature and acidity exposure (±SE) for 4 experiments across 2 acroporid species (A. tenuis n= 142; A millepora n= 142– 218). ................................................................................................................................ 64 Figure 3.4: Number of surviving propagules under both elevated temperature and acidity exposure (±SE) for 2 experiments across 2 acroporid species (n= 150 for borth species).65. 6.
(16) Figure 3.5: Average percentile of metamorphosis under both elevated temperature and acidity exposure (±SE) for 2 experiments across 2 acroporid species (n= 72 for both species)............................................................................................................................ 66 Figure 4.1: (a) A broadcast spawned larva (Leptasrea cf. transversa) with no symbionts (b) a brooded larvae (Stylophora pistillata) with symbionts evident as brown splotches in the gastroderm ...................................................................................................................... 76 Figure 4.2: The proportion of Goniastrea retiformis larval complete metamorphosis under four acidification regimes (mean + SE). ......................................................................... 77 Figure 5.1: Mean maximum diameter of A. millepora juvenile in four pCO2 treatments (±SE) with n = 248.......................................................................................................... 85 Figure 5.2: Average maximum diameter of A. tenuis (A; n= 153) and A. millepora (B; n= 184) juveniles in four combinations of pCO2 and temperature through time in 2010.... 86 Figure 5.3: Stereo-micrographs of representative coral spats of A. millepora in four different pH treatments. .................................................................................................. 87 Figure 5.4: Stereo-micrographs of representative coral spats of A. tenuis in four different CO2 and temperature treatments .................................................................................... 88 Figure 5.5: Stereo-micrographs of representative coral spats of A. millepora in four different elevated CO2 and temperature treatments. ....................................................... 89. 7.
(17) Abstract The rapid increase in carbon dioxide (CO2) in the atmosphere since the industrial revolution is heating the earth and decreased the ocean’s pH level. Sea temperature is predicted to rise by between 2 to 4 °C and ocean pH is predicted to decrease 0.2-0.4 units by the end of this century. These changes, along with associated changes in the carbonate chemistry of seawater, are predicted to disrupt calcification and affect the physiology of many marine organisms. While the effects of ocean acidification (OA) on adult scleractinian corals have been extensively studied, until very recently, the effects of OA on the ecology of the early life history stages of corals remained largely unexplored. Similarly, while the effects of temperature on adults and early life history stages of corals are well known, the possible synergistic effects of temperature and OA have not been examined. It is important to assess the effect of OA on the early life stages of corals in order to predict the likely effects on population dynamics. In addition, such research will provide useful guidance for managing coral reefs. To address these critical knowledge gaps, I explored the effect of OA and temperature on fertilization, development, survivorship and metamorphosis using gametes and larvae of a number of abundant scleractinian corals from the Great Barrier Reef. In the first series of experiments, I used four treatment levels of pCO2 corresponding to current levels of atmospheric CO2 (approximately 380 ppm), and three projected values within this century (550, 750 and 1000 ppm), to test whether fertilization, embryonic development, larval survivorship or metamorphosis was affected by OA. None of these variables were consistently affected by pCO2 suggesting that there will be no direct ecological effects of OA on the pre-settlement stages of reef corals, at least in the near future. In a second series of experiments, I tested the effect of OA in combination with elevated temperature on the 8.
(18) response variables mentioned above. We used four treatments: control, elevated temperature (+2°C), decreased pH (600-700 ppm) and a combination of elevated temperature and acidity. There were no consistent effects of OA on fertilization, development, survivorship or metamorphosis either alone, or acting synergistically with temperature. In contrast, temperature consistently increased rates of development, but otherwise had little effect. I conclude that temperature is more likely to affect the ecology of the early life history stages of corals in the near future, mostly by speeding up rates of development and therefore altering patterns of connectivity among reefs. In the third set of experiments, I compared the effects of ocean acidification on the larval metamorphosis of a spawning coral Goniastrea retiformis and a brooding coral Leptastrea cf transversa in Guam. Again, metamorphosis was not consistently affected by pCO2 in either species. These results suggest that the mode of reproduction does not affect the larval response to pCO2 and furthermore, there will be no direct effects of ocean acidification on settlement rates of reef corals, at least in the near future. In the final set of experiments, I tested the effect of ocean acidification on its own and in combination with elevated temperature on the growth of juveniles of Acropora millepora and Acropora tenuis using the treatment levels described above. Neither OA nor temperature had any significant effect on growth or the pattern of skeleton formation in these species. I concluded ocean acidification is not a threat to the early life history stages of corals in the foreseeable future.. 9.
(19) Chapter 1: General Introduction Coral reefs are one of the most important marine ecosystems as they support a high biodiversity of marine benthic and pelagic species (Sorokin 1993). In tropical coral reefs, scleractinian coral and calcareous algae share the role of building and cementing the massive carbonate framework that forms a habitat for coral reef organisms (Kleypas et al. 2006). A symbiotic relationship exists between the algae and coral host, allowing tight nutrient cycling which contributes to the high productivity on coral reefs despite many tropical reefs existing in a nutrient poor environment (Hatcher 1988). This high productivity supports high biodiversity, which benefits the human community by contributing to the economy in many tropical regions (Allen and Steene 1994). Each year, coral reefs provide nearly USD$30 billion in net benefits of goods and services to world economies, including tourism, fisheries and coastal protection (Costanza et al. 1997; Bryant et al. 1998; Cesar et al. 2003). More than 100 countries are bordered by coral reefs and tens of millions of people depend on these reefs for part of their protein intake (Salvat 1992). One square kilometer of actively growing coral reef can provide the protein requirements of over 300 people if no other protein sources are available (Jennings and Polunin 1996). Despite the importance of coral reefs, they continue to deteriorate through a combination of direct and indirect human impacts, such as pollution and global climate change (Caldeira and Wickett 2003). Global climate change is caused by the ongoing accumulation of CO2 and other greenhouses gases such as methane, in the atmosphere (Bindoff et al. 2007; IPCC report, Fig. 1.1). Since the start of the industrial revolution (circa 1750) the atmospheric concentration of CO2 has risen from a pre-industrial level of around 280 parts per million 10.
(20) (ppm) to today’s concentration of approximately 393 ppm (Maona Loa Observatory, 2012, Table 1.1). This 37.5% rise in atmospheric CO2 concentration is even more significant considering that almost 50% of total anthropogenic CO2 emissions over the last 250 years have been absorbed by the world’s oceans (Sabine et al. 2004). While this oceanic absorption has significantly buffered the rate of global warming, an often overlooked consequence is a decreasing pH level in the world’s ocean, a process known as ocean acidification. Ocean acidification (OA) has emerged as a serious threat to calcifying marine organism such as molluscs (Michaelidis et al. 2005), crustaceans (Kurihara et al. 2008), echinoderms (Kurihara and Shirayama 2004; Kurihara et al. 2004; Havenhand et al. 2008), corals (Gattuso et al. 1998; Kleypas et al. 2001; Langdon and Atkinson 2005; Jokiel et al. 2008), large calcareous algae (Kuffner et al. 2008) and some phytoplankton (IglesiasRodriguez et al. 2008). OA is also likely to affect the physiology of these organisms. In my thesis, I will focus on the effects of OA on the early life history of marine benthic organisms, in particular, scleractinian corals. Ocean acidification and ocean carbon chemistry Global climate change driven by increased concentration of CO2 in the atmosphere has created conditions that have already contributed to reef degradation, and will continue to do so in the future. These conditions include: rising sea surface temperatures (CarricartGanivet 2004; Crabbe 2007), increased CO2 concentration in seawater (Feely et al. 2004; Fabry et al. 2008), sea level rise (Bindoff et al. 2007), increase in severity and frequency of tropical storms (Henderson-Sellers et al. 1998; Emanuel 2005) and increased frequency of. 11.
(21) disease outbreaks (Jones et al. 2004; Boyett et al. 2007). Many authors predict that of these the most significant threat to coral reefs is increasing ocean acidity (Hoegh-Guldberg 2005; Hoegh-Guldberg et al. 2007). Oceans are estimated to have taken up approximately 50% of anthropogenic atmospheric CO2 as the CO2 cannot be dissipated by the ocean biological pump, where carbon is transferred from the atmosphere to deep ocean water and sediment thus stored (Sabine et al. 2004). The rate of CO2 uptake by the ocean is slowing as the CO2 stored in the deep ocean is saturating (Le Quere et al. 2007) causing the recently emitted CO2 to be suspended in the pelagic ocean layer. The dissolved CO2 in the surface layer will acidify the pelagic zone (Caldeira and Wickett 2003), creating an imbalance in carbon chemistry that is predicted to adversely affect the calcification process of marine benthic organisms by decreasing carbonate ion concentrations (Pörtner et al. 2005). Anthropogenic CO2 can be buffered or neutralized by the dissolution of CaCO3 from benthic sediments but this process requires thousands of years (Raven et al. 2005). Carbon dioxide is continuously exchanged between the atmosphere and the ocean. When CO2 is dissolved in the surface layers of the ocean it reacts with water to form carbonic acid (H2CO3), bicarbonate (HCO3-) and carbonate (CO32-) ions (Skirrow and Whitfield 1975). The more CO2 that is absorbed in the ocean the more carbonic acid is produced, thereby decreasing the ocean’s pH. In addition, these reactions reduce the availability of carbonate ions, which are required for calcification (refer to equation below). Such changes in ocean chemistry are predicted to have substantial direct and indirect effects on marine organisms especially those that calcify because they rely on the availability of carbonate ions for growth and development (Goreau and Bowen 1955; Langdon 2000; Cooper et al. 2008; De'ath et al. 2009; Pörtner 2009).. 12.
(22) Calcification of Marine Organisms Changes in ocean carbon chemistry are predicted to cause a decrease in calcification because carbonate ions (CO32-) are a major component of the calcium carbonate (CaCO3) skeletons of coral and other reef-building organisms (Kleypas and Hoegh-Guldberg 2006). Coral calcification occurs when the carbonate ions combine with calcium ions (Ca2+) and when CO2 admission to seawater exceeds the buffer capacity of the ocean. Carbonate ions become less available, thus preventing the production of the coral skeleton. When CO2 combines with water to produce carbonic acid (H2CO3), protons (H+) are released and combine with carbonate ions (CO32-) to produce bicarbonate ions (HCO3-). Hydrogen ions (H+) take up CO32- to produce H2CO3, thus making CO32- ions less available for marine organisms’ calcification. The chemical reaction describing the entire process is given as: CaCO3 → Ca2++ CO32- (calcification) 2 H+ + CO32- ↔ 2HCO3CO2 (g) ↔ CO2 (aq) + H2O ↔ H2CO3 ↔ HCO3- + H+. The calcification process involves the active transportation of ions from the surrounding seawater and through multiple coral cell layers to the sites of calcification at the calicoblastic layer (Allemand et al. 2004). Calcium ions (Ca2+) are actively transported through cell layers from seawater in the ceolenteron to the calicoblastic tissue (Zocolla et al 1999; 2004). Metabolic CO2 from respiration is utilized for bicarbonate production (Allemand et al. 2004). Carbonic anhydrase forms a family of enzymes that catalyse the rapid conversion of CO2 to HCO3-; a reaction that occurs rather slowly in the absence of a catalyst. The enzyme speeds up the following equilibrium: 13.
(23) CO2 + H2O ↔ HCO3- + H+ The bicarbonate ions are absorbed on a mucopolysaccharide in an organic membrane, where they combine with calcium to form the skeleton (Allemand et al. 2004). Although this process is not well understood, it is thought that the carbonate production will be reduced by excessive amounts of CO2, thereby lowering the rate of calcification (Pörtner et al. 2005).. Aragonite saturation and calcification While the dissolution of calcium carbonate is primarily driven by the availability of carbonate ions, it is also affected by other factors, such as the chemical structure of calcium carbonate. Calcium carbonate is commonly found in two forms: calcite and aragonite. The aragonite saturation state of (Ωarag) is a measure of the thermodynamic potential for aragonite to form or dissolve; specifically it is the product of the concentrations of the reacting ions that form the mineral (Ca2+ and CO32–), divided by the product of the concentrations of those ions when the mineral is at equilibrium (Ksp), that is, when the mineral is neither forming nor dissolving:. Ωarag = [Ca+][CO−] K sp. When Ωarag > 1.0, the formation of aragonite is favourable under ambient sea water temperature; when Ω < 1.0, the dissolution of aragonite is favourable, it will cause decrease in the development of coral skeletons (Langdon and Atkinson 2005). Aragonite Ω of surface seawater is expected to decrease by 33% throughout the tropics from the present-. 14.
(24) day values of 3-3.5 to 2-2.5 in 100 years; and the ratio of dissolved CO2 gas to CO32– will increase by a factor of 4 (Orr et al. 2005). Because coral reefs produce new CaCO3 at a very slow rate it takes a long time to establish a mature coral colony (Goreau and Goreau 1959).. Mechanisms by which ocean acidification may affect the early life history of marine organisms There are two main mechanisms by which ocean acidification may affect the physiology of the early life history stages of marine organisms; by affective calcification as described above, or via hypercapnia. Hypercapnia occurs when increased levels of CO2 in water enter the organism by diffusion, equilibrates between all body compartments and acts predominantly through its acidifying effect on acid-base balance in body fluids. For example, Sipunculus nudus displays a range of reactions in acidified waters including metabolic depression (Pörtner and Reipschlager 1998), reduced rate of tissue acid-base regulation (Pörtner et al. 2005), and reduced rates of protein synthesis (Langenbuch and Pörtner 2002). These suppressions in metabolic activities can lead to cascading effects on an organism's life history, with potential effects on the early life history stages of marine organisms, such as a reduction in growth and survival of larval sea urchins (Shirayama and Thornton 2005 ; Kurihara 2008).. Responses of marine invertebrate larvae (MIL) to ocean acidification Early life history stages of marine invertebrates are often more vulnerable to disturbances than adults (Yund et al. 1987; Kurihara and Shirayama 2004; Kurihara 2008). In most marine invertebrates, many important physiological processes (such as, fertilization, embryogenesis and dispersal, Fig. 1.2) occur in the planktonic stage. These early life. 15.
(25) history stages are often perceived to be a bottleneck in the life of marine invertebrates with planktonic larvae because mortality during early life normally exceeds 90% (Gosselin and Qian 1997). Therefore, it is important to study the effects of climate change stressors on the early life history stages, as this will determine the success of dispersal and recruitment to new environments. Ocean acidification reduces the fertilization success of some marine invertebrates. Exposure to CO2 partial pressure from 1000ppm -10000ppm significantly decreases the swimming speed of sea urchin sperms (Havenhand et al. 2008) and fertilization success (Kurihara and Shirayama 2004; Kurihara et al. 2004). However, these detrimental effects are generally only evident at pCO2 levels not projected to occur for many decades (Caldeira and Wickett 2003). In contrast, fertilization of sub-tidal echinoids (Heliocidaris erythrogramma, H. tuberculata, Tripuneustes gratilla, Centrostephanus rodgersii) is not affected by acidity up to 7.6 pH units (Byrne et al 2009; 2010), which is comparable to projected pH value 300 years in the future (Bindoff et al. 2007, IPCC report). Similarly variable effects have been reported for rates of development and survivorship in a range of marine invertebrate larvae (see review by Byrne 2011). When I commenced my PhD in 2008, there was only one published study on the effects of OA on the early life history stages of corals (Albright et al. 2008). Research in this area has since blossomed. A thorough examination of the literature on coral larvae to date (Table 1.2) suggests that effects are only evident at very high pCO2 levels (Nakamura et al. 2011), or when gametes are past their peak (Albright et al. 2010). Nonetheless, there is critical need to explore the effects in a greater range of species from more regions of the globe. 16.
(26) Temperature elevation and corals Short term rises in sea temperature may actually enhance growth and reproduction of coral species (Purcell 2005; Purcell et al. 2007), however long term exposure to elevated temperature can lead to detrimental effects on marine organisms. These effects include reduced growth (Goreau and Macfarlane 1990; Edmunds 2005; Crabbe 2007; Edmunds 2008) and fecundity (Michalek-Wagner and Willis 2001), high rates of mortality (Baird and Marshall 2002; McClanahan et al. 2004), and local extinction leading to the loss of biodiversity (Hoegh-Guldberg 2004; Kleypas and Hoegh-Guldberg 2006) Temperature also has detrimental effects on the early life history stages of corals (Table 1.3). For instance, a slight increase in temperature (1-2°C above ambient SST) enhanced the fertilization (>90%), but also resulted in higher numbers of abnormal embryos (Negri et al. 2007). Similarly, fertilization success was high for Diploria strigosa in elevated temperatures (12°C) yet throughout embryogenesis, they developed into aberrant embryos (Bassim et al. 2002). Similarly, high temperatures reduce larval survivorship (Baird et al. 2006; Table 1.3) particularly in larvae that contain symbiotic algae (Yakovleva et al. 2009; Nesa et al. 2012).. Synergistic effects In the wild, temperature and OA clearly act on organism at the same time; however, there have been very few experiments to explore the potential synergy between these stressors. The general assumption is that the effect of OA and temperature variables will be additive. Indeed, high pCO2 acts synergistically with high temperature to lower thermal bleaching thresholds in corals and crustose coralline algae (Anthony et al. 2008). Similarly, growth rates of Porites panamensis juveniles were lowest in a combined OA and high temperature 17.
(27) treatment (Anlauf et al. 2011, see Table 1.4). However, the interaction could be antagonistic because while temperature increases metabolism (O’Connor et al. 2009), acidosis reduces it (Pörtner et al. 2004). For example, high temperatures can compensate for dwarfism (that would otherwise eventuate due to reduced calcification) in acidified sea water in Tripneustustes gratilla larvae (Sheppard Brennand et al. 2010). Clearly, there is a critical need to explore the effect of this synergy in the early life history of corals.. Thesis outline In chapter two, I test the effect of OA on the early life history of corals using gametes and larvae of four abundant scleractinian corals from the Great Barrier Reef. I used four treatment levels of pCO2 corresponding to current levels of atmospheric CO2 and three projected values within this century to test whether fertilization, embryonic development and larval survivorship and metamorphosis were affected by OA. Due to the nature of high mortality in invertebrate larvae (Gosselin and Qian 1997), normally within the first 24 hours the larvae population will experience up to 50% of casualties in the field. In the third chapter I test the effect of OA in combination with elevated temperature on the response variable mentioned above. I used four treatments: control, elevated temperature (+2°C), elevated acidity (600-700 ppm) and a combination of elevated temperature and acidity. In chapter 4, the final data chapter, I tested the effects of ocean acidification on its own and in combination with elevated temperature on the growth and patterns of skeleton formation in juveniles of Acropora millepora and Acropora tenuis using the treatment levels described above. Finally, I conclude with a general discussion that summarise my work and discuss areas for future work.. 18.
(28) In addition to my data chapter I present a paper in an Appendix. The first, I coauthored with my colleague from the School of Molecular Science, JCU, Dr Aurelie Moya (Appendix I). I was involved in designing this experiment, participated in the laboratory work and provided editorial input to the manuscripts. The paper is entitled “Whole transcriptome analysis of the coral Acropora millepora reveals complex responses to CO2 driven acidification during the Initiation of calcification” and it investigates the gene expression in newly settled coral juveniles under near-future acidification levels. This publication is currently in press in Molecular Ecology (Moya et al. 2012).. 19.
(29) Figure 1.1: Coloured lines represent five projected IPCC scenario of CO2 emissions and concentration in the atmosphere within year 2100 (from Bindoff et al. 2007, IPCC report). a,. 20.
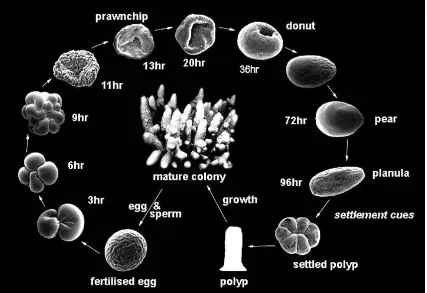
(30) Figure 1.2: Schematic diagram of the life cycle of acroporids, with emphasis on the early life history stages. (Ball 2000, unpublished diagram). 21.
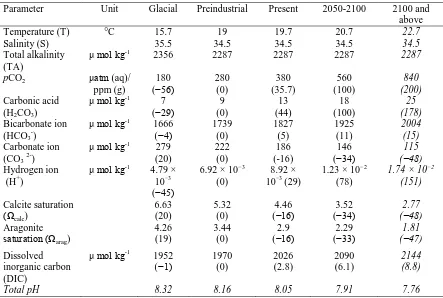
(31) Table 1.1: Projected changes in ocean surface carbonate chemistry based on IPCC IS92a CO2 emission scenario. pH is based on seawater scale. Percent changes from preindustrial values are in brackets. (Feely et al. 2004; Guinotte et al. 2006; Fabry et al. 2008). Parameter Temperature (T) Salinity (S) Total alkalinity (TA) pCO2 Carbonic acid (H2CO3) Bicarbonate ion (HCO3-) Carbonate ion (CO3 2-) Hydrogen ion (H+). Unit. Glacial. Preindustrial. Present. 2050-2100. °C. 15.7 35.5 2356. 19 34.5 2287. 19.7 34.5 2287. 20.7 34.5 2287. 2100 and above 22.7 34.5 2287. 180 (−56) 7 (−29) 1666 (−4) 279 (20) 4.79 × 10⁻³ (−45) 6.63 (20) 4.26 (19). 280 (0) 9 (0) 1739 (0) 222 (0) 6.92 × 10⁻³ (0). 380 (35.7) 13 (44) 1827 (5) 186 (-16) 8.92 × 10⁻³ (29). 560 (100) 18 (100) 1925 (11) 146 (−34) 1.23 × 10⁻² (78). 840 (200) 25 (178) 2004 (15) 115 (−48) 1.74 × 10⁻² (151). 5.32 (0) 3.44 (0). 4.46 (−16) 2.9 (−16). 3.52 (−34) 2.29 (−33). 2.77 (−48) 1.81 (−47). 1952 (−1). 1970 (0). 2026 (2.8). 2090 (6.1). 2144 (8.8). 8.32. 8.16. 8.05. 7.91. 7.76. μ mol kg-1 μatm (aq)/ ppm (g) μ mol kg-1 μ mol kg-1 μ mol kg-1 μ mol kg-1. Calcite saturation (Ωcalc) Aragonite saturation (Ωarag) Dissolved inorganic carbon (DIC) Total pH. μ mol kg-1. 22.
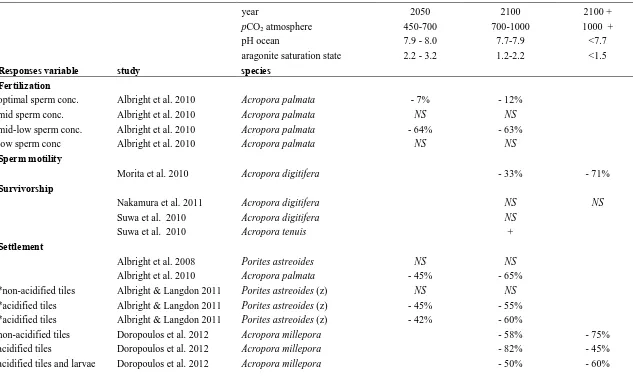
(32) Table 1.2: A summary of previous research on the effects of ocean acidification on the early life history stages of corals. Columns are categorized according to the current pCO2, near future and past 2100 pCO2 value. Plus signs (+) denote increase, minus signs (-) denote decrease, compared to control values.. Responses variable. study. year pCO2 atmosphere pH ocean aragonite saturation state species. 2050 450-700 7.9 - 8.0 2.2 - 3.2. 2100 700-1000 7.7-7.9 1.2-2.2. - 7% NS - 64% NS. - 12% NS - 63% NS. 2100 + 1000 + <7.7 <1.5. Fertilization optimal sperm conc. mid sperm conc. mid-low sperm conc. low sperm conc Sperm motility. Albright et al. 2010 Albright et al. 2010 Albright et al. 2010 Albright et al. 2010. Acropora palmata Acropora palmata Acropora palmata Acropora palmata. Morita et al. 2010. Acropora digitifera. - 33%. - 71%. Nakamura et al. 2011 Suwa et al. 2010 Suwa et al. 2010. Acropora digitifera Acropora digitifera Acropora tenuis. NS NS +. NS. Albright et al. 2008 Albright et al. 2010 Albright & Langdon 2011 Albright & Langdon 2011 Albright & Langdon 2011 Doropoulos et al. 2012 Doropoulos et al. 2012 Doropoulos et al. 2012. Porites astreoides Acropora palmata Porites astreoides (z) Porites astreoides (z) Porites astreoides (z) Acropora millepora Acropora millepora Acropora millepora. Survivorship. Settlement. *non-acidified tiles *acidified tiles *acidified tiles non-acidified tiles acidified tiles acidified tiles and larvae. NS - 45% NS - 45% - 42%. NS - 65% NS - 55% - 60% - 58% - 82% - 50%. - 75% - 45% - 60% 23.
(33) (for 60 days) 2 days acidity exposure 7 days acidity exposure Planulae Metabolism. Nakamura et al. 2011 Nakamura et al. 2011. Acropora digitifera Acropora digitifera. Albright & Langdon 2011 Nakamura et al. 2011. Porites astreoides (z) Acropora digitifera. - 27%. Albright et al. 2008 Albright et al. 2010 Albright & Langdon 2011 Cohen et al. 2009 de Putron et al. 2011 de Putron et al. 2011 Inoue et al. 2011 Kurihara 2008 Suwa et al. 2010. Porites astreoides Acropora palmata Porites astreoides (z) Favia fragum (z) Favia fragum(z) Porites Astreoides Acropora digitifera Acropora tenuis Acropora digitifera. - 45-56% - 39% - 16%. Suwa et al. 2010. Acropora digitifera. - 20 % - 80%. - 20 % - 80%. - 63% NS. NS. Post-settlement Growth. lateral weight weight. - 72-84% - 50% - 35% - 20%. NS NS - 4% - growth. - 75% - 37% - 36% - 25% - 16%. Symbiont uptake NS. *Note: The settlement substrates used in this study were: non-acidified tiles (limestone tiles conditioned with ambient seawater of 380ppm for 40 days) and acidified tiles (limestone tiles conditioned with treatment seawater of 560 or 860 ppm for 40 days). When results are insignificant, they are classified as ‘no effect’. ‘z’ indicates coral species with vertically transferred zooxanthellae.. 24.
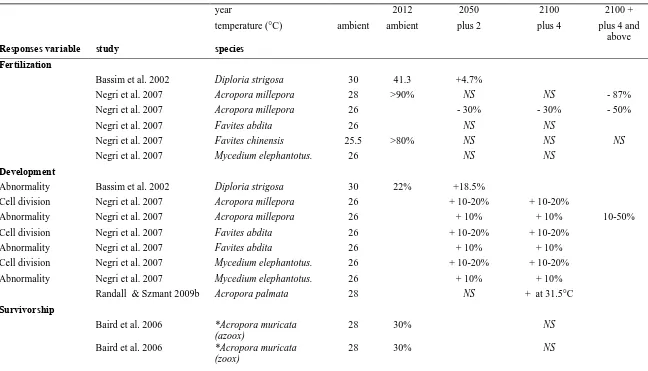
(34) Table 1.3: A summary of previous research on the effects of ocean warming on the early life history stages of corals. Columns are categorized according to the current average sea temperature, near future and post-2100 sea temperature values. Plus signs (+) denote increase, minus signs (-) denote decrease, compared to control values. year temperature (°C) Responses variable. 2012. 2050. 2100. 2100 +. ambient. ambient. plus 2. plus 4. plus 4 and above. study. species. Bassim et al. 2002. Diploria strigosa. 30. 41.3. +4.7%. Negri et al. 2007. Acropora millepora. 28. >90%. NS. NS. - 87%. Negri et al. 2007. Acropora millepora. 26. - 30%. - 30%. - 50%. Negri et al. 2007. Favites abdita. NS. NS. Negri et al. 2007. Favites chinensis. NS. NS. Negri et al. 2007. Mycedium elephantotus.. 26. NS. NS. Abnormality. Bassim et al. 2002. Diploria strigosa. 30. Cell division. Negri et al. 2007. Acropora millepora. 26. Abnormality. Negri et al. 2007. Acropora millepora. 26. + 10%. + 10%. Cell division. Negri et al. 2007. Favites abdita. 26. + 10-20%. + 10-20%. Abnormality. Negri et al. 2007. Favites abdita. 26. + 10%. + 10%. Cell division. Negri et al. 2007. Mycedium elephantotus.. 26. + 10-20%. + 10-20%. Abnormality. Negri et al. 2007. Mycedium elephantotus.. 26. + 10%. + 10%. Randall & Szmant 2009b. Acropora palmata. 28. NS. + at 31.5°C. Baird et al. 2006. *Acropora muricata (azoox) *Acropora muricata (zoox). 28. 30%. NS. 28. 30%. NS. Fertilization. 26 25.5. >80%. NS. Development 22%. +18.5% + 10-20%. + 10-20% 10-50%. Survivorship. Baird et al. 2006. 25.
(35) Bassim & Sammarco 2003. Diploria strigosa. 28. 56%. - 29%. - 41%. Coles 1985. Pocillopora damicornis. 25. 4.3. - 28%. - 47%. Edmunds et al. 2001. Porites astreoides (z). 28. 89%. Randall & Szmant 2009b. Acropora palmata. 28. 34-64%. - 15%. -55% at 31.5°C. Randall & Szmant 2009a. Favia fragum. 27. > 60%. NS. - 40%. Nozowa & Harrison 2007. Acropora soliaryensis. 23. >70%. NS at 26°C. Nozowa & Harrison 2007. Favite chinensis. 27. <20%. Bassim & Sammarco 2003. Diploria strigosa. 28. 70%. Coles 1985. Pocillopora damicornis. 25. Nozowa & Harrison 2000. Platygyra daedalea. 27. Nozowa & Harrison 2007. Acropora soliaryensis. 23. 2.6%. + 2.4% at 26°C. Nozowa & Harrison 2007. Favite chinensis. 27. 25%. Randall & Szmant 2009b. Acropora palmata. 28. 62%. - 19%. Randall & Szmant 2009a. Favia fragum. 27. 82%. + 3%. - 28% - 41% at 33°C - 50%. Post-settlement survivorship - 90% NS. - 10%. Metamorphosis - 5%. - 64%. 2.8. + 60%. + 30%. 24.6%. +27.2%. + 96% 12%. + 5%. + 15%. - 25% at 31.5°C - 48%. Note: A. muricata is a coral species with azooxanthellae larvae, zooxanthellae was introduced to A.muricata larvae in Baird et al (2006). 26.
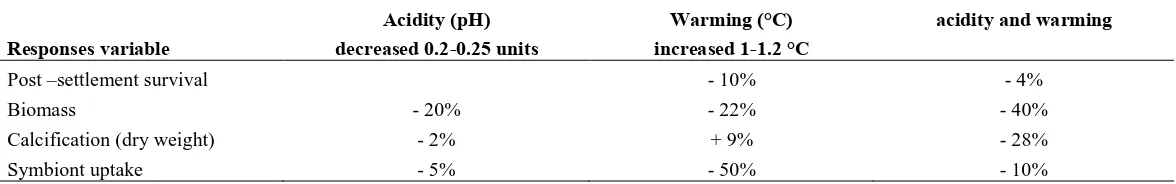
(36) Table 1.4: A summary of results from the only publication (for the period 2008-2011) that studied the synergy effects of ocean acidification and warming on the early life history stages of a brooding coral species, Porites panamensis (Anlauf et al. 2011). Columns are categorized according to the ocean acidification and warming regimes used in this study. Plus signs (+) denote increase, minus signs (-) denote decrease, compared to control values.. Responses variable. Acidity (pH) decreased 0.2-0.25 units. Post –settlement survival. Warming (°C) increased 1-1.2 °C. acidity and warming. - 10%. - 4%. Biomass Calcification (dry weight). - 20% - 2%. - 22% + 9%. - 40% - 28%. Symbiont uptake. - 5%. - 50%. - 10%. 27.
(37) Chapter 2: Near-future reductions in pH have no consistent ecological effects in the early life history stages of reef corals This chapter was in review in PLOS One May 2012.. Introduction Global climate change has the potential to detrimentally affect coral reefs in many ways. In particular, increasing ocean acidity is predicted to be one of the most severe threats to marine ecosystems before the end of this century (Kleypas et al. 1999; Orr et al. 2005). Ocean acidification (OA) is caused by alteration of water chemistry through CO2 absorption from the atmosphere, in particular, a decrease in seawater pH, carbonate ion concentration (CO32-) and the saturation state of aragonite. Recent changes in ocean chemistry, for example a decrease in pH of 0.1 units since before the industrial revolution (Caldeira and Wickett 2005), have already had pronounced effects on many calcifying marine organisms (Kroeker et al. 2012). Decreases in aragonite saturation projected to occur within this century are predicted to result in the net dissolution of calcium carbonate on coral reefs (Silverman et al. 2009). To date, much of the research into OA has focused on its effects on adults and, in particular, the process of calcification. However, the early life history stages of marine organisms are also likely to be sensitive to changes in ocean chemistry (Portner et al. 2004; Byrne 2010; Kroeker et al. 2010). Hypercapnia, defined as an increase in the partial pressure of CO2 in the respiratory fluids, is well known to affect acid-base regulation, oxygen transport and metabolic function (Portner et al. 2004). Similarly, high CO2 concentration in sea water has a narcotic effect on sperm, reducing motility 28.
(38) (Havenhand et al. 2008, Morita et al. 2010). While hypercapnia and CO2 narcosis may not necessarily be detrimental, responding to changes in the partial pressure of CO2 will be energetically costly and therefore has the potential to affect growth and reproductive output following prolonged exposure (Portner et al. 2004) in the absence of acclimitization. Lowered metabolism is possibly responsible for reduced rates of early development in larval of the sea urchin Hemicentrotus pulcherrimus at low pH (Kurihara and Shirayama 2004). Reduced rates of larval development are likely to extend pelagic durations with possible increases in rates of mortality and reduced recruitment success (Connolly and Baird 2010). Such changes are also likely to reduce levels of connectivity among affected organisms and therefore have the potential to affect rates of recovery from disturbance (Munday et al. 2009). The effects of decreased pH on the early life history of corals remain largely unexplored and results are variable (Table 1). For example, fertilization success in Acropora palmata was reduced at low sperm densities at pH of 7.85 and 7.72 (Albright et al. 2010), possibly because of reduced sperm motility (Morita et al. 2010). However, these levels of pH had no effect on fertilization success (Albright et al. 2010) when sperm concentrations were closer to those expected in the field in the hour immediately following spawning when most fertilization is likely to occur (Oliver and Babcock 1992). In addition, gametes were mixed by three hours after spawning and fertilization was scored a hour after this Albright et al. (2010) a time at which Acropora gametes have dramatically reduced fertility (Oliver and Babcock 1992). Similarly, larval survivorship differed among pH treatments in A. tenuis, but not in A. digitifera (Suwa et al. 2010). However, the difference in surviorship among treatments was not that expected if pH had. 29.
(39) a dose dependent or threshold effect. Indeed, there was no difference between either pH treatment and the control in A. tenuis, rather the difference was between the 7.6 and 7.3 pH treatments with survivorship significantly higher in the low pH treatment (Suwa et al. 2010). The respiration of A. digitifera larvae was not affected by pH as low as 7.3 (Nakamura et al. 2011). In contrast, the respiration rates of Porites asteroides larvae declined as pH decreased (Albright and Langdon 2011). The effects of decreased pH on larval metamorphosis are also variable (Table 1). Albright et al. (2008) found no effect of pH on the metamorphosis of Porites asteroides. Similarly, metamorphosis of A. digitifera was unaffected by a 2 day exposure to pH values of 7.6 and 7.3 (Nakamura et al. 2011). However, after 7 days of exposure metamorphosis was 80% lower in the reduced pH treatments (Nakamura et al. 2011). The effects of pH on larval metamorphosis may be indirect and mediated through a change in the settlement substratum (Albright et al. 2010). Metamorphosis is often reduced when settlement substratum have been conditioned in treated seawater suggesting that low pH affects the organisms, such as crustose coralline algal, that induced larval metamorphosis, or interferes with the coral larvae’s ability to sense these cues (Albright et al. 2010, Albright and Langdon 2011). However, even in this situation, the results are highly variable and do not always follow the response expected if pH was to have either a dose dependent or threshold effect. For example, metamorphosis of A. millepora larvae was reduced by 82% on settlement substrata that had been treated at pH 7.3 for six weeks, but there was no effect of metamorphosis on substrata treated at pH of 7.6 (Doropoulos et al. 2012). Similarly, while metamorphosis was lower when either the larvae or the substrate were treated at pH 7.6, there was no effect when both larvae and substrata were treated at this pH. Clearly,. 30.
(40) there is an urgent need to examine the response to pH in the larvae of a greater range of coral species to see if any general patterns emerge. Here, we manipulated pH levels to produce seawater with a range of potential pH values projected to occur at various stages later this century. The effects of these levels of pH were then tested on a number of processes crucial to successful coral recruitment: 1) larval development, 2) larval survivorship and 3) metamorphosis.. Materials and method Collection of gravid colonies Gametes of Acropora tenuis and A. hyacinthus were collected at Magnetic Island (19° 9’S, 146° 50’E) in October 2009 and gametes of A. millepora collected at Orpheus Island (18° 35’S, 146° 29’E) in November and December 2009. Adult colonies were collected a few days prior to the predicted spawning period, and maintained in outdoor aquaria. A. tenuis and A. hyacinthus spawned on the night of 9th October and 13th October respectively. A. millepora colonies spawned on 10th November, and the 10th December and 11th December.. Experimental manipulation of pH. The experiments were performed in a temperature control room (26°C-27°C). A CO2 mixing system, developed by Munday et al. (2009), was used to bubble CO2 through seawater at concentrations chosen to match the projections of the IPCC (2007) over the next 80 years: 550, 750 and 1000 ppm. CO2 concentrations were measured with a 31.
(41) Vaisala ® probe. CO2 was bubbled through 70 l sump tanks and the enriched water flowed through replicates jars via a one-way flow-through system. pH was measured every 24 h in the sump tank of each treatment (Table 2.1, 2.2 & 2.3) using TPS WP91 meter calibrated daily using Tris and NBS buffers. Temperature and dissolved O2 were also measured using TPS WP-91 DO, pH and temperature meter.. The effect of acidification on development Embryos were cultured following Babcock et al. (2003). Sperm and egg bundles were collected from between four and 6 colonies of each species, each colony was presumed to be genetically distinct. Once cleavage was observed, approximately 1000 embryos were placed in each of three replicate 3.5 l plastic jars, modified to allow 0.2 μm filtered CO2 treated sea water to flow through at the rate of 1.5 to 2 l per hour. At 12, 18, 24 and 36h after the gametes were mixed 20 embryos were removed from each jar for A. tenuis and A. hyacinthus and 10 embryos for A. millepora and the number that had completed gastrulation was scored. To test for differences in development time among treatments, the average time for embryos to reach gastrulation was estimated as follows. Average time to reach stage, X = Σ [time (hours) x number of propagules to reach stage]/ [number of propagules to reach stage]. 32.
(42) The effect of pH on metamorphosis Metamorphosis of Acropora larvae typically peaks between 6 and 10 days after spawning (Connolly and Baird 2010). Therefore, the age of larvae used to test for effects of pH on larval metamorphosis were: A. hyacinthus - 8 days old; A. millepora Nov - 6 days old; A. millepora Dec - 9 days old. Ten larvae of A. hyacinthus and 20 larvae of A. millepora Nov and A. millepora Dec were taken from each of the 3.5 l jars and placed into each well of a 6-well Iwaki cell culture plate with a modified meshed lid. A 2 mm x 2 mm crustose coralline algae (CCA) chip (Neogolithion sp. for the A. hyacinthus assay and Titanoderma sp. for A. millepora) was also placed in each well to induce metamorphosis (following Heyward and Negri 1999) and the wells, covered by plankton mesh to retain the larvae, were completely immersed in the CO2 treated seawater and the number of larvae that completed metamorphosis was assessed 24 h later. Larvae were defined as metamorphosed once a basal disc had been deposited (Baird and Babcock 2000).. The effect of acidification on larval survivorship To test whether reduced pH would have a direct effect on larval survivorship, 50 motile larvae (4 days old) were introduced into three replicate 200 ml plastic jars with mesh lids which were then immersed in the CO2 enriched seawater. The number of surviving larvae was counted every 24 h at which point the seawater in the jars was competently replaced. This period is sufficient for dead larvae to lyse and disappear (Baird et al. 2006). Larvae were followed for between five and 7 days depending on the experiment. 33.
(43) Data analysis Mean differences in the time to gastrulation were tested with 1-way ANOVA: the treatment factor was pH with four levels that differed slightly among assays (Tables 2.1, 2.2 and 2.3). Mean differences in the number of larva completing metamorphosis were tested with 2-way ANOVA: the first factor was pH (fixed) with four levels; the second factor, plate (random, n=3) was nested within treatment. There were 6 replicate wells in each plate. Each species on each occasion was analyzed independently (i.e. three to five separate assays depending on the response variable) because the pH values were slightly different in each assay (Tables 2.1, 2.2 and 2.3). Bonferroni correction was used to adjust the probability of type I error (i.e. probability was considered significant when p< 0.05/number of assays). Tukey’s HSD multiple comparison tests were conducted when ANOVAs detected significant differences among the main factors. Any bias in these data was explored by residual analysis. Only the A. millepora Nov data for metamorphosis required a log10 (x + 1) transformation. Differences in the median survival time in days among treatments were tested using Kaplan-Meier survival analysis. All analyses were performed in SPSS version 20.. Results The effect of pH on larval development The mean time to gastrulation did not vary consistently among as a function of pH (Fig. 2.1). A. tenuis larvae developed more slowly at the lowest pH (Fig. 2.1A; F3, 225 = 4.27; p = 0.006). In contrast, A. hyacinthus larvae developed more slowly in the control and low pH (Fig. 2.1B; F3, 225 = 4.31; p = 0.006). In the A. millepora Nov assay there was 34.
(44) no significant difference in development times among the pH treatments (Fig. 2.1C; F3, 116 =. 2.5; p = 0.06). Finally, in A. millepora Dec, development was slower at the lower. and lowest pH (Fig 2.1D; F3, 116 = 3.13; p = 0.029).. The effect of pH on larval survivorship Median survivorship did not vary among pH treatments in either of the two species tested (Fig 2.2). In A. tenuis, median survivorship was highest in the lowest pH treatment; however, the 95% confidence intervals indicate that this was not significantly different to the control pH (Fig 2.2A). In A. millepora Nov median survivorship was lower in the two lowest pH treatments; however, there was no significant difference between these values and the control (Fig 2.2B).. The effect of pH on metamorphosis The mean number of larvae completing metamorphosis was only affected by pH in the A. millepora Dec assay (Fig. 2.3). The number of larval completing metamorphosis did not differ among the pH treatments in A. hyacinthus (Fig. 2.3A F3, 2 = 1.54; p < 0.211) or A. millepora Nov (Fig. 2.3B; F3, 2 = 0.71; p = 0.551). In contrast, the number of A. millepora Dec that completed metamorphosed was higher in the lower and lowest pH treatments (Fig. 2.3C; F3, 2 = 7.77; p < 0.001).. Discussion Simulated levels of pH projected to occur at various stages later this century did not have a consistent effect on the pre-settlement stages of these three Acropora species. In most. 35.
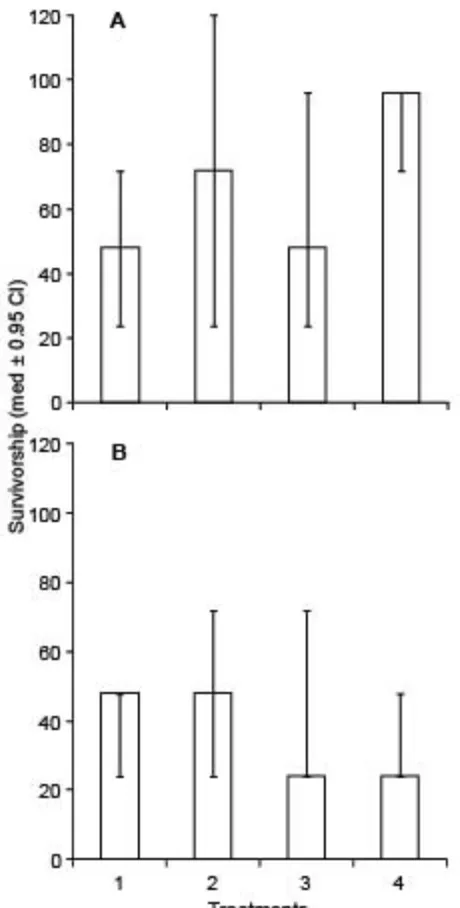
(45) assays, no significant differences were apparent between the three pH treatments and controls. In the few assays where an effect was detected, this was often opposite to the expected trend. For example, the metamorphosis of A. millepora was higher at the two lowest pH levels (Fig. 2.2C) and rates of development were slower in A. hyacinthus at the two highest levels of pH. This suggests that projected levels of pH will not threaten the early life history stages of these corals species until at the at least the end of the century. Development rates of coral embryos were not consistently affected by pH. In two assays the prediction of a slower rate of development at reduced pH did occur (Fig 2.1A, C), however, effect was small, with a increase in the mean time to complete gastrulation of approximately of between 2 to 4 h (approximately 15%). This difference is much lower than the typical differences among individuals within a cohort in the time taken to reach other important dispersal related stages, such as the time to become competent (Connolly and Baird 2010). These results contrast with the effects of pH on development rates in other organisms. For example, Littoria obtusata embryos in a pH 7.6 treatment took 1.5 days longer to hatch when compared to controls (Ellis et al. 2009). Similarly, larval development in sea urchins (Kurihara and Shirayama 2004) and oysters (Kurihara et al. 2007) is slower at low pH. However, both these species have a larval test and it is perhaps the absence of calcareous skeleton that makes coral larvae less likely to be affected by low pH. Rates of larval survivorship were not affected by reduced pH. Similarly, larval survivorship did not differ between controls and reduced pH treatments for A. digitifera or A. tenuis larvae (Suwa et al. 2010). In contrast, in sea urchins (Kurihara 2008) and brittle stars (Dupont et al. 2010) survival was lower at reduced pH. However, once again,. 36.
(46) both these species have a larval test which may predispose them to being affected by low pH. Metamorphosis was not consistently affected by pH. Indeed, metamorphosis in A. millepora_Dec was higher under the two lowest pH treatments (Fig. 2.3C). Results from the literature are similarly inconsistent. Albright et al. (2008) found no effect of pH on metamorphosis in Porites asteroides larvae. Similarly, rates of metamorphosis in Porites panamensis were not affected by a 0.2-0.25 unit decrease in pH (Anlauf et al. 2011). In contrast, Nakamura et al. (2011) did find an effect but only in A. digitifera larvae exposed for 7 days to pH levels not expected until well into the next century. While Albright et al. (2010) did record reduced metamorphosis under reduced pH treatments, they suggested the effect was indirect, i.e. through changes in the nature of the settlement substratum rather than a direct effect on the larvae; an hypothesis supported to some extent by more recent work (Albright and Langdon 2011; Doropoulos et al. 2012). Nonetheless, no mechanism has been proposed to explain this phenomenon. Furthermore, the effects presented by Doropoulos et al. (2012) are not consistent with either a dose dependent or threshold effect in all their experiments, as discussed above. The gametes and larvae of many marine invertebrates are exposed to large daily fluctuations in environmental variables, including pH. For example, the pH in many shallow coastal areas, including coral reefs, varies markedly over very short periods. For example, in sub-surface waters directly above the reef crest, pH varied by 0.2 units in 4 h (Gagliano et al. 2010). Similarly, diurnal oscillations in pH above coral colonies varied by 0.5 units (Odhe and van Woesik 1999). Indeed, naturally oscillating pH actually stimulates the growth of coral recruits (Dufault et al. 2012). The gametes of many species. 37.
(47) are equipped with constitutive defenses against low pH in order to deal with these environmental fluctuations (Hamdoun and Epel 2007; Byrne et al. 2009 & 2010). Given these fluctuations in pH in the reef environment it is perhaps no surprise that effects of pH are generally inconsistent and often only evident at very low levels (Table 1.2). In conclusion, projected ocean acidification levels in the near future appear unlikely to have major direct ecological effects on the non-calcifying early life history stages of corals. Our results, and a careful reading of the literature on the effects of reduced pH on coral larvae (Table 1.2), suggests that direct effects are only evident at very low pH levels (Nakamura et al. 2011), or when gametes have lost vitality (Albright et al. 2010). One possible source of the inconsistency in our results is the small number of adults, typically between four and six individuals, used to produce the larvae for experiments. Sampling effects from the use of low numbers of brood stock may result in high variability in the genetic composition among different larval cultures. Parental effects on coral larval traits, such as metamorphosis and metabolism, can be large (Meyer et al 2009). Consequently, future work should aim to incorporate parental effects into experimental designs. Alternatively, organism may be able to acclimatize relatively quickly to changes in pH, particularly as large diurnal fluctuations appear common in the environment. The lack of major affects on larval ecology does not mean that ocean acidification is not a threat to other stages in a corals life history. There are strong theoretic and empirical reasons for expecting an effect on physiology (Portner et al. 2004) and patterns of gene expression vary dramatically as levels of pH decrease (Moya et al. 2012). The consequences of energy expenditure on cellular acid-base regulation and lowered. 38.
(48) metabolism are perhaps unlikely to be apparent in short term ecological experiments. In particular, growth, reproduction and competitive ability are all likely to be affected by increases in ocean acidity over a longer time frame (Anthony et al. 2008; Fabricius et al. 2011). Finally, increased concentrations of atmospheric CO2 are also resulting in the warming of the ocean via the green house effect (Hendriks et al. 2010). Consequently, marine organisms must deal with both low pH and high temperatures and future work should explore the possible synergistic effects of these stressors on coral larval ecology.. Acknowledgements We thank P. Munday for his help designing the CO2 mixing system, D. Miller’s coral genomics group for help with larvae culture and data collection, E. Graham for statistical advice and L. Harrington for CCA identification. P. Munday offered constructive criticism on an earlier draft of the manuscript. This study was supported by funding from the. ARC. Centre. of. Excellence. for. Coral. Reef. Studies.. 39.
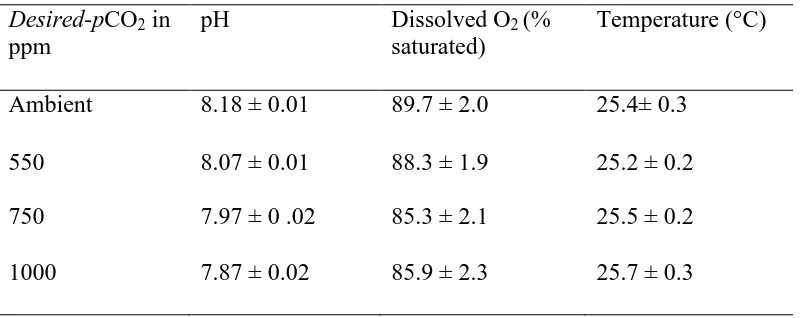
(49) Table 2.1: Water parameters measurements Oct 2009 with 1 standard error value for experiments conducted. Desired-pCO2 in ppm. pH. Dissolved O2 (% saturated). Temperature (°C). Ambient. 8.18 ± 0.01. 89.7 ± 2.0. 25.4± 0.3. 550. 8.07 ± 0.01. 88.3 ± 1.9. 25.2 ± 0.2. 750. 7.97 ± 0 .02. 85.3 ± 2.1. 25.5 ± 0.2. 1000. 7.87 ± 0.02. 85.9 ± 2.3. 25.7 ± 0.3. 40.
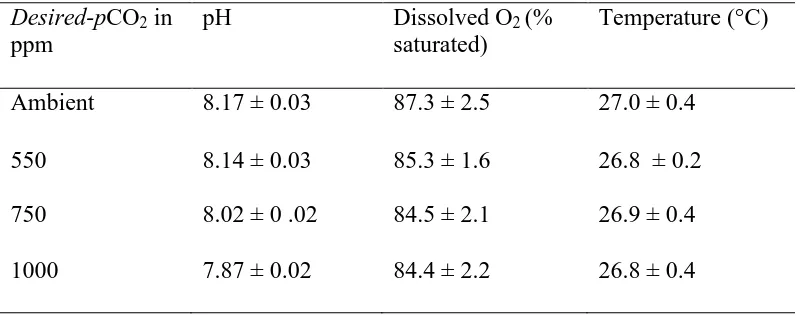
(50) Table 2.2: Water parameters measurements Nov 2009 with 1 standard error value for experiments conducted. Desired-pCO2 in ppm. pH. Dissolved O2 (% saturated). Temperature (°C). Ambient. 8.17 ± 0.03. 87.3 ± 2.5. 27.0 ± 0.4. 550. 8.14 ± 0.03. 85.3 ± 1.6. 26.8 ± 0.2. 750. 8.02 ± 0 .02. 84.5 ± 2.1. 26.9 ± 0.4. 1000. 7.87 ± 0.02. 84.4 ± 2.2. 26.8 ± 0.4. 41.
(51) Table 2.3: Water parameters measurements Dec 2009 with 1 standard error value for experiments conducted. Desired-pCO2 in ppm. pH. Dissolved O2 (% saturated). Temperature (°C). Ambient. 8.13 ± 0.04. 82.1 ± 0.8. 27.5 ± 0.2. 550. 8.05 ± 0.01. 80.5 ± 0.9. 27.6 ± 0.2. 750. 7.96 ± 0 .03. 80.4 ± 1.4. 28.0 ± 0.1. 1000. 7.84 ± 0.02. 78.5 ± 2.7. 27.8 ± 0.1. 42.
(52) Figure 2.1: Time in hours to reach gastrula (mean + SE) in four separate experiments (A = Acropora tenuis, B = A. hyacinthus, C = A. millepora Nov and D = A. millepora Dec) under four acidity treatments (1 = pCO2 of 380ppm, 2 = 550 ppm, 3 = 750 ppm and 4 = 1000 ppm).. 43.
(53) Figure 2.2: Survivorship (mean number of larvae alive ±SE) in three separate experiments (A = A. tenuis, B = A. millepora Nov) under four acidity treatments (Key: 1 = Ambient pCO2, 2 = 550 ppm, 3 = 750ppm and 4 = 1000 ppm).. 44.
(54) Figure 2.3: Metamorphosis (mean % ±SE) in three separate experiments (A = Acropora hyacinthus, B = A. millepora Nov and C = A. millepora Dec) under four acidity treatments (1 = pCO2 of 380ppm, 2 = 550 ppm, 3 = 750 ppm and 4 = 1000 ppm).. 45.
(55) Chapter 3: Effects of ocean acidification on ocean warming on the early life history stages of corals. This chapter was in review in Marine Ecology Progress Series in April 2012.. Introduction: Increasing carbon dioxide (CO2) concentrations in the atmosphere are causing the oceans to warm. Sea surface temperatures have risen by a global average of 0.7 °C since the industrial revolution (Feely et al. 2009) and are predicted to rise by a further 2 to 3 °C by the end of the century under the IPCC A2 scenario (Bindoff et al. 2007, IPCC report). In addition, the absorption of atmospheric CO2 is changing ocean chemistry; decreasing seawater pH and reducing the availability of carbonate ions (CO32-). Ocean pH has decreased by 0.1 units since the 1950s and is projected to decrease by a further 0.2 to 0.3 units by the end of the century (Feely et al. 2009). The effects rising sea surface temperature on marine organisms are well documented. Symbiotic organisms, such as corals, seem particularly sensitive to positive thermal anomalies (Baird et al. 2009), and the resulting coral bleaching has a range of ecological effects from reductions in growth, reproduction and competitive ability to high mortality of individuals over large spatial scales (see review in McClanahan et al. 2004). In contrast, the effects of ocean acidification are less obvious, in part because the effects are often sub-lethal (Fabricius et al. 2011). Early experiments suggested a linear decline in calcification in response to a declining aragonite saturation state (Langdon and Atkinson 2005), however, more recent work indicates that the response is highly variable among species and dependent upon experimental technique (see review in Pandolfi et al. 2011).. 46.
Figure

+7

Outline
Near-future reductions in pH have no consistent ecological effects in the
Effects of ocean acidification on ocean warming on the early life history
Effects of ocean acidification on metamorphosis of larvae of a brooding
Effects of ocean acidification and ocean warming on the growth and
General Discussion
Related documents
The objective of the study was to comparatively assess two clinical rating scales for WD, the Unified Wilson ’ s Disease Rating Scale (UWDRS) and the Global Assessment Scale for
Proposed Framework Form a project team Communicat e objectives to all concerned Confirm the value drivers Define Objective s. Based on the results of data analysis, the
Table 4: Models testing prediction 1, that increasing age order (i.e. living with more older children) will be associated with less time spent in work, and more time spent in
14 Lako and Geda/2011/ Ethiopia Unintended pregnancy among married women in Southern Ethiopia Cross sectional study N=713 About 43 % of the respondent had their recent
The center will focus more time and energy on supporting substance abuse prevention activities in individual congregations and faith- based organizations, and on helping faith-based
Using text mining of first-opinion electronic medical records from seven veterinary practices around the UK, Kaplan-Meier and Cox proportional hazard modelling, we were able to
Célkitûzés: Különbözô egészségügyi területeken dol- gozók (N = 199) körében feltérképezni a kiégés, az érzelmi munka, a megküzdés és a társas támogatás
amphivasal bundles to the center and few collateral bundles to periphery.The petiole exhibits epidermis with regularlly arranged cutinized cells, without
