The impact of weeds and prescribed fire on faunal diversity
180
0
0
Full text
(2) The impact of weeds and prescribed fire on faunal diversity. PhD thesis submitted by. Rickard Abom B.Sc., Cert. Res. Met. James Cook University. For the degree of Doctor of Philosophy College of Marine and Environmental Sciences James Cook University Townsville, Queensland 4811 Australia Submission of the thesis the 20th of October 2015 Awarded the degree of Doctor of Philosophy the 16th of March 2016.
(3) Statement of contribution and declaration on ethics. The data chapter 2 in this thesis include published work in collaboration with Wayne Vogler and Lin Schwarzkopf. However, I have been in charge with project design, obtain research funding, collecting of field data. As well as statistical analyses, synthesis and preparation of manuscripts for submission to peer reviewed journals. All data collected were in line with ethics guidelines for treatment of animals of James Cook University (Animal Ethics Approval Number A1354), and legal requirements of Australia (Scientific Purposes Permit Number WITK05527908).. Signature. Date. ii.
(4) Preface. Publications arising from this thesis Chapter 2 – Abom, R., Vogler, W., Schwarzkopf, L., 2015. Mechanisms of the impact of a weed (grader grass, Themeda quadrivalvis) on reptile assemblage structure in a tropical savannah. Biological Conservation 191:75–82.. Chapter 3 – Abom, R., Schwarzkopf, L., 2016. Reptile responses to prescribed burning in native and weedy tropical savannah grassland. Global Ecology and Conservation 6:58-66.. Chapter 4 – Abom, R., Schwarzkopf, L., (In Review) Mammal responses to fire in a native tropical savannah invaded by a weed (grader grass, Themeda quadrivalvis). Biological Invasions.. Chapter 5 – Abom, R., Schwarzkopf, L., (Submitted) Native mammals perceive a more accurate landscape of fear than introduced species. Animal Behavior.. iii.
(5) Acknowledgements. I am indebted and grateful to all people that have believed in me and my abilities to complete this research and thesis, as well as all the help I have received on this great journey. In particular I would like to thank my supervisor Lin Schwarzkopf that always have shown great interest in my progress as well as her amazing ability to find time and effort to read my many early manuscripts. I also greatly appreciate all your comments (maybe not always at the time received :) which greatly improved my writing. I am grateful for all your knowledge and guidance that you have showed and shared with me. But most importantly, you are an amazing woman, and I am most fortunate to have learnt so much from you. I would also extend my gratitude to Wayne Vogler and Biosecurity Queensland, Department of Agriculture, Fisheries and Forestry for financial support of current research. As well as all the help I have received from Wayne Vogler and Will Green in setting up field sites, digging holes, putting up drift fences, and help with clearing of traps in the early wee hours of the morning. I would also like to extend my gratitude to Nick, Jenni, Will, and Josh Smith at Undara National Park Yarramulla ranger station for extensive in-kind support of quad bikes, fuel, accommodation (the shack on wheels), as well as the great company, and all those pots of gold. I also greatly appreciated the help in the program R from Scott Parsons and Shane Blowes. I would also thank my friends (Mick, Nick, Stefano, Heath, Shane, James, Frenchy, Kate, Erin, Vero, Lina, Claire, Collin, Scott, and Sophie) that have listen to me raving on about my research as well as all the excellent times we have had in sharing the university experience. iv.
(6) Last but not least, I would like to extend my gratitude to my parents Leif and Christina that always have allowed me to pursue my endeavors, even when they were not as clear. They also promoted learning by doing, in that there are no shortcuts, and to master a skill one needs to practice. But most importantly that learning new things is fun and an important part of progress both mentally and for building confidence and creativity. Although in my early years I did not always believe that more schooling equaled more fun. However, today I understand the importance of higher education and that learning is one of life’s great experiences one should be grateful to immerse in.. v.
(7) Abstract. Human mediated transport has allowed some species to extend their range beyond their natural ability to disperse. Many exotic annual grasses are highly adaptable and can establish population in their introduced ranges because they can tolerate high variability in local climatic conditions, annual rainfall, and nutrient availability. The most successful invader grasses transform the ecosystems they invade. Invasive grasses can alter the natural fire frequency by increasing local fuel load, and then they flourish under the new conditions they create. This thesis examines the impacts of the introduced weed grader grass (Themeda quadrivalvis) and fire on vertebrate assemblages in tropical savannahs in northern Queensland, Australia. To determine the effects of weeds and fire, and their interaction, on savannah vertebrates, I conducted a two-year vertebrate fauna survey in tropical savannah woodland at Undara Lava Tubes National Park. My survey sites were carefully chosen to provide me with plots that were not spatially auto correlated, and that included either native grasses, or native grasslands invaded by grader grass. After one year examining the influence of the presence of the weed on vertebrate fauna (reptiles), my sites were burned. I expanded my survey to include more recently burned sites, and continued to survey these through their recovery for 15 months. This allowed me to monitor the recovery of reptile and mammal assemblages after fire. Finally, I conducted an experiment to determine the influence of predation on foraging in mice, using giving-up density experiments. To conduct these experiments, I offered native and introduced mice food items in known quantities in trays, in open and closed environments, and. vi.
(8) determined the amount of time they were willing to forage in these trays, using the amount of food remaining in the trays as a measure of willingness to forage. Invasive grasses are among the worst threats to native biodiversity, but the mechanisms causing negative effects are poorly understood. To investigate the impact of an invasive grass on reptiles, I compared the reptile assemblages that used native kangaroo grass (Themeda triandra), and black spear grass (Heteropogon contortus), to those using habitats invaded by grader grass (Themeda quadrivalvis). There were significantly more reptile species, in greater abundances, in native kangaroo and black spear grass than in invasive grader grass. To understand the sources of negative responses of reptile assemblages to the weed, I compared habitat characteristics, temperatures within grass clumps, food availability and predator abundance among these three grass habitats. Environmental temperatures in grass, invertebrate food availability, and avian predator abundances did not differ among the habitats, and there were fewer reptiles that fed on other reptiles in the invaded than in the native grass sites. Thus, native grass sites did not provide better available thermal environments within the grass, food, or lower predator abundance. Instead I suggest that habitat structure was the critical factor driving weed avoidance by reptiles in this system, and recommend that the maintenance of heterogeneous habitat structure, including clumping native grasses, with interspersed bare ground, and leaf litter are critical to reptile biodiversity.. Land managers often use fire as a management tool, to reduce accumulation of fuel, and by extension, the impact of wildfires on flora, fauna and the built environment. Many grassy weeds are tall, and grow in dense stands with high biomass. Grassy weeds often burn at a higher intensity than native grasses, which may alter the influence of fires on. vii.
(9) fauna. Thus, the response of fauna to fire in weedy environments may be complex. Here I examined reptile and mammal responses to fire in savannah open woodland habitats in native kangaroo and black spear grass habitats, and in habitats invaded by grader grass. I compared reptile richness, abundance and assemblage composition in a group of replicated habitats that had not been burnt for 2 years, directly after they were burned, and up to 15 months after burning, when grasses had regrown. Reptiles are excellent model systems to examine the influence of fire on fauna, because they respond strongly to habitat structural features, and are only moderately vagile. I found that reptile abundance and richness were highest in unburnt habitats (2 years after burning), and greatly reduced in all habitats immediately after burning, most strongly in grader grass. Abundance and richness recovered in all three habitats one year after burning, but assemblage composition had changed. Three skinks and one monitor lizard were present only in the longest unburnt kangaroo grass sites, and their populations did not recover 15 months after burning. In weedy habitats, reptile abundance was more strongly reduced immediately after fire than in other habitats. Even in fire-prone, oftenburnt habitats such as these, in which richness and abundance were not strongly influenced by fire, assemblage composition was. As above, I also examined mammal richness and abundance in replicated unburnt, burnt, and revegetated native and weedy sites. Mammal abundances were higher in unburnt native grasses than in unburnt weedy sites. The lowest mammal abundances occurred in sites revegetated after fire. All mammals, except rufous bettongs (Aepyprymnus rufescens) and tropical short-tailed mice (Leggadina lakedownensis) were reduced in abundance following fire. Eastern chestnut mice (Pseudomys gracilicaudatus) and common planigales (Planigale maculata) returned with returning grass cover. Over the course of my study, I detected a gradual decline in northern viii.
(10) brown bandicoots (Isoodon macrourus). Mammal responses to fire in weeds were idiosyncratic, some species were more abundant in weedy habitats following fire, some less, and some returned to their prior abundance. My study indicated that in, tropical savannahs, a naturally fire-prone habitat, overall mammal abundance, but not richness, decreased with frequent fires (≤ 2 years), in both weeds and native grass, whereas individual species responses varied greatly.. Differential predation risk among habitats, or ‘the landscape of fear’ can have profound impacts on foraging strategies of prey. Few studies, however, have described the landscape of fear in the wild, in relation to actual predator densities. Using giving up density experiments, and vertebrate surveys, I described the landscape of fear of two rodent species in relation to predator abundances in open savannah woodland. I offered native eastern chestnut (Pseudomys gracilicaudatus) and introduced house mice (Mus musculus) food in the open, and under the cover of grass. When eastern brown snakes (Pseudonaja textilis) were absent, both eastern chestnut and house mice consumed more food items under cover. When snakes were present, eastern chestnut mice consumed more food items in the open than under cover. House mice, on the other hand reduced their foraging activity undercover, but did not increase foraging in the open in the presence of snakes. The abundance of other predators did not correlate with food intake in different habitats. Native mice apparently can adjust their antipredator behaviour to remain successful in the presence of native predators.. In conclusion, my study provides the first insights into the responses of reptile and mammal assemblages to native savannah invaded by grader grass, and the interaction between fire and the presence of grader grass. I describe how fauna respond to habitat. ix.
(11) modifications after fire, and after vegetation cover had returned to levels similar to prefire. My study found that reptiles and mammal community composition in these naturally fire-prone savannah systems were sensitive to the presence of the weed, and to frequent fires (≤ 2 years), especially in the weedy parts of the habitat. I suggest managers leave longer intervals between prescribed fire in tropical savannahs, which burn frequently anyway, and suggest that fewer fires might help to maintain faunal biodiversity in fire-prone habitats. I also suggest that decisions to burn weeds should include an awareness of the likelihood of enhancing certain species while discouraging others, and conservation decisions should be based on fire sensitive species given a multi-species response.. x.
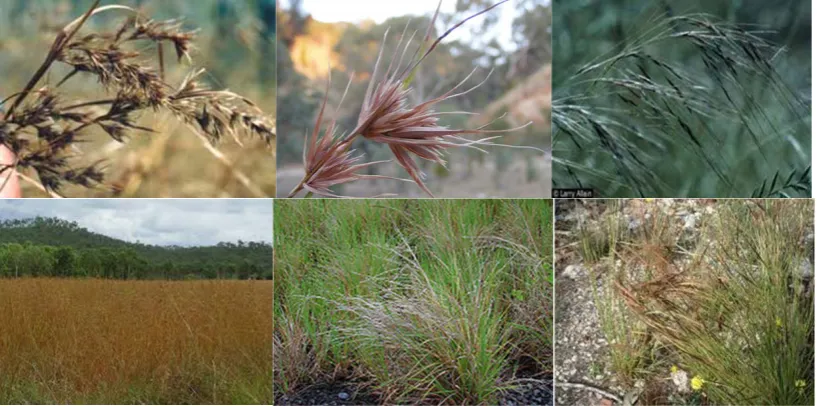
(12) Table of contents. Statement of contribution and declaration on ethics ...................................................ii Preface............................................................................................................................ iii Acknowledgements ........................................................................................................ iv Abstract........................................................................................................................... vi List of Tables ...............................................................................................................xvii List of Figures................................................................................................................ xx CHAPTER 1. GENERAL INTRODUCTION ............................................................. 1 Invasive grasses ............................................................................................................. 1 Invasive grader grass (Themeda quadrivalvis) in Australia .......................................... 3 Figure 1. Distribution map of grader grass (left) from database records, source: Queensland, New South Wales, and Northern Territory Herbariums, and Australian Virtual Herbarium: http://www.chah.gov.au/avh). The potential distribution of grader grass (right) in Australia based on modelling with CLIMEX software. The size of each yellow dot corresponds to the Ecoclimatic Index (EI) value for that location, representing the suitability of the climate for the persistence of grader grass areas with EI values of less than 10 (shown as unfilled circles) are considered only marginally suitable, while those over 30 represent a very favourable climate (with permission to use distribution maps Keir and Vogler 2006). .......................... 5 Figure 2. Pictures show grader (left), kangaroo (middle), and black spear (right) grass, pictures at the top show seed heads and bottom pictures illustrate the growth form of the different grasses. ..................................................................................... 6 Figure 3. Grader grass seed head (left) – spikelets are 4-7mm long, and kangaroo grass seed head (right) – spikelets are 8-14mm long. (Photo credit: Wayne Vogler). ................................................................................................................................... 7 Invasive weeds in fire-prone grasslands ....................................................................... 7 Faunal diversity, invasive weeds, and fire in tropical savannahs ................................. 9 Organisation of data chapters .................................................................................. 13. xi.
(13) CHAPTER 2. MECHANISMS OF THE IMPACT OF A WEED (GRADER GRASS, Themeda quadrivalvis) ON REPTILE ASSEMBLAGE STRUCTURE IN A TROPICAL SAVANNAH ........................................................................................ 15 Introduction ............................................................................................................... 15 Methods ...................................................................................................................... 18 Study system ............................................................................................................... 18 Figure 1. Location of sampling sites (50 x 50m) at Undara volcanic national park (top right corner, box indicate sampling area) and reptile and insect trap array (30 x 30m, bottom left corner) for each site, pitfall traps (open circles), funnel traps (boxes), and insect traps (filled circles). .................................................................. 19 History of sampling sites ............................................................................................. 19 Sampling periods, trap Array, and measurements ...................................................... 20 Statistical analysis ....................................................................................................... 23 Habitat variables.......................................................................................................... 23 Patterns in reptile abundance and richness.................................................................. 23 Reptile assemblage structure in different grasses ....................................................... 24 Relationships between reptile abundance, richness and habitat variables .................. 25 Grass temperatures, insects, and predator abundance ................................................. 26 Results ........................................................................................................................ 26 Habitat description ...................................................................................................... 26 Table 1. Mean % cover (SE) of habitat variables among grass habitats, significant tests are based on tests of relativised transformed data (Tukeys HSD post hoc test P < 0.05*).................................................................................................................... 27 Table 2. Results from an Analyses of Variance comparing mean % cover of habitat variables (relativised transformed) among sampling sites at significant levels (ANOVA, P < 0.05* < 0.001**). ............................................................................ 27 Reptile captures, abundance and richness in different grasses ................................... 28 Table 3. Complete list of reptile species, and number of individuals captured in grader grass (G), kangaroo grass (K), and in black spear grass (S) habitats. Species used as predators of reptiles as indicated *. ............................................................ 28 Figure 2. Standardised (to 100 trap nights) average reptile abundance (A), and richness (B) in grader, kangaroo, and black spear grass habitats ± SE (LSD* = P < 0.05). ........................................................................................................................ 31 Reptile assemblage structure in different grasses ....................................................... 32. xii.
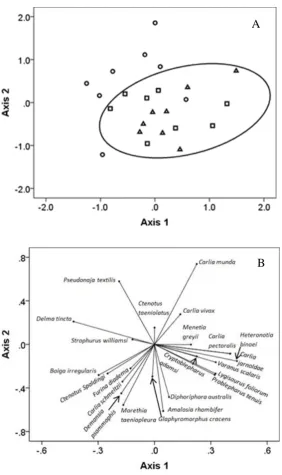
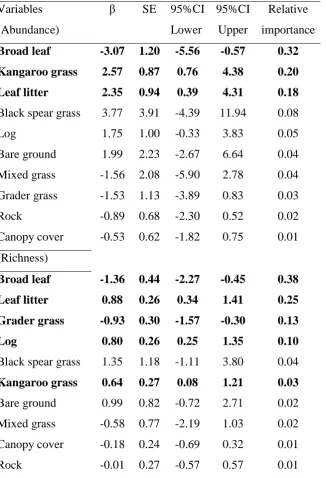
(14) Figure 3. (A) Assemblage structure for 23 species of reptile (relativised by species maximum), shown as a two-dimensional NMDS ordination (stress = 0.218). The first axis represents 43.77% of the variation, and the second axis 25.19%. Symbols: circles = grader grass, triangles = kangaroo grass, and squares =, black spear grass sites. The oval encompasses all native grass sites. (B) The species driving the NMDS results (r2 > 0.20). Carlia munda and Pseudonaja textilis are associated with grader grass sites, while most other species cluster towards native grass sites. ................................................................................................................................. 33 Associations between reptile abundance and richness and habitat variables .............. 34 Figure 4. Predictions (mean = solid line) of the negative influence of broad leaf vegetation cover (which had the strongest influence on both reptile abundance (A) and richness (B) with 95% confidence intervals (grey dotted lines) and model weight (ѡi). .............................................................................................................. 35 Table 4. The influence on reptile abundance and richness of habitat variables and grass types: grader, kangaroo, and black spear grass (random variable). Only models with a ΔAICi ≤ 2 are displayed, number of parameters (K), log likelihood (logLik), corrected AIC (AICc), rank according to best model (ΔAICC), model weight (ѡi), and model deviance explained (R2). ................................................... 36 Table 5. Model-averaged single variable results using habitat characteristics to explain reptile abundance and richness. .................................................................. 37 Grass temperatures, insects, and predator abundance ................................................. 38 Table 6. Untransformed mean volume (ml) insects captured as a measure of food availability, sorted in order except for Gastropoda which is class ± SE. ................ 38 Table 7. Bird species detected in grader grass (G), kangaroo grass (K), and in black spear grass (S), and that consume reptiles. .............................................................. 39 Discussion ................................................................................................................... 40 Differences in habitat structure between invasive and native grass habitats .............. 40 Differences in reptile abundance and richness in invasive and native grass habitats . 41 Mechanisms influencing the abundance and richness of reptiles ............................... 44 Conclusion.................................................................................................................. 47 CHAPTER 3: SHORT-TERM RESPONSES OF REPTILE ASSEMBLAGES TO FIRE IN NATIVE AND WEEDY TROPICAL SAVANNAH ................................. 48 Introduction ............................................................................................................... 48 Methods ...................................................................................................................... 51 Study system ............................................................................................................... 51. xiii.
(15) Figure 1. Location of sampling sites (50 x 50m) at Undara volcanic national park (top right corner, box indicate sampling area) and reptile trap array (30 x 30m, bottom left corner) for each site, pitfall traps (open circles), and funnel traps (boxes). Fire history of sampling sites (lines), park rangers rotationally burn selected areas in the cooler early dry season (April – May) to create a mosaic of burnt (30 – 60%) and unburnt habitats (Queensland’s Fire and Rescue Authority Act 1990). Sampling sites in current study were rotationally burnt every 2 years since 2002 with wildfires in October 2003 which burn the entire park, and in November 2008 which burnt large areas of the park including some sampling sites. Prescribed and wild fires have been excluded from burning the evergreen vegetation in the depressed lava tubes (numerous depressions in map). ................ 53 Survey periods and data collection ............................................................................. 54 Statistical analyses ...................................................................................................... 55 Habitat composition .................................................................................................... 55 Reptile assemblage composition ................................................................................. 56 Table 1. Untransformed catch numbers of 18 common reptile species among unburnt (G, K, S), burnt (GB, KB, SB), and revegetated (GR, KR, SR) – grader, kangaroo, and black spear grass habitats to illustrate trends in species composition with significant indicator species P < 0.05*, P < 0.01** in bold and indicator species approaching significance P = 0.0846^ in italic. .......................................... 57 Results ........................................................................................................................ 59 Habitat composition .................................................................................................... 59 Table 2. Mean untransformed reptile abundance and richness, and averaged percent cover of habitat variables in unburnt (G, K, S), burnt (GB, KB, SB), and revegetated (GR, KR, SR) grass sites and all statistics were performed on relativized data ± 1SE. ............................................................................................. 59 Figure 2. Mean grass cover (%) in dominant grass (black), and in mixed grass (white bars) cover in unburnt, burnt, and revegetated grader (G, GB, GR), kangaroo (K, KB, KR), black spear (S, SB, SR) grass habitats while MANOVA analysis was performed on relativised habitat data, and error bars ± 1SE. ............. 61 Reptile abundance and richness .................................................................................. 62 Figure 3. Untransformed average reptile abundance (GZLM analysis was performed on relativised by maximum reptile abundance data) in unburnt (G, K, S), burnt (GB, KB, SB), and revegetated (GR, KR, SR) habitats in grader (white), kangaroo (grey bars), and black spear (black bars) grass with error bars ± 1 SE. .. 63 Reptile assemblage composition ................................................................................. 64 Figure 4. Two dimensional NMDS ordination (stress = 0.180) with the 18 reptile species (data relativised by maximum). (A) Open symbols = unburnt grass habitats, filled black symbols = burnt habitats, and filled grey symbols = revegetated grass habitats with grass symbols, circles = grader, triangles = kangaroo, and squares = black spear grass, (B) correlations (r2 > 0.20) with the 18 reptile species. ............. 66 Indicator species associated with unburned and burned habitats ................................ 67 xiv.
(16) Table 3. Indicator species (relativized by maximum) analyses with observed indicator value (IV), mean indicator value from randomized groups (± 1 SD) at level of significance with species significantly associated with unburnt kangaroo* grass habitats, one species significantly associated to revegetated kangaroo^ habitats with one species§ approaching significant level in revegetated grader grass habitats. .................................................................................................................... 68 Discussion ................................................................................................................... 68 Habitat structural effects of burning ........................................................................... 69 Reptile assemblage patterns in relation to prescribed fire .......................................... 69 Reptiles and prescribed fire management ................................................................... 73 Conclusion.................................................................................................................. 74 CHAPTER 4. MAMMAL RESPONSES TO FIRE IN A NATIVE SAVANNAH INVADED BY A WEEED (GRADER GRASS, Themeda quadrivalvis).................. 76 Introduction ............................................................................................................... 76 Methods ...................................................................................................................... 78 Study system and sampling periods ............................................................................ 78 Table 1. Untransformed mammal captures in mammal abundance, richness, and individual mammal species. Average habitat cover in percent of unburnt grader (G), kangaroo (K), black spear (S), burnt (GB, KB, SB), and revegetated (GR, KR, SR), all statistics were performed on relativized data, by dividing each variable (mammals and habitat variables) by the maximum of that variable at any sampling site, ± 1SE. ............................................................................................................... 79 Site history, grasses, and fire....................................................................................... 81 Figure 1. Location of sampling sites (50 x 50m) at Undara volcanic national park (top right corner, box indicate sampling area) and mammal trap array (50 x 50m, bottom left corner) for each site, pitfall traps (open circles, n = 5), Elliott traps (boxes, n = 12), and cage traps (filled squares, n = 4). Fire history of sampling sites (lines), park rangers rotationally burn selected areas in the cooler early dry season (April – May) to create a mosaic of burnt (30 – 60%) and unburnt habitats (Queensland’s Fire and Rescue Authority Act 1990). Sampling sites in current study were rotationally burnt every 2 years since 2002 with wildfires in October 2003 which burn the entire park, and in November 2008 which burnt large areas of the park including some sampling sites. Prescribed and wild fires have been excluded from burning the evergreen vegetation in the depressed lava tubes (numerous depressions in map). .............................................................................. 82 Habitat and mammal sampling protocol ..................................................................... 84 Statistical analyses ...................................................................................................... 85 Habitat and mammal analyses ..................................................................................... 85 Results ........................................................................................................................ 88 Habitat composition .................................................................................................... 88. xv.
(17) Figure 2. (A) Vegetation structure in relation to habitat variables (relativised by maximum % cover) as a two-dimensional NMDS ordination (stress = 0.086). The first axis represents 58.43% of the variation, and the second axis 32.00%. Symbols; unburnt (open), burnt (filled), and revegetated (grey) with grader = circles, kangaroo = triangles, and black spear grass = squares. (B) Habitat variables driving the NMDS results (r2 > 0.20). .................................................................................. 89 Mammal assemblages and habitat variables ............................................................... 90 Movement among sites ............................................................................................... 90 Responses of mammals to fire .................................................................................... 91 Figure 3. Estimates of mean mammal abundances (untransformed and standardised to 100 trap nights) (GZLM) in grader (grey), kangaroo (pale), and black spear (black bars) grasses ± SE, zero values = no animals captured, and note that y-axis values vary among figures. ...................................................................................... 93 Possible reasons for responses to fire: habitat features influencing mammal abundance and richness ............................................................................................... 94 Table 2 Model output for overall mammal abundance, richness, and individual species abundances, with treatment (unburnt, burnt, and revegetated dominant grader, kangaroo, and black spear grass sites) included as a random effect. Models with Δi ≤ 2 are displayed with the number of parameters (K), log likelihood (LogLik), corrected AIC (AICc), rank according to best model (ΔAICC), and model weight (ѡi). .............................................................................................................. 95 Figure 4. Model average coefficient estimates with 95% confidence intervals. Habitat variables that do not overlap zero indicate factors with high influence. .... 98 Discussion ................................................................................................................... 99 How did fire influence habitat? ................................................................................... 99 How did fire and weeds influence mammals? .......................................................... 100 Conclusion................................................................................................................. 102 CHAPTER 5. NATIVE MAMMALS PERCEIVE A MORE ACCURATE LANDSCAPE OF FEAR THAN INTRODUCED SPECIES ................................. 104 Introduction ............................................................................................................. 104 Methods .................................................................................................................... 106 Study area and sampling period ................................................................................ 106 Table 1. Untransformed survey abundances of predatory birds, mammals, and reptiles among sampling sites (no nocturnal predatory birds were observed). ..... 107 Study species ............................................................................................................. 108 Foraging arenas ......................................................................................................... 108 Figure 1. Foraging house mice (M. musculus - left) and Eastern chestnut mice (P. gracilicaudatus - right) in the giving-up density experimental arenas. Sizes of the two species are relative (M. musculus is much smaller than P. gracilicaudatus). 109 Statistical analysis ..................................................................................................... 110 xvi.
(18) Results ...................................................................................................................... 111 Table 2. Model output of mealworms consumed (SQRT transformed) by mice as the target variable and predictors distance to cover (under cover of grass and in the open), snake (mean abundance of eastern brown snakes), mice species (eastern chestnut and house mice), and interaction effects. Models are displayed according to model fit with number of parameters (K), log likelihood (logLik), corrected AIC (AICc), and rank according to best model (ΔAICC), model weight (ѡi). ............. 112 Table 3. The best model output for predictor variables and interaction effects to explain foraging behaviour (the number of grams of mealworms left in foraging trays, or giving up densities) in native eastern chestnut and introduced house mice in a natural grassland. ............................................................................................ 114 Figure 2. Mean relative differences in grams of mealworms consumed by introduced house mice (M. musculus – broken line) and native eastern chestnut mice (P. gracilicadatus - solid line) under cover (below), and in the open (above the 0 consumption line) (error bars ±1SE), illustrating the shift shown by Eastern chestnut mice from foraging under cover to foraging in the open as snakes become more numerous in the habitat. ............................................................................... 116 Discussion ................................................................................................................. 116 Conclusion................................................................................................................ 120 CHAPTER 6. GENERAL DISCUSSION................................................................. 121 Impacts of invasive weeds on reptile diversity ......................................................... 121 Reptile and mammal responses to frequent burns..................................................... 123 Rodents’ landscape of fear ........................................................................................ 125 Management Implications ......................................................................................... 127 Future Directions ....................................................................................................... 128 REFERENCES ........................................................................................................ 131 APPENDICES ......................................................................................................... 155 Appendix 1. ............................................................................................................... 155 Figure A1. Predicted mealworms consumed (square root transformed) by eastern chestnut mice under grass cover (A), and in the open (B), and by house mice under grass cover (C) and in the open (D) with 95% confidence intervals (dotted line).155 Appendix 2. ............................................................................................................... 156 Figure A2. Predicted difference in mealworms consumed (square root transformed) by rodents in grams (SQRT), eastern chestnut (top line), and house mice (bottom line) with 95% confidence levels (dotted lines). ................................................... 156 Appendix 3. ............................................................................................................... 156 Published as: Hacking, J., Abom, R., Schwarzkopf. L., (2014). Why do lizards avoid weeds? Biological Invasions 16:935–947. .................................................. 156. xvii.
(19) List of Tables. CHAPTER 2. Table 1. Mean % cover (SE) of habitat variables among grass habitats ........................ 27 Table 2. Results from an Analyses of Variance comparing mean % cover of habitat variables. ......................................................................................................................... 27 Table 3. Complete list of reptile species, and number of individuals captured in grader grass (G), kangaroo grass (K), and in black spear grass (S) habitats.. ........................... 28 Table 4. The influence on reptile abundance and richness of habitat variables and grass types. ............................................................................................................................... 36 Table 5 Model-averaged single variable results using habitat characteristics to explain reptile abundance and richness. ...................................................................................... 37 Table 6. Untransformed mean volume (ml) insects captured as a measure of food availability. ..................................................................................................................... 38 Table 7. Bird species detected in grader grass (G), kangaroo grass (K), and in black spear grass (S), and that consume reptiles. ..................................................................... 39. CHAPTER 3. Table 1. Untransformed catch numbers of 18 common reptile species among unburnt (G, K, S), burnt (GB, KB, SB), and revegetated (GR, KR, SR) – grader, kangaroo, and black spear grass habitats. ............................................................................................... 57 Table 2. Mean untransformed reptile abundance and richness, and averaged percent cover of habitat variables in unburnt (G, K, S), burnt (GB, KB, SB), and revegetated (GR, KR, SR) grass sites. ............................................................................................... 59 Table 3. Indicator species analyses. ................................................................................ 68. xviii.
(20) CHAPTER 4. Table 1. Untransformed mammal captures in mammal abundance, richness, and individual mammal species. Average habitat cover in percent of unburnt grader (G), kangaroo (K), black spear (S), burnt (GB, KB, SB), and revegetated (GR, KR, SR) grass sites. ....................................................................................................................... 79 Table 2 Model output for overall mammal abundance, richness, and individual species abundances, with treatment (unburnt, burnt, and revegetated dominant grader, kangaroo, and black spear grass sites). ........................................................................... 95. CHAPTER 5. Table 1. Untransformed survey abundances of predatory birds, mammals, and reptiles among sampling sites .................................................................................................... 107 Table 2. Model output of mealworms consumed by mice. ........................................... 112 Table 3. The best model output for predictor variables and interaction effects to explain foraging behavior. ......................................................................................................... 114. xix.
(21) List of Figures. CHAPTER 1. Figure 1. Distribution map of grader grass (left) from database records, source: Queensland, New South Wales, and Northern Territory Herbariums, and Australian Virtual Herbarium: http://www.chah.gov.au/avh).. .......................................................... 5 Figure 2. Pictures show grader (left), kangaroo (middle), and black spear (right) grass, pictures at the top show seed heads and bottom pictures illustrate the growth form of the different grasses. ............................................................................................................... 6 Figure 3. Grader and kangaroo grass seed heads. ............................................................. 7. CHAPTER 2. Figure 1. Location of sampling sites (50 x 50m) at Undara volcanic national park (top right corner, box indicate sampling area) and reptile and insect trap array (30 x 30m, bottom left corner) for each site, pitfall traps (open circles), funnel traps (boxes), and insect traps (filled circles). .............................................................................................. 19 Figure 2. Standardised (to 100 trap nights) average reptile abundance (A), and richness (B) in grader, kangaroo, and black spear grass habitats ± SE (LSD* = P < 0.05). ........ 31 Figure 3. (A) Assemblage structure for 23 species of reptile (relativised by species maximum), shown as a two-dimensional NMDS ordination (stress = 0.218). The first axis represents 43.77% of the variation, and the second axis 25.19%. Symbols: circles = grader grass, triangles = kangaroo grass, and squares =, black spear grass sites. The oval encompasses all native grass sites. (B) The species driving the NMDS results (r2 > 0.20).. .............................................................................................................................. 33 Figure 4. Predictions of the negative influence of broad leaf vegetation cover which had the strongest influence on both reptile abundance (A) and richness (B) ........................ 35. xx.
(22) CHAPTER 3. Figure 1. Location of sampling sites (50 x 50m) at Undara volcanic national park (top right corner, box indicate sampling area) and reptile trap array (30 x 30m, bottom left corner) for each site, pitfall traps (open circles), and funnel traps (boxes). Fire history of sampling sites (lines), park rangers rotationally burn selected areas in the cooler early dry season (April – May) to create a mosaic of burnt (30 – 60%) and unburnt habitats (Queensland’s Fire and Rescue Authority Act 1990).. ................................................... 53 Figure 2. Mean grass cover (%) in dominant grass (black), and in mixed grass (white bars) cover in unburnt, burnt, and revegetated grader (G, GB, GR), kangaroo (K, KB, KR), black spear (S, SB, SR) grass habitats ................................................................... 61 Figure 3. Untransformed average reptile abundance (GZLM analysis was performed on relativised by maximum reptile abundance data) in unburnt (G, K, S), burnt (GB, KB, SB), and revegetated (GR, KR, SR) habitats in grader (white), kangaroo (grey bars), and black spear (black bars) grass. ................................................................................. 63 Figure 4. Two dimensional NMDS ordination (stress = 0.180) with the 18 reptile species (data relativised by maximum). (A) Open symbols = unburnt grass habitats, filled black symbols = burnt habitats, and filled grey symbols = revegetated grass habitats with grass symbols, circles = grader, triangles = kangaroo, and squares = black spear grass, (B) correlations (r2 > 0.20). ......................................................................... 66. CHAPTER 4. Figure 1. Location of sampling sites (50 x 50m) at Undara volcanic national park (top right corner, box indicate sampling area) and mammal trap array (50 x 50m, bottom left corner) for each site, pitfall traps (open circles, n = 5), Elliott traps (boxes, n = 12), and cage traps (filled squares, n = 4). Fire history of sampling sites (lines), park rangers rotationally burn selected areas in the cooler early dry season (April – May) to create a mosaic of burnt (30 – 60%) and unburnt habitats (Queensland’s Fire and Rescue Authority Act 1990).. ...................................................................................................... 82 Figure 2. (A) Vegetation structure in relation to habitat variables (relativised by maximum % cover) as a two-dimensional NMDS ordination (stress = 0.086). The first axis represents 58.43% of the variation, and the second axis 32.00%. Symbols; unburnt (open), burnt (filled), and revegetated (grey) with grader = circles, kangaroo = triangles, and black spear grass = squares. (B) Habitat variables driving the NMDS results (r2 > 0.20). ............................................................................................................................... 89 xxi.
(23) Figure 3. Estimates of mean mammal abundances (untransformed and standardised to 100 trap nights) (GZLM) in grader (grey), kangaroo (pale), and black spear (black bars) grasses ± SE, zero values = no animals captured, and note that y-axis values vary among figures. ................................................................................................................ 93 Figure 4. Model average coefficient estimates with 95% confidence intervals. Habitat variables that do not overlap zero indicate factors with high influence. ........................ 98. CHAPTER 5. Figure 1. Foraging house mice and eastern chestnut mice in the giving-up density experimental arenas. ..................................................................................................... 109 Figure 2. Mean relative differences in grams of mealworms consumed by introduced house mice and native eastern chestnut mice under cover and in the open, illustrating the shift shown by eastern chestnut mice from foraging under cover to foraging in the open as snakes become more numerous in the habitat. ................................................ 116 Figure A1. Predicted mealworms consumed by eastern chestnut mice under cover (A), and in the open (B), and by house mice under cover (C) and in the open (D). ............ 155 Figure A2. Predicted difference in mealworms consumed (square root transformed) by rodents in grams, eastern chestnut and house mice ...................................................... 156. xxii.
(24) CHAPTER 1. GENERAL INTRODUCTION. Human mediated transport has allowed some species to extend their range beyond their natural ability to disperse (Vitousek et al., 1996). Highly successful invader species have the ability to transform the ecosystem they invade and cause large-scale habitat degradation (D’Antonio and Vitousek 1992; Vitousek et al., 1996; DiTomaso 2000; Pimentel et al., 2005; Kier and Vogler 2006; Arim et al., 2012; Setterfield et al., 2014). There are many different types of invasive weeds with different growth structures, such as woody weeds, shrubs, legumes, cactus, annual and perennial grasses (Brown and Carter 1998; Clarke et al., 2005; Keir and Vogler 2006; Rahlao et al., 2009; Bateman and Ostoja 2012; Kuebbing et al., 2014; Novoa et al., 2014), and therefore it is difficult to generalise the effects of invasive vegetation in native systems (Arim et al., 2012). Hence, I will focus on invasive grasses, in particular grader grass (Themeda quadrivalvis), and how invasive grasses shape native grassland systems by changing fuel conditions; flourishing under the new conditions they create. I will also address how fauna may respond to invasive grasses and novel fire regimes caused by weeds.. Invasive grasses Invasive grasses are among the worst threats to natural ecosystems, because they can rapidly change the ecosystem they invade (D’Antonio and Vitousek 1992). Exotic grasses can often tolerate high variability in resources such as water and nutrients (Keeley et al., 2003; Keir and Vogler 2006; Alba et al., 2015). Traits that make invasive grasses successful invader species are their ability to rapidly germinate, high seedling. 1.
(25) vigour and growth rate, prolific seed production, and significantly taller growth form compared to native perennial grasses (McIvor and Howden 2000; DeFalco et al., 2003; Setterfield et al., 2005; Keir and Vogler 2006; Han et al., 2008; Vogler and Owen 2008; Chapter 2 this thesis). Invasive grasses often outcompete native grasses by overgrowing them, reducing solar radiation reaching the ground, and altering soil water and nutrient availability (Vogler and Owen 2008; Wilsey et al., 2009). Once invasive grasses are established, they often alter and simplify the native habitat structure by growing closer together, reducing floral diversity (Hughes et al., 1991; Tews et al., 2004; Kutt and Kemp 2012; Lindsay and Cunningham 2012). Annual invasive grass species also produce higher biomass than native perennial grasses, which reduces habitat heterogeneity in invaded communities (Wilsey et al., 2009; Price et al., 2010; Lindsay and Cunningham 2012; Alba et al., 2015). Disturbance caused by the introduction of exotic grasses has increased in all major grassland communities worldwide. The invasive grass (Melinis minutiflora) in the Brazilian Cerrado savannah reduced tree seedling survival in invaded plots (Hoffman and Haridasan 2008), and invasive Johnson grass (Sorghum halepense) reduced native grass dominance in a tall grass prairie in North America (Rout et al., 2013). There may be reduced establishment of invasive grasses in African savannah, because of grazing from large herbivores (Musil et al., 2005; Foxcroft et al., 2010). Even in Africa, however, invasive purple fountain grass (Pennisetum setaceum) promotes fire in otherwise fire-free arid shrub zones, increasing the spread of this grass in South Africa (Rahlao et al., 2009). Invasive grasses have the ability to alter ecosystem processes by growing in monocultures, simplifying habitat structure, and suppressing native grass germination by forming dense stands and weed mats (D’Antonio and Vitousek 1992; Mack et al., 2.
(26) 2000; Ridenour and Callaway 2001; Ogle et al., 2003; Bower et al., 2014). In spite of these profound effects, the simple removal of invasive grasses is not always a good route to restoration of native habitats, because removal of invasive grasses creates bare ground, which depletes soil moisture, and dramatically increases light levels, causing a hostile environment for native grass recruitment (D’Antonio et al., 1998). A study by D’Antonio et al., (1998) demonstrated that the removal of exotic weeds did not increase new species recruitment in low diversity and slow growing perennial grassland in Hawaii. Corbin and D’Antonio (2004), however, found that within two years of establishment, the presence of native perennial bunchgrass reduced exotic grass growth, suggesting that increases in cover of native vegetation can sometimes increase resilience, and reduce invasive grass establishment. Where possible, land managers should support decisions that promote re-establishment of native grasses (Corbin and D’Antonio 2004; Fridley et al., 2007; Cook and Grice 2013).. Invasive grader grass (Themeda quadrivalvis) in Australia Grader grass (Themeda quadrivalvis) is typical of an annual invasive grassy weed in many ways. It is common in disturbed systems worldwide, occurring in the United States, New Caledonia, Southeast Asia, Papua New Guinea, the Middle East and tropical America, often as a noxious weed (Keir and Vogler, 2006). After its accidental introduction to Australia in the 1930s from India (Bishop 1981), grader grass spread quickly across large regions of central and northern Queensland, Northern Territory, and northern Western Australia, and the climatic conditions in Australia are favourable for grader grass to spread more (Fig. 1; Keir and Vogler 2006).. 3.
(27) 4.
(28) Figure 1. Distribution map of grader grass (left) from database records, source: Queensland, New South Wales, and Northern Territory Herbariums, and Australian Virtual Herbarium: http://www.chah.gov.au/avh). The potential distribution of grader grass (right) in Australia based on modelling with CLIMEX software. The size of each yellow dot corresponds to the Ecoclimatic Index (EI) value for that location, representing the suitability of the climate for the persistence of grader grass areas with EI values of less than 10 (shown as unfilled circles) are considered only marginally suitable, while those over 30 represent a very favourable climate (with permission to use distribution maps Keir and Vogler 2006).. Grader grass is a tall (> 2m) fast-growing, annual grass, which seeds prolifically and germinates rapidly. Mature grader grass is reddish to golden in colour and is rigid, fibrous, and unpalatable to native and domestic herbivores (Fig. 2; McIvor and Howden 2000; Keir and Vogler 2006). At Undara National Park, the study area, grader grass grows in areas where the native grasses are dominated by the congener native Kangaroo grass (Themeda triandra), and black spear grass (Heteropogon contortus). Although native perennial kangaroo grass is similar in appearance to grader grass, both mature kangaroo and black spear grass are much shorter (< 1.5m) than mature grader grass (Fig. 2; McIvor and Howden 2000; Keir and Vogler 2006). Kangaroo and black spear grass grow in clumps, or hummocks, spaced at regular intervals in open woodland, whereas grader grass emerges as a single stolon, and grows in a sward rather than hummocks (Fig. 2).. 5.
(29) Figure 2. Pictures show grader (left), kangaroo (middle), and black spear (right) grass, pictures at the top show seed heads and bottom pictures illustrate the growth form of the different grasses.. Black spear grass develops a characteristic black seed-head with a long awn at one end and a sharp spike at the other, whereas kangaroo grass is similar in morphology to its congener grader grass, kangaroo grass has longer spikelets than grader grass (Fig. 3). However, grader grass produce three times more biomass than native kangaroo and black spear grass, and to reduce the accumulation of grader grass, land managers most frequently use fire (Keir and Vogler 2006; Vogler and Owen 2008).. 6.
(30) Figure 3. Grader grass seed head (left) – spikelets are 4-7mm long, and kangaroo grass seed head (right) – spikelets are 8-14mm long. (Photo credit: Wayne Vogler).. Invasive weeds in fire-prone grasslands Weeds and fire are major, non-independent forces shaping vegetation composition and structure in naturally fire-prone tropical savannahs (D’Antonio and Vitusek 1992; Foxcroft et al., 2010; Lindsay and Cunningham 2012; Alba et al., 2015). In general, grass-dominated systems are relatively flammable, with the ability to recover rapidly following the fire (Foxcroft et al., 2010; Setterfield et al., 2014; Alba et al., 2015). Land managers often use fire as a management tool to both reduce weed encroachment, and decrease fuel loads caused by weeds (Emery and Gross 2005; Price et al., 2012). However, fires fuelled by invasive grasses burn hotter and more intensely than native grass fires, potentially creating severe fires at times and places where natural fires do not occur, or are not so intense, causing a positive feedback cycle in which more homogenous grass cover promotes fire, which in turn promotes a more rapid spread of weeds (D’Antonio and Vitousek 1992; Corbett et al., 2003; D’Antonio and Hobbie 2005; Setterfield et al., 2010). 7.
(31) The conditions that favour fire occur frequently in grasslands, and invasive annual grasses recover more rapidly than native species, which increases grassland susceptibility to fire (D’Antonio and Vitousek 1992). Invasive grasses change vegetation flammability, and cause an increase in fire severity (Keeley et al., 2003; Setterfield et al., 2010; Russel-Smith et al., 2012; Alba et al., 2015). For example, invasion by beard grass (Andropogon guyanus) in an Australian tropical savannah increased fuel load, causing hotter fires (Rossiter et al., 2003; Setterfield et al., 2010). Fuels are one ecosystem component linked with fire by feedback loops, and shifts outside the natural range of fuel conditions can result in directional shifts in fire regimes (Rossiter et al., 2003; Brooks et al., 2004). New fire regimes are coupled with localized losses of native plant species, especially reducing fire-sensitive flora, which creates opportunities for non-native grasses to expand (D’Antonio et al., 1999; Keeley et al., 2003; Brooks et al., 2004; Foxcroft et al., 2010; Alba et al., 2015). A review by Keeley (2006) showed that invasive grass cover increased with frequent fires. More frequent grass fires increase burn area, and hotter burns reduce the availability of bushes, logs, hollows and tree trunks in these habitats (Hughes et al., 1991; Hoffman et al., 2004; Setterfield et al., 2010; Haslem et al., 2011; Russel-Smith et al., 2012; Tng et al., 2014). Reducing burning of invasive grasses to prevent such effects can be problematic, however, because it may cause more severe fires when fires do occur (Murphy and Russell-Smith 2010). In general, invasive grasses cause altered fire regimes by changing fuel conditions, and then they flourish under the new conditions they create (Brooks et al., 2004). Fire frequency increases with invasive grass establishment, and many weedy grasses in Northern Australia support frequent, high intensity fires (< 1 year between fires, Rossiter et al., 2003). Yates et al., (2008) showed that Australian savannahs are 8.
(32) vulnerable to large-scale and frequent fires. The increase in fuel load and rapid germination following fire by beard grass has substantially amplified the fire season in Northern Australia, increasing fire management costs (Setterfield et al., 2014). Similarly, the increase in fuel load by invasive grasses in Hawaii increased the fire frequency more than threefold, and cheat grass (Bromus tectorum) invasion caused a tenfold increase in fire frequency in North America (Hughes et al., 1991; Milton 2004; Bradley et al., 2006). Although reversing fire frequency is costly and labour intense, one way would be to remove annual exotic grasses and re-seed with native vegetation combined with the exclusion of fire (Keeley 2001; Milton 2004; Vogler and Owen 2008; Setterfield et al., 2014; Yelenik et al., 2015). Restoring native habitats invaded by exotic grasses by revegetation of native plants may reduce the fuel load, which over time may reduce the fire return frequency (Cione et al., 2002).. Faunal diversity, invasive weeds, and fire in tropical savannahs The diversity of reptiles and small mammals is often reduced in habitats invaded by weeds (Martin and Murray 2011; Litt and Steidl 2011; Chapter 2). The negative influence of weeds on reptiles may be driven by a variety of factors. Food availability may be reduced in weeds (Valentine 2006; Martin and Murray, 2011), predators may be more abundant or more successful in weeds (e.g., Thompson 1987), habitat structure of weeds may alter behaviour, affecting movement and social interactions (Newbold, 2005; Downes and Hoefer, 2007; Rieder et al., 2010; Steidl et al., 2013; Hacking et al., 2014), or reducing opportunities for thermoregulation (Valentine 2006; Downes and Hoefer, 2007; Carter et al., 2014; Hacking 2014). For mammals, areas with high seed output such as weeds and crop fields can often harbour higher densities of rodents. 9.
(33) (Ylönen et al., 2002; Litt and Steidl 2011), whereas medium-sized mammals’ mobility in dense weeds may be much reduced (McGregor et al., 2013). An increase in fire intensity by invasive grasses, at times when natural fires seldom occur, may delay flowering events and reduce insect availability, which may negatively impact small vertebrates (Corbett et al., 2003; Radford and Andersen 2012; Kwok & Eldridge 2015). Hotter fires can consume more vegetation, promoting grass dominance, which may change faunal resource dynamics, effecting food availability, shelter opportunities, and predator susceptibility in native fauna (Barnard 1987; D’Antonio and Vitousek 1992; Valentine et al., 2007; Parker-Allie et al., 2009; Pastro et al., 2011; Penman et al., 2011; McGregor et al., 2014). In addition, hotter fires from more intense burns may increase mortality rates in small vertebrates (Griffiths and Christian 1996; Barlow and Peres 2004; Smith et al., 2012; Cross et al., 2015). Repeated fires may reduce a species’ geographic range, and fire-sensitive species may become locally extinct (Parr and Andersen 2006; Driscoll and Henderson 2008; Penman et al., 2011; Russel-Smith et al., 2012). On the other hand, tropical savannah ecosystems are shaped by natural fires and are highly diverse, suggesting that the fauna of tropical savannahs are resilient to naturally occurring fires (Woinarski et al., 2004; Andersen et al., 2005; Pianka et al., 2012). Even in communities highly resilient to fire, however, increased fire frequency and intensity altered by invasive weeds can open the understory vegetation structure in savannahs and open woodlands, negatively impacting fauna that shelter in dense grasses (Barlow and Peres 2004; Yates et al., 2008; Robinson et al., 2013; Smith et al., 2013; Burgess et al., 2014; Alba et al., 2015). High intensity fire in weeds may also negatively affect reptiles more than grass fires in native habitats, because reptiles in native savannah may prefer the habitat structure and composition created by the low intensity fires characteristic of native savannah 10.
(34) (Braithwaite 1987; Friend 1993; Trainor and Woinarski 1994; Singh et al., 2002a; Corbett et al., 2003; Pastro et al., 2011; Pianka et al., 2012). Small to medium-sized mammal species are also sensitive to frequent fires and gradually decline, or suddenly collapse in abundance, in habitats with repeated burning with slow recovery rates after fire (Pardon et al., 2003; Andersen et al., 2005; Converse et al., 2006; Horn et al., 2012; Francl and Small 2013; Griffiths and Brook 2014; Kelly et al., 2014; Griffiths et al., 2015; Mendonça et al., 2015; Radford et al., 2015). Some mammals avoid burnt habitats and occur in lower abundances after fire, returning with emerging vegetation cover (Clarke and Kaufman 1990; Vieira 1999; Breed and Ford 2007; Bock et al., 2011; Kirchner et al., 2011). Changing fire regimes, in association with changing land use and weed encroachment, are suspected of causing declines in small and medium weightrange mammals in Australia (Johnson 2006; Griffiths and Brook 2014; Radford et al., 2015). Many birds can easily move away from burnt grass habitats, but frequent fires in habitats invaded by weeds promote a shift in the bird assemblage, causing an increase in abundances of granivorous and omnivorous birds following fire (Woinarski 1990; Valentine et al., 2012). A more heterogeneous habitat with a more structurally complex vegetation gradient may moderate the effects of fire on bird communities (Barton et al., 2014; Hovick et al., 2014; Burgess and Maron 2015). The response of reptiles and mammals to weeds and fire may be complex and potentially influenced by their ability to disperse, in contrast to bird assemblages. There are gaps in the literature on the impacts of invasive weeds on fauna, and few studies have investigated the underlying mechanisms causing negative effects of weeds on vertebrate communities (Valentine 2006; Hacking et al., 2014). Land managers use fire to reduce weeds, but studies of the effects of fire in weedy habitats often focus on the response of native flora following fire (Alba et al., 2015). Few studies investigate 11.
(35) faunal responses directly and shortly (≤ 2 years) after fire, and even fewer studies have investigated individual species response before, directly after, and shortly after fire after vegetation cover has returned. Hence, to make informed management decisions in fireprone, weed infested systems, it is important to understand the response of these ecosystems (including fauna) to intense and frequent fires. It is equally important to understand how native fauna use weedy habitats by investigating key changes that may be caused by weeds that could influence fauna, including influences of weeds on structural complexity, food availability, thermal regimes, and predator densities. In this study I will investigate the influence of these factors on vertebrate (reptile) community composition and individual species responses. I provide the first study investigating faunal responses to native savannah invaded by grader grass. I describe the influence of grader grass on reptile species assemblage composition in native and weedy grass habitats, and I examined factors that might influence reptile habitat use. I quantified habitat characteristics likely to be used by reptiles (such as grass spacing, and amounts of various habitat features such as logs and leaf litter) (e.g., Jellinek et al., 2004). I measured environmental temperatures within grass clumps, because reptiles are ectotherms, and temperature is a critical feature determining habitat use (e.g., Taylor and Fox 2001). I also quantified food availability, by assessing the overall biomass of invertebrates in the different grasses types (e.g., Diaz and Carrascal 1991; Christie et al., 2013). Finally, because predation may influence the use of habitat by reptiles (e.g., Diaz and Carrascal 1991), I determined the abundance of avian and reptilian predators of reptiles in the native and grader-grass-infested savannah. I describe reptile and mammal responses to fire, because these two groups are highly abundant, and typically respond strongly to habitat disturbances (Braithwaite 1987, Litt and Steidl 2011; Pianka et al., 2012, Smith et al., 2013, Hacking et al., 2014). I 12.
(36) compared reptile and mammal assemblage composition in native and weedy habitats before, immediately after, and up to fifteen months after prescribed burning, to determine if there were detectable changes in assemblage composition and habitat complexity. This research provided insight into the resilience of tropical Australian reptile and mammal populations to fire in the short-term, in different habitats. Determining the short-term effects of fire is highly relevant in environments that burn very frequently (often more than once per year, Price et al., 2012). Finally, predation risk can have profound impacts on foraging strategies of prey organisms, and it is of great importance to an individual to identify and respond specifically to particular predators to avoid predation. Here I investigated rodents’ perceived risk of predation by offering a depletable food source under grass cover and in the open (away from grass) in habitats with a known predator structure and measures of actual predator abundance.. Organisation of data chapters To investigate the effects of invasive weeds and fire on native faunal community assemblage structure in native tropical savannah, and I addressed specific questions. My thesis chapters are structured as a series of stand-alone publications that are connected by theory and is organised as follows. First, I determined the use of native and invasive grader grass (Themeda quadrivalvis) by reptiles, and identified the key mechanisms that influenced reptile diversity in these habitats (Chapter 2). Then I determined the impact of fire on faunal assemblages, comparing reptile (Chapter 3) and mammal (Chapter 4) assemblages in habitats that were unburnt (not burnt for 2 years), directly after burning, and when grasses had returned pre-fire levels 15 months after 13.
(37) fire, in native and in native savannah invaded by grader grass. In Chapter 5, I described the landscape of fear of rodents in relation to actual predator abundances in a tropical savannah. Finally, I discuss my findings including management recommendations and future research directions (Chapter 6). I include a paper authored with an honours student (Hacking et al., 2014) as an appendix. I helped this student conduct this study, and it formed an important part of my PhD study.. 14.
(38) CHAPTER 2. MECHANISMS OF THE IMPACT OF A WEED (GRADER GRASS, Themeda quadrivalvis) ON REPTILE ASSEMBLAGE STRUCTURE IN A TROPICAL SAVANNAH. Published as: Abom, R., Vogler, W., Schwarzkopf. L., (2015). Mechanisms of the impact of a weed (grader grass, Themeda quadrivalvis) on reptile assemblage structure in a tropical savannah. Biological Conservation 191:75–82.. Introduction Invasions by non-native grasses are among the worst threats to natural habitats; because they can rapidly change the ecosystem they invade (D’Antonio and Vitousek 1992). Non-native annual grasses can often tolerate high variability in resources such as water and nutrients, and can have rapid germination rates, higher seedling vigour and growth rate, and they may grow significantly taller than native perennial grasses (McIvor and Howden 2000; Setterfield et al., 2005; Keir and Vogler 2006; Vogler and Owen 2008). These and other mechanisms make annual exotic grasses successful invaders that can outcompete native perennial grasses (Vogler and Owen 2008; Wilsey et al., 2009). Once they have established, invasive grasses often alter and simplify habitat structure, because they may have different growth forms and high biomass, growing closer together, and change leaf litter composition, reducing native leaf litter load (Hughes et al., 1991; Tews et al., 2004; Kutt and Kemp 2012; Lindsay and Cunningham 2012).. 15.
(39) Tropical savannah reptiles provide an excellent study system with which to examine the influence of grassy weeds on vertebrate assemblages, because reptiles have high species richness, and can occur in high abundances (Braithwaite 1987). They often respond quickly to habitat structural alterations such as weed establishment, and have small home ranges and low vagility compared to birds and large mammals, which may make their responses more immediate and easier to measure (Pianka 1967; Valentine et al., 2007; Price et al., 2010; Gainsbury and Colli 2014). Weeds often have negative influences on reptile assemblage composition (reviewed by Martin and Murray 2011), but not always (e.g., Fischer et al., 2003; Garden et al., 2007). The influence of weeds on reptile assemblage composition and abundance may be driven by a variety of factors. Food availability may be altered in weeds (Valentine 2006; Martin and Murray 2011), predators may be more abundant or more successful in weeds (e.g., Thompson 1987), habitat structure of weeds may alter behaviour, such as movement and social interactions (Newbold 2005; Downes and Hoefer 2007; Rieder et al., 2010; Steidl et al., 2013), or influence thermoregulation (Valentine 2006; Downes and Hoefer 2007). Studies examining the likely sources of the impacts of weeds are required to predict the effects of weeds in different habitats and on other faunal assemblages (Martin and Murray 2011). I examine the effects of an invasive grass on reptile assemblage composition and diversity, using a natural system invaded by grader grass (Themeda quadrivalvis). Grader grass is typical of invasive grassy weeds in many ways. It is common in disturbed systems worldwide, occurring in the United States, New Caledonia, Southeast Asia, Papua New Guinea, the Middle East and tropical America, often as a noxious weed (Keir and Vogler 2006). After its accidental introduction to Australia in the 1930s from India, grader grass spread quickly across large regions of central and northern. 16.
(40) Queensland, the Northern Territory, and northern Western Australia (Keir and Vogler 2006). Grader grass is a fast-growing, annual grass, which seeds prolifically and germinates rapidly. Mature grader grass is rigid, fibrous, and unpalatable to native and domestic herbivores (McIvor and Howden 2000; Keir and Vogler 2006). To determine the responses of reptiles to weeds, I quantified the reptile assemblages in native grass habitats that had been invaded by grader grass (Themeda quadrivalvis), and compared them to those found in adjacent native kangaroo grass (Themeda triandra) and black spear grass (Heteropogon contortus) habitats. To describe possible mechanisms influencing reptile composition in the three habitats, I also compared various characteristics that might influence reptile use of habitat. I quantified habitat characteristics likely to be use of the habitat by reptiles (such as grass morphology, and amounts of various habitat features) (e.g., Jellinek et al., 2004). Because reptiles are ectotherms, temperature is a critical feature determining habitat use (e.g., Taylor and Fox 2001) so I measured environmental temperatures within grass clumps because food availability is a major factor determining habitat use of many animals, I quantified food availability, by assessing the overall biomass of invertebrates in the different grasses (e.g., Diaz and Carrascal 1991; Christie et al., 2013). Finally, because predation may influence the use of habitat by reptiles (e.g., Diaz and Carrascal 1991) I determined the abundance of avian and reptilian predators of reptiles in the native and weed-infested habitats.. 17.
(41) Methods Study system Undara Volcanic National Park (18°19`29.92``S, 144°36`28.31``E) covers an area of 66 000 ha, and is a part of the McBride Volcanic System, 850 m above sea level, approximately 420 kilometres northwest of Townsville, Queensland. Study sites were located in open savannah woodland at Undara. Tree species in the woodland included bloodwood (Corymbia pocillum), rough-leaved cabbage gum (Corymbia confertiflora), narrow-leaved ironbark (Eucalyptus crebra), Darwin woollybutt (Eucalyptus miniata), silver oak (Grevillea parallela), and bat’s wing coral trees (Erythrina vespertilio), with a grassy understory. I selected 24 sites with 8 sites in each of the three different dominant grass habitats (Fig. 1), either grader grass (Themeda quadrivalvis), native kangaroo grass (Themeda triandra), or black spear grass (Heteropogon contortus). Sites were spatially separated so that site clusters included at least two, and typically all three dominant grass types, and sampling sites within each cluster were separated by at least 100 m (usually more, Fig. 1). Native kangaroo and black spear grass are both perennial, grow to about 1.5 m, and provide good fodder for grazing (McIvor and Howden 2000). Black spear grass develops a characteristic black seed-head with a long awn at one end and a sharp spike at the other, whereas kangaroo grass is similar in morphology to its congener grader grass, with longer spikelets. Kangaroo and black spear grass grow in clumps, or hummocks, spaced at regular intervals in open woodland, whereas grader grass emerges as a single stolon, and grows in a sward rather than hummocks.. 18.
Figure


+7


Outline
Related documents
Compared to the non-separated men, those separated in childhood had an increased relative risk ratio (RRR) of frailty (age-adjusted RRR 3.93, 95% CI 1.02, 15.11) relative to
In this study, we tested the relationship of stock returns and seven macroeconomic variables consisting of exports, foreign direct investment, gold prices,
The primary research intent of this study was examine how former Texas public school board members perceived the characteristics of effective leadership concerning the hiring
shear wall frame system and outrigger belt truss frame system is.. studied for P-Delta
Hassan and Mohamed Zribi, “Decentralized load frequency controller for a multi-area interconnected power system”, Electric Power & Energy Systems, Vol. Alrifai,
The effect of community-level women’s DMI on the risk of childhood death is greater than that of the individual level, even though the former is partly explained by individual-
The IS audit and control profession continues to evolve. ISACA’s COBIT 4.1 is an example of the IT control objectives confronting management, auditors, IS professionals and
On average, DALY loss per 30-day survivor included 7.6 years of lost life expectancy and 5.7 years lived with disability.. Estimated burden of AHT incidents in 2009 was 69 925 DALYs
