Attitudes towards the
student finance
system
Research report
May 2019
Authors: Steve Looney, Adam
2
Contents
List of figures 4
List of tables 6
Executive Summary 7
Methodology 7
Qualitative exploration phase 7
Quantitative Survey 8
Key Findings 10
Knowledge of the student finance system 10
Perceptions about the fairness of the student finance system 11
Potential changes to the student finance system 12
1. Knowledge of the student finance system 14
Introduction 14
Knowledge of the repayment threshold 14
Knowledge of interest charged on loans 16
Knowledge of the loan write-off period 17
Knowledge of the HE funding system 18
2. Perceptions about the fairness of the student finance system 22
Introduction 22
Government spending and opportunities 22
The balance of taxpayer and student funding 27
Whether the amount that students contribute should depend on household income 29
Perceptions about repayment amounts 32
3. Potential changes to the student finance system 37
Introduction 37
Potential changes to the current system 37
Which trade-offs would participants be happy with? 42
Changes to the student finance system: demographic differences 45
How students choose what to study 48
3
4. Conclusions 56
5. Appendices 57
4
List of figures
Figure 1: How much do you think a graduate has to be earning before they start paying back their loans? Base: all respondents (1,064), parents of prospective applicants (131)
15
Figure 2: Do you think interest is the same for all graduates or does it depend on
income? Base: all respondents (1,064), parents of prospective applicants (131) 16
Figure 3: How long after leaving do you think loans are written off? Base: all respondents (1,064), parents of prospective applicants (131) 17
Figure 4: Who do you think pays for the costs of a student’s education? Base: all
respondents (1,064), parents of prospective applicants (131) 19
Figure 5: Estimated taxpayer contribution amongst those aware that both students and taxpayers cover this cost. Base: those who think students and taxpayers pay for higher
education (556) 20
Figure 6: Do you think the government spends too much money, too little money, or about the right amount on higher education? Base: all respondents (1,064), parents of
prospective applicants (131) 23
Figure 7: Do you feel that opportunities for young people in the UK to go onto higher education, to study at a university, should be increased or reduced, or are they at about the right level now? Base: all respondents (1,064), parents of prospective applicants
(131) 24
Figure 8: Do you feel that opportunities for young people in the UK to go onto higher education, to study at a college, should be increased or reduced, or are they at about the right level now? Base: all respondents (1,064), parents of prospective applicants (131) 25
Figure 9: Do you think the 45 percent taxpayer contribution is too high, about right or too low? Base: all respondents (1,064), parents of prospective applicants (131) 28
Figure 10: Percentage of respondents that agreed that it is fair for HE students to make some contribution to their studies. Base: all respondents (1,064), parents of prospective
applicants (131) 30
Figure 11: Percentage that agreed that the amount that students pay should depend on their household income. Base all agreeing that HE students should contribute (681), parents of prospective applicants (76). 31
5
Figure 13: Stated importance of policy options (percentage rating each policy option as seven out of ten or higher). Base: all respondents (1,064) 37
Figure 14: What would you accept to lower tuition fees? Base: all giving “lower tuition fees” seven out of ten or higher at D1 and allocated to this (403) 43
Figure 15: What would you accept to lower interest rates? Base: all giving “lower interest rates” seven out of ten or higher at D1 and allocated to this (393) 44
Figure 16: Importance of different policy options with willingness to trade these options.
Base: all respondents (1,064) 45
Figure 17: Percentage of different groups that would support any changes to the student finance system. Base: all respondents (1,064); Graduates (698); Non-graduates (366); DE respondents (277); C1C2 respondents (452); AB respondents (335); Aged 18 to 34 (289: Not aged 18 to 34 (775); Parent of children aged under 18 (299); Not parents of
children under 18 (765) 47
Figure 18: Support for lowering tuition fees and lowering interest rates by parental groups. Base: all respondents (1,064); Parent of a prospective applicants (131); Not a parent of a prospective applicants (933); Not a parent of children under 18 (765); Parent
of children under 18 (299) 48
Figure 19: Should students choose their subject based on potential earnings or personal interests? Base: all respondents (1,064) 49
Figure 20: Should students be able to choose any subject even if this costs taxpayers?
Base: all respondents (1,064) 51
6
List of tables
Table 1: Breakdown of Survey Sample by Age and Occupation (Base: all respondents
(1,064) 9
Table 2: Breakdown of Survey Sample by Social Grade (Base: all respondents (1,064) 9
Table 3: Breakdown of Survey Sample by Education and Gender (Base: all respondents
7
Executive Summary
Produced by Opinium, this report presents the findings of a survey and qualitative
fieldwork commissioned by the Department for Education (DfE) to ascertain the attitudes of parents whose children were prospective higher education applicants (hereafter referred to as parents) and the general population towards the student finance system in England.
The research has the following four objectives:
• To explore the extent that parents and the general population understand the current student finance system.
• To explore the extent that parents and the general population believe that the current student finance system is fair.
• To explore the attitudes of parents and the general population to different trade-offs within the student finance system.
• To explore the level of priority that parents and the general population place on the various features of the student finance system.
The research comprised two stages:
1. Qualitative exploration phase: this consisted of two online qualitative “pop-up” communities amongst parents and general population. The communities lasted for three days, with participants probed on their views of the current education system and the trade-offs they would be willing to make to change various parts of the system.
2. Quantitative Survey: this consisted of an online survey of 1,064 adults, representative of the adult population in England. This largely replicated equivalent surveys sent to university applicants, students and graduates1 and
featured awareness and attitudinal questions as well as a trade-off exercise between the same set of policy suggestions.
Methodology
Qualitative exploration phase
Online pop-up communities perform a similar function to focus groups. They are online spaces that allow invited participants to engage and discuss topics and to share ideas. In
1 Brown, M., (2019), Attitudes of higher education applicants, students and graduates towards the student
8
addition, participants perform certain tasks over a number of days, such as recording videos giving their views on topics set out by the invigilators of the communities.
The pop-up community run for this piece of work was a three-day long engagement with the following two groups:
• Parents – 20 parents of children aged 16 or over who are planning to go (or considering going) to university in the next 2 years. Participants were aged 30-50+, and had a range of education levels, were from a range regions of England and had different marital statuses.
• General Population – 20 people from the general population who do not have children planning to go (or considering going) to university in the next 2 years and had a range of education levels, were from a range of regions of England and were of different ages.
Opinium and DfE agreed the tasks that participants would complete prior to the launch of the community. Tasks were daily and lasted approximately 20-30 minutes. They
comprised short video contributions and written discussion tasks (through an online message board).
The topics of the video contributions and discussion tasks covered:
• Exploring participants’ current knowledge of and attitudes to the current student finance system
• Exploring attitudes towards how fair the student finance is and what motivators and concerns they have with the system
• Exploring the types of conversations that parents had had with their children on financing higher education and the emotions involved (not discussed in the general population community)
• Understanding the trade-offs participants would be willing to make for lower tuition fees, which options have the highest preference and why
• Exploring what other trade-offs participants would be willing to make
• Understanding choices around subjects that students take
Quantitative Survey
The survey was a separate piece of work. It drew its participants from Opinium’s pre-profiled consumer panel. The sample comprised 1,064 adults aged 18 and over. Fieldwork took place from 22nd to 28th November 2018. The research used a
9
Table 1 shows the breakdown of the sample by age and occupation, with Table 2 showing the breakdown of the sample by social grade and Table 3 showing breakdown by education and gender.
Table 1: Breakdown of Survey Sample by Age and Occupation (Base: all respondents (1,064)
Age group Percentage Base Occupation Percentage Base
18-34 27% 289 Working full time 43% 456
35-44 14% 151 Working part time 17% 176
45-54 19% 201 Unemployed 2% 25
55-65 17% 184 Retired 26% 280
65+ 22% 238 Other 12% 126
Table 2: Breakdown of Survey Sample by Social Grade (Base: all respondents (1,064)
Social Grade Percentage Base
AB 31% 335
C1C2 42% 452
DE 26% 277
Table 3: Breakdown of Survey Sample by Education and Gender (Base: all respondents (1,064)
Education Percentage Base Gender Percentage Base
Graduate 38% 400 Male 48% 511
Non-Graduate 62% 664 Female 52% 552
Parents of Prospective Applicants
The survey comprised 131 parents of prospective applicants. This group was defined as parents of children who were 16 years-old or above and answered “yes, definitely” or “yes, probably” to the survey question “You said that you have one or more children aged 16 or over. Are any of them planning to go to university to study for an undergraduate degree within the next two years?” or answered anything other than “They aren’t interested in studying at university” or “Don’t know” to the question “You said that you have children aged 16-18 who are probably not going to start studying at university in the next two years. Is this for any of the following reasons?” For convenience, the text in this report often refers to this subgroup as parents, with anyone not fitting this criterion
10
This report examines key questions by different populations (for example, whether an individual is a graduate or not). The relationships recorded between these different populations will be significant to 95% confidence interval unless otherwise stated.
Key Findings
Knowledge of the student finance system
• Knowledge of the repayment threshold was mixed. While significant minorities of respondents (42%) answered correctly that the income threshold for when graduates start to pay their loans back was £25,000, the same percentage (42%) provided an incorrect answer.
• Respondents demonstrated a poor knowledge of how interest was charged on loans. Only 18 percent of respondents correctly answered that it was
dependent on income. A significant minority of the respondents (44%) thought that interest was the same for all graduates.
• Individuals showed a slightly better knowledge of the loans write-off period, though this was still mixed. Thirty percent of respondents were correct in
answering 30 years after leaving university. Twenty-one percent of respondents incorrectly thought the write-off period was 20 years. Large percentages of respondents answered that they did not know. Parents (40%) were more likely than non-parents (29%) to answer this question correctly.
• Respondents demonstrated a misconception about the proportion of the cost of higher education incurred by students and taxpayers. Approximately one third of the total population (32%) and a little under half of parents (45%) wrongly thought that students incurred all the costs for their studies. Forty-nine percent of respondents were correct in answering that students and taxpayers shared costs.
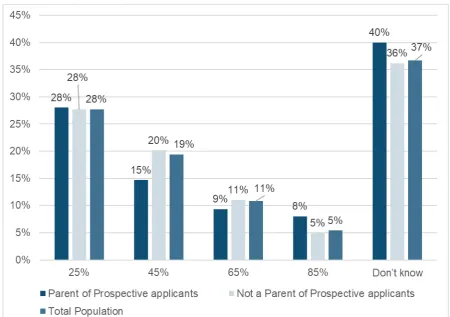
• Of those who knew that taxpayers contributed to the student finance system, 28 percent of respondents believed the percentage that taxpayers contributed to costs was 25 percent. Nineteen percent of the total population were correct in answering 45%. A further 37% of the respondents answered that they did not know the percentage. Only 16 percent of the total population
overestimated the contribution taxpayers make.
11
Perceptions about the fairness of the student finance system
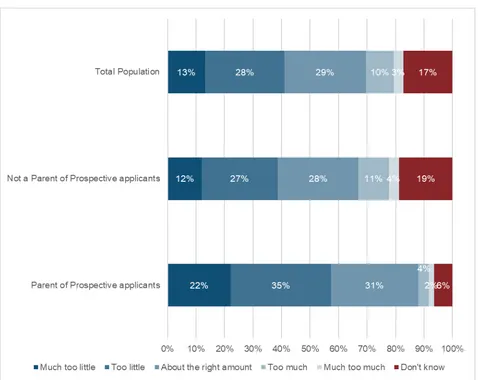
• Twenty-eight percent of the total population believe that the government spends too little on higher education, with 13% thinking they spend much too little. A higher proportion of parents (35%) thought that the government spends too little, with 22% thinking they spend much too little. Thirteen percent of the total population and 6% of parents of prospective applicants think that the government spends too much or much too much on higher education.
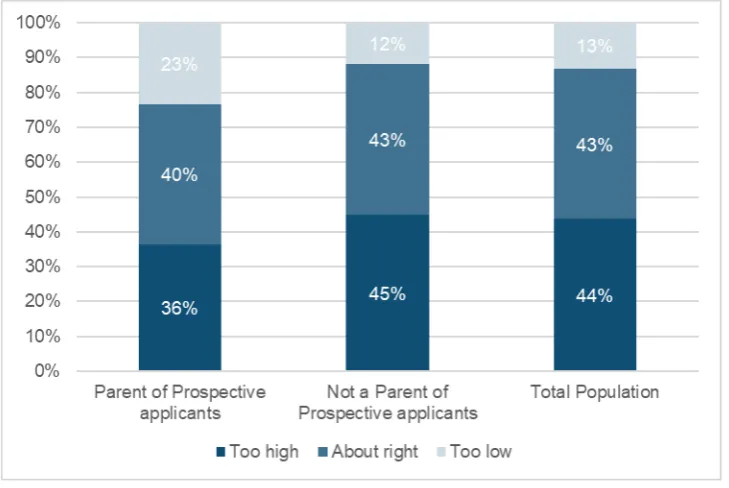
• Once informed that the taxpayer contributes 45 percent towards the cost of higher education, respondents expressed mixed views regarding the level of this contribution. Forty-three percent of respondents believed that the taxpayer contribution was about right, with a very similar percentage (44%) thinking it was too high. Thirteen percent of the total population thought the contribution was too low.
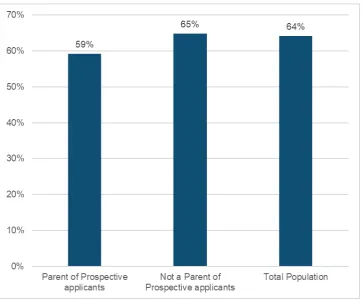
• The majority of respondents (64%) agreed that it is fair for HE students to contribute to their studies. Of those respondents who thought that students should contribute to their studies, the majority agreed that the amount that students pay should depend on household income (61%).
• The survey tested three repayment scenarios, where respondents were shown how much a graduates pays back at different salary amounts:
o The first scenario tested a graduate’s pre-tax earnings of £27,000 per annum. Under the current system, this means that a graduate would pay £15 per month and £180 per annum. Approximately half of respondents (52%) thought that repayments at this income were too low, with 38% of parents considering this figure as too low.
o The second scenario tested an income of £35,000 per annum, which results in a repayment of £74 per month and £888 per annum. Compared with the previous scenario, a lower percentage of respondents (33%) thought this was too low a figure. A small majority (55%) thought this figure was about right.
o The final scenario tested an income of £40,000, with repayments totalling £112 per month and £1,344 per annum. This scenario is broadly
comparable to the £35,000 scenario, with a small majority of
respondents (54%) and high minority of parents (48%) seeing this as about right.
12
• Despite the financial cost, pop-up community members thought that higher education remained a worthwhile experience. Members of both pop-up
community groups highlighted both the academic and personal benefits of higher education. Some members of the parent community mentioned that they had spoken to their children about higher education and had encouraged them to consider it.
Potential changes to the student finance system
• The survey asked respondents to rate various student finance policy changes that could be implemented out of ten. The highest rated policy change was
lowering tuition fees, with 52% of respondents rating this at seven out of ten or above. Lowering interest rates on loans (49%), letting graduates waiting until they are earning more before paying back loans (47%), and writing off loans earlier (45%) were also relatively highly rated options.
• Concerns about the cost of tuition fees were also reflected in the pop-up communities, with this being widespread across members of both the parent and general population groups. Members also considered lowering interest rates important, with some members stating that these were barely distinguishable from a regular bank loan.
• The survey asked respondents a series of trade-off questions. For example, if respondents rated lowering tuition fees as an important change what other policy change would they be willing to trade-off to see lower fees. These questions revealed that lowering tuition fees and lowering the interest rates were very important to respondents and changes that they would not trade-off to see other policy changes. Other policy changes, like graduates paying their loans off sooner, paying back more every month and paying back their loans for longer were less important and were changes that respondents were more willing to trade off.
• The majority of the total population believe that students should choose their subject primarily based on their interest in the subject (58%), with 19 percent believing that earnings potential should be the primary factor.
• However, views began to change once it was suggested that certain
subjects might cost the taxpayer. Twenty-nine percent of participants believed that students should not be restricted in their choices even if that meant it cost taxpayers more. However, 35 percent of participants thought that there should be some restrictions in place, with 25 percent answering that it depended.
13
• Respondents demonstrated broad support for reintroducing grants instead of loans to support students with their living costs. Fifty percent of
14
1. Knowledge of the student finance system
Introduction
This chapter examines what survey participants and online community members knew about the student finance system. After first answering questions on their knowledge of the student finance system, survey participants and community members then received correct information about the student finance system. The data included in this chapter presents information about what individuals knew about the student finance system before learning more.
Knowledge of the repayment threshold
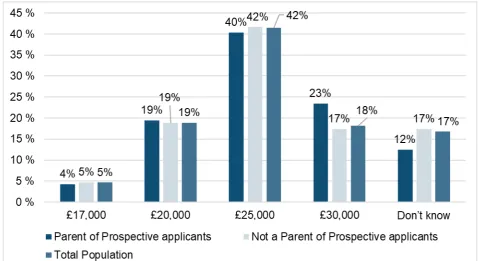
Figure 1 shows that there is some confusion regarding how much graduates have to be earning before they start paying back their loans, with only 42 percent of all those
respondents surveyed answering correctly. Forty-two percent of the total population who provided answers other than “don’t know” were incorrect. There were no significant differences between parents and non-parents, in terms of their knowledge of the
repayment threshold. Seventeen percent of the total population said they did not know.
These survey findings triangulate with the pop-up communities, with members mentioning either “certain amounts” or “certain thresholds” in relation to wages and earnings.
“Once you learn over a certain amount,” Member of the General Population Community.
15
Figure 1: How much do you think a graduate has to be earning before they start paying back their loans? Base: all respondents (1,064), parents of prospective
applicants (131)
Further Analysis of knowledge of repayment threshold
• Age: There were no significant differences by age in terms of respondents’ knowledge of the repayment threshold.
• Employment status: Similarly, there were no significant differences by employment status.
• Social Grade: There were some differences by social grade: forty-eight percent of respondents in the AB social grade answered this question correctly, compared with 43 percent of C1C2 and 31 percent of DE respondents.
• Education: The differences by education (i.e. whether a respondent was a graduate or non-graduate) were significant Forty-seven percent of respondents who had graduated from HE answered correctly, with this dropping to 38 percent for those who had not.
16
Knowledge of interest charged on loans
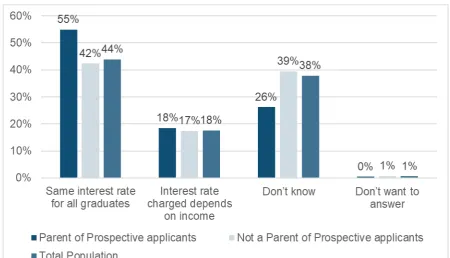
Respondents did not demonstrate a good knowledge of the level of interest charged on loans, and how this varies according to graduates’ incomes (see Figure 2).
Forty-four percent of the total population incorrectly thought that interest was the same for all graduates. Only 18 percent of the total population correctly answered that it was dependent on income. Sizeable minorities of the total population answered that they did not know.
[image:16.595.68.519.313.571.2]Differences between parents and non-parents, in terms of whether they answered the question correctly, were not significant. However, parents (55%) were more likely to answer the question incorrectly than non-parents (42%).
Figure 2: Do you think interest is the same for all graduates or does it depend on income? Base: all respondents (1,064), parents of prospective applicants (131)
Further Analysis of knowledge of interest charged on loans
• Age: With regards to respondents’ knowledge of the interest charged on loans, there were significant differences by age. Twenty-four percent of respondents aged 18 to 34 and 35 to 44 answered this question correctly. This drops to 17 percent for 45-54 year-olds, 14 percent for 55-65 year-olds and 9 percent for over 65s.
17
those who were retired. Respondents working part-time and full-time were more likely to answer correctly (23% and 21% respectively) than retired respondents (10%). The difference between full-time and part-time was not significant.
• Social Grade: While there were no significant differences between responses from AB and C1C2 categories, there was a significant difference between those in AB and the lowest social grade, DE (with 20% versus 13% answering questions on interest correctly).
• Education: Respondents who were graduates were more likely to answer correctly (22% versus 15%).
• Gender: There were no significant differences by gender.
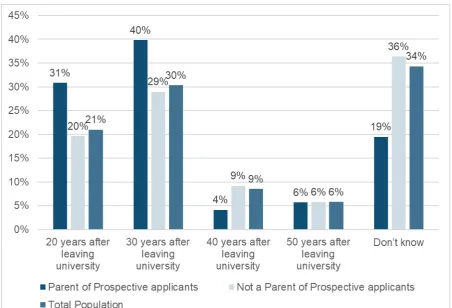
Knowledge of the loan write-off period
[image:17.595.68.521.433.741.2]There was limited knowledge of the loans write-off period, with only 30 percent of the total population answering correctly (see Figure 3). Differences between parents (40%) and non-parents (29%) were significant. Sizeable percentages (20% of non-parents and 31% of parents) thought the write-off period was 20 years, or that they did not know (19% and 36% respectively).
18
Further Analysis for the loan write-off period
• Age: There were significant differences by age in terms of whether respondents answered questions about the loan write-off period correctly. This question was answered correctly by 36 percent of respondents aged 45 to 54, 34 percent of those aged 35 to 44 and 31 percent of those aged 18 to 34. Only 24 percent of respondents aged over 65, and 28 percent of those aged 55-65 answered correctly.
• Employment Status: Retired respondents (23%) demonstrated a lower knowledge of write off periods than both full-time (32%) and part-time (34%) groups.
• Social Grade: Differences in knowledge of the write-off period between the two higher social grades (AB, 34% and C1C2, 33%) and the DE grade (22%) were significant.
• Education: There were no significant differences by education level.
• Gender: Similarly, differences by gender were not significant.
Knowledge of the HE funding system
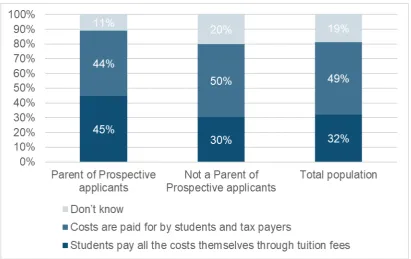
There was a misconception about the proportion of the cost of higher education incurred by students and taxpayers.
Almost a third of respondents (32%) incorrectly believed that students incurred the full costs of their studies, and differences between parents (45%) and non-parents (30%) were significant, with parents being more likely to answer incorrectly (see Figure 4).
19
Figure 4: Who do you think pays for the costs of a student’s education? Base: all respondents (1,064), parents of prospective applicants (131)
Further Analysis of knowledge of the HE Funding System
• Age: With regards to knowledge about how the cost of HE is funded, there were no significant differences by age.
• Employment Status: As with age, there were no significant differences by employment status.
• Social Grade: Again, the differences by social grade were not statistically significant.
• Education: Differences by education level, in terms of answering this question correctly, were not significant.
• Gender: Males were more likely than females to know how the cost of HE is funded (54% versus 44%). This is consistent with other knowledge questions.
As Figure 5 demonstrates, even among those individuals who knew that taxpayers contributed to the cost of higher education, many underestimated the cost incurred. Twenty-eight percent of the total population believed the percentage that taxpayers
20
Of those who were aware that taxpayers contributed to the cost of a student’s higher education, most were either unaware of the exact level of the contribution or were likely to underestimate it. Only 16 percent of the total population overestimated the contribution taxpayers make.
There was also some surprise amongst pop-up community members regarding the 45 percent figure, with some members perceiving that figure to be high and others stating they were unaware of the amount being written off.
“Nothing has surprised me bar the 45% figure of those who don’t pay back in full, that’s massively high in my perception,” Member of the General Population Community.
[image:20.595.68.519.423.740.2]“I was surprised by the amount of money being written off, few years back I thought about higher education but thought I couldn't afford, now I learn that unless I get a good job I don't pay, who foots the write off bill, I guess the taxpayer?,” Member of the Parent Community.
Figure 5: Estimated taxpayer contribution amongst those aware that both students and taxpayers cover this cost. Base: those who think students and taxpayers pay
21
Further Analysis of Taxpayer contributions
• Age: Knowledge about the level of the taxpayer contribution towards higher
education varied by age. Twenty-three percent of 18 to 34 year-olds, 24 percent of 35 to 44 year-olds and 23 percent of 55 to 65 year-olds answered this question correctly, compared with a lower proportion of 45 to 54 year-olds (17%) and over 65s (13%).
• Employment Status: There were no significant differences by employment status with regards to knowledge of the taxpayer contribution to HE costs.
• Social Grade: Respondents in the AB (24%) social grade category were more likely than those in the C1C2 (18%) and DE (16%) categories to answer this question correctly.
• Education: There were no significant differences by education level.
22
2. Perceptions about the fairness of the student
finance system
Introduction
This chapter explores the perceptions that survey participants and community members have about the fairness of the student finance system once it has been explained it to them in detail.
Government spending and opportunities
Figure 6 shows that 28 percent of the total population believe that the government
spends too little on higher education, with 13 percent thinking they spend much too little.
23
Figure 6: Do you think the government spends too much money, too little money, or about the right amount on higher education? Base: all respondents (1,064),
parents of prospective applicants (131)
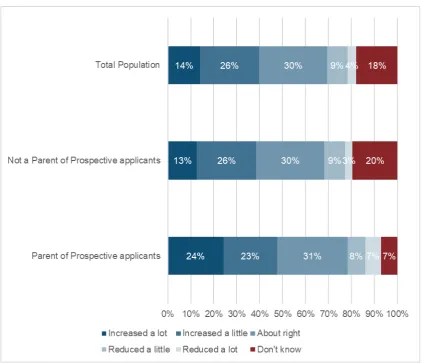
Twenty-eight percent of the total population thought that opportunities for young people in the UK to go to university should be increased. There were differences by parenthood status: 35 percent of parents of prospective applicants thought that opportunities should be increased, compared with 28 percent of non-parents (see Figure 7).
24
Figure 7: Do you feel that opportunities for young people in the UK to go onto higher education, to study at a university, should be increased or reduced, or are
they at about the right level now? Base: all respondents (1,064), parents of prospective applicants (131)
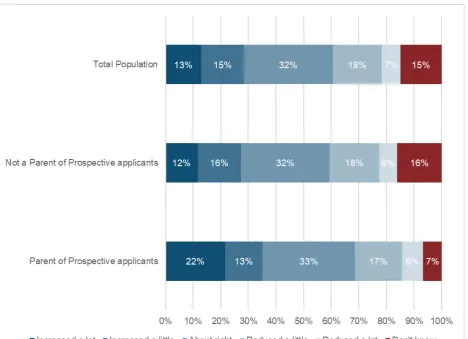
A higher percentage of the total population would like to see more opportunities for young people to study higher education at colleges rather than at university (40% compared with 28%).
Again, there were significant differences by parenthood status: 39 percent of non-parents would like to see opportunities for studying HE at colleges increased, with the
25
Figure 8: Do you feel that opportunities for young people in the UK to go onto higher education, to study at a college, should be increased or reduced, or are they
at about the right level now? Base: all respondents (1,064), parents of prospective applicants (131)
Further Analysis of government spending and opportunities
Government spend
• Age: There were few differences by age in relation to whether the government invests too much or too little in higher education.
• Employment Status: Similarly, there were no significant differences by employment status.
26
• Education: Graduates were more likely to support an increase in government spend than non-graduates (48% versus 37%).
• Gender: Males were more likely than females to think the government spends too much on higher education (15% compared with 11%). Twenty-three percent of females said that they did not know compared with 11 percent of males. There was no difference between males and females in their support for an increase in government spend in higher education.
Higher education opportunities at university
• Age: Opinions about whether opportunities to study at university should be increased varied by age. Thirty-one percent those aged 18 to 34 supported increased opportunities compared with 29 percent of those aged 35 to 44, 28 percent of those aged 45 to 54 and a similar proportion of those aged 55 to 65 (28%). The lowest support for increased opportunities was amongst those aged over 65 (25%). Conversely 32 percent of over 65s, 26 percent of 55-65 year-olds and 28 percent of 45-54 year-olds supported a reduction, compared with 17 percent of 18-34 year-olds and 19 percent of 35-44 year-olds.
• Employment Status: There was a significant difference across responses by employment status, with retired respondents (33%) more likely to support a reduction of opportunities for young people to study HE at a university compared with 23 percent of full-time respondents and 21 percent of part-time respondents.
• Social Grade: There was a significant difference across responses by social grade, with 31 percent of AB respondents supporting a reduction in opportunities compared with 21 percent of C1C2 and 21 percent DE respondents.
• Education: Graduates were more likely to support increases in opportunities to study at university than non-graduates (31% versus 26%). Twenty-seven percent of graduates support a reduction in opportunities versus 23 percent of
non-graduates. Non-graduates were more likely to state that they did not know (18% versus 9%).
27
Higher education opportunities at college
• Age: A clear and significant pattern emerges by age with regards to respondents’ views on whether opportunities for young people to study HE at college should be increased or decreased, with those in older age categories more supportive than those in younger age categories. Thirty-four percent of those aged 18 to 34 and aged 35 to 44 were supportive of more opportunities, with those aged 45 to 54 (41%), those aged 55 to 65 (43%) and those aged over 65 (46%) more likely to support this option.
• Employment Status: There is also some significant differences when responses to this question are looked at by employment status, with 46 percent of retired respondents supportive of more opportunities for young people to study at college, compared with 40 percent of those employed part-time and 35 percent of those employed full-time.
• Social Grade: Opinions on this point also varied by social grade. Forty-three percent of C1C2 respondents supported more opportunities for young people to study HE at college compared with 40 percent of AB respondents and 34 percent of DE respondents.
• Education: Graduates were more likely to support a reduction in opportunities for young people to study HE at college than non-graduates (18% versus 9%).
• Gender: Males were more likely than females to believe that opportunities for young people to study HE at a college were about right (33% versus 27%).
The balance of taxpayer and student funding
Once they had been informed that the taxpayer contributes 45 percent towards the cost of higher education, respondents expressed mixed views regarding the level of this contribution (see Figure 9). Forty-three percent of the total population thought this figure was about right, compared with 13 percent thinking it was too low and 44 percent thinking it was too high.
28
Figure 9: Do you think the 45 percent taxpayer contribution is too high, about right or too low? Base: all respondents (1,064), parents of prospective applicants (131)
Further Analysis of the balance of taxpayer and student funding
• Age: There was a significant difference across responses by age. Respondents aged 18 to 34 were most likely to say that the taxpayer contribution was about right at 52 percent, with those aged 45 to 54 and those aged 55 to 65 least likely to say the contribution was about right (both 36%). Respondents aged 45 to 54 years old and 55 to 65 years old were most likely to think that contributions were too high (49% and 50% respectively).
• Employment Status: Respondents who were employed part-time were more likely to think that contributions were too high (54% compared with 40% of full-time and 45% of retired respondents), with those employed full-time more likely to think contributions were too low (16% compared with 13% retired and 6% of part-time respondents).
• Social Grade: There was also a significant difference across the responses to this question by social grade. AB respondents were more likely to say that
contributions were about right (54%), compared with C1C2 and DE respondents (both 38%). C1C2 (51%) and DE (49%) respondents were more likely to think that contributions were too high, compared with AB (30%).
29
• Gender: Females were more likely than males to think that taxpayer contributions were too high (48% versus 39%), with males more likely to think taxpayer
contribution was too low (20% versus 7%).
When learning of the 45 percent taxpayer figure, pop-up community members remained positive about individuals attending higher education. Some members noted that once students become graduates and enter employment they too become taxpayers and therefore contribute to the system. Others noted that having a degree tends to lead to a better, higher paid job, which should enable them to pay more of their loan (or their entire loan off) and be less of a strain on the taxpayer due to being less likely to be claiming benefits.
“As I've said before comments such as the taxpayer pays are demonising. Everyone pays taxes of some sorts, and most jobs people pay taxes so in a way students have already started to pay taxes on day to day things so it’s not one pays and one doesn’t,”
Member of the Parent Community.
“This does not change my mind in the slightest. And further I would say that this does not even suggest to me that the system doesn't work. The system is not designed to see every student repay all of their loan. If that was the intention then it was built in a much more punitive manner. What this figure says to me is that a lot of students are doing well financially having graduated and have been able to repay their loans, and that those who have not had financial success are not being unduly burdened,” Member of the General Population Community.
Whether the amount that students contribute should depend
on household income
30
Figure 10: Percentage of respondents that agreed that it is fair for HE students to make some contribution to their studies. Base: all respondents (1,064), parents of prospective applicants (131)
Further Analysis of whether it is fair for students to contribute to their studies
• Age: The differences in responses to whether it is fair for students to contribute to their studies do not vary significantly across age categories.
• Employment Status: Similarly, differences by employment status were not significant.
• Social Grade: AB (67%) and C1C2 (68%) respondents were more likely than DE (55%) respondents to think that students contributing is fair, with 18 percent of DE respondents disagreeing compared with 13 percent of AB respondents and 8 percent of C1C2 respondents.
• Education: Graduates were more likely than non-graduates to believe that students contributing to their studies is fair (65% versus 63%).
• Gender: Female respondents (67%) were more likely than male respondents (60%) to think that students contributing to their studies was fair. Male
31
Sixty-one percent of respondents agreed that the amount that students pay should depend on their household income, and 17 percent disagreed.
[image:31.595.112.477.258.506.2]There was a statistically significant difference between non-parents and parents. The difference is driven by a far higher proportion of parents (27%) disagreeing that the amount students pay should be dependent on income in comparison to non-parents (16%). However, the majority of both groups (61% of non-parents and 60% of parents) believed that the amount students pay should be income dependent.
Figure 11: Percentage that agreed that the amount that students pay should depend on their household income. Base all agreeing that HE students should
contribute (681), parents of prospective applicants (76).
• Age: There were no significant differences by age concerning whether the amount that students pay should depend on their household income.
• Employment Status: The differences by employment status were not significant.
• Social Grade: Unlike the other demographic analyses, differences in responses to this question do vary by social grade. DE (69%) respondents were more likely than AB (58%) and C1C2 (60%) respondents to think that the amount that students pay should be income dependent.
• Education: Differences by education were not significant.
32
Perceptions about repayment amounts
The survey asked participants about different repayment scenarios based on the current student finance system. Questions involved asking that if a graduate earned a certain amount per year before tax their current contribution would be £X per month and £Y per year (see questions C10, C11 and C12 in Appendix 1 for detail). The figure below details the results.
The first scenario tested a graduate’s pre-tax earnings of £27,000 per annum. Under the current system, this means that a graduate would pay £15 per month and £180 per annum. Fifty-two percent of respondents thought this amount was too low, 41 percent thought it was about right, and 7 percent thought it was too high. The differences between parents and non-parents were significant with just over half of non-parents (54%) thinking that repayments at this income were too low, compared with 38 percent of parents.
The second scenario tested an income of £35,000 per annum, which results in a repayment of £74 per month and £888 per annum. Thirty-three percent of respondents thought this amount was too low, 55 percent thought it was about right, and 12 percent thought it was too high. The differences between parents and non-parents and responses to this scenario were not statistically significant.
The final scenario tested an income of £40,000, with repayments totalling £112 per month and £1,344 per annum. As with the previous scenario, the largest group of respondents thought this figure was about right (54%), while 32 percent thought it was too low and 14 percent thought it was too high. There was significant variation by
33
Figure 12: What the total population and parents thought about different repayment scenarios. Base: all respondents (1,064), parents of prospective
applicants (131)
Further Analysis of different repayment scenarios
Scenario 1: £15 per month at £27,000 pa
• Age: The differences across responses to this question by age were statistically significant. Respondents aged 18 to 34 and 35 to 44 were the most likely age groups to say that this scenario was about right (both 45%). However, 60 percent of respondents aged both 45 to 54 and 55 to 65 thought that the repayments were too low in this scenario, and 56 percent of over 65s also thought that repayments were too low.
• Employment Status: The differences across responses to this scenario by employment status were statistically significant. Those respondents working part-time and those respondents who were retired were equally likely to think that the repayments in this scenario were too low (57%), with 49 percent of respondents employed full-time believing that repayments were too low. Forty-four percent of full-time respondents thought this scenario was about right, with lower
34
• Social Grade: The differences across responses to this scenario by social grade were statistically significant. Social grades C1C2 (55%) and DE (53%) were more likely to think that repayments for this scenario were too low, compared with AB respondents (47%). AB respondents, relative to the other social grades, were more likely to think that this scenario was about right (47% versus 40% of C1C2 and 38% of DE).
• Education: Graduates most likely to state that the repayments in this scenario were about right (47%) compared with 38 percent of non-graduates. Fifty-eight percent of non-graduates thought repayments were too low, with 42 percent of graduates thinking the same.
• Gender: Forty-five percent of females thought this repayment scenario was about right compared with 38% of males. Conversely, 54% of males thought the
repayments were too low, compared with 50% of females.
Scenario 2: £74 per month at £35,000
• Age: Differences across age in responses to this scenario were significant. Fifty-nine percent of respondents aged 18 to 34 and 62 percent of respondents aged 35 to 44 thought that repayments in this scenario were about right. This drops to 48 percent for those aged 45 to 54, 51 percent for those aged 55 to 65 and 53 percent for those aged over 65.
• Employment Status: Differences by employment status were not significant.
• Social Grade: Responses to this scenario varied by social grade. Respondents in the AB social grade were most likely to think this this scenario was about right (59%), compared with both C1C2 and DE (both 52%) respondents. C1C2
respondents were more likely than other categories to consider repayments to be too low (37% versus 28% of AB and 32% of DE. DE respondents were more likely to consider the repayments too high (16% versus 13% of AB and 10% of C1C2).
• Education: Sixty-percent of graduates thought that this scenario was a fair one, compared with 51 percent of non-graduates. Non-graduates were more likely to consider repayments too low (37% versus 26%).
• Gender: There was no significant difference between males and females in regards to this scenario.
Scenario 3: £112 per month at £40,000
• Age: Differences by age in responses to this scenario were not statistically significant
35
were about right, compared with 49 percent of part-time employed respondents and 51 percent of retired respondents. Seventeen percent of part-time
respondents thought that repayments were too high compared with 14 percent of retired respondents and 11 percent of full-time respondents.
• Social Grade: Responses also varied by social grade. Sixty-one percent of AB respondents thought that the repayments in this scenario were about right, which is higher than those in the C1C2 (50%) and DE (52%) social grade categories. Respondents in lower social grade categories were more likely to think that repayments were too low compared with AB respondents (C1C2 – 37%; DE – 30%; AB 26%).
• Education: Graduates were more likely to think that repayments in this scenario were about right compared with non-graduates (61% versus 50%).
• Gender: The differences by gender were not statistically significant.
Participants in the pop-up communities generally saw these repayments as affordable even though they still thought the actual cost of tuition was too high. Some participants also noted that the current system enabled individuals from lower socio-economic backgrounds to take part in higher education.
“So I'm wrong on the levels that they have to pay back the loans, which is a great relief. I'm actually pleasantly surprised at the whole system. There's not much I would change at all apart from the cost of tuition in the first place,” Member of the Parent Community”.
“Working well at the moment is that everybody capable has a chance to go to University and even if from a poorer background will be entitled to a Student Loan,” Member of the General Population Community.
Pop-up community members also thought that, despite the cost, higher education remained a worthwhile experience. Members of both pop-up community groups
highlighted both the academic and personal benefits of attending higher education. Some members of the parent community also mentioned that they had spoken to their children about higher education and had encouraged them to consider it.
36
achievement, pride and self-esteem that attending University gives is priceless,” Member of the General Population Community.
“It's a life-changing opportunity for many young people to become independent. The learning that you do at university is not just about the course that you're taking. In many cases first time that you are truly responsible for yourself and in many ways can be seen as a modern-day rite of passage,” Member of the General Population Community.
37
3. Potential changes to the student finance system
Introduction
This chapter examines the potential changes that participants would make to the student finance system, as well as the trade-offs that they would be happy with to bring these changes about. For example, if survey participants or community members wanted to see a reduction in the cost of tuition, they were asked which other policy levers within the system they would accept to see this change. Other topics covered were how students should choose the subjects that they study and whether students should receive grants rather than loans.
Potential changes to the current system
The survey asked respondents about different policy options that that the Government could introduce into the system. The survey asked respondents to rate these options out of ten, with the figure below showing percentages of participants who rated different policy options at an importance level of seven or above.
[image:37.595.72.518.500.733.2]The highest rated policy change was lowering tuition fees, with 52 percent of the total population rating this at seven out of ten or above. Lowering interest rates on loans (49%), letting graduates waiting until they are earning more before paying back loans (47%), and writing off loans earlier (45%) were also relatively highly rated options.
38
Further Analysis of important of policy options
Lowering Tuition Fees
• Age: There were significant differences by age in terms of the perceived
importance of lowering tuition fees. Respondents aged 18 to 34 (65%) were most likely to state that lowering tuition fees was a policy change they would like to see made. As the age categories increase, support for this change decreases, with 40 percent of respondents aged over 65 rating this as an important policy change.
• Employment Status: There was also variation by employment status. Fifty-five percent of full-time employed respondents rated lowering tuition fees as an important policy change, compared with 49 percent of part-time employees. Support drops to 42 percent among retired respondents.
• Social Grade: Fifty-seven percent of AB respondents thought it was important to reduce tuition fees, compared with 50 percent of C1C2 and 47 percent of DE respondents.
• Education: Graduates were much more likely to support lowering tuition fees than non-graduates were (63% versus 45%).
• Gender: Differences by gender were not statistically significant.
Lowering the rate of interest on student loans
• Age: There was significant variation in the stated importance of lowering interest rates according the age of respondents. Similar to lowering tuition fees, as the age categories increases, support for lowering interest rates on student loans
decreases. Fifty-seven percent of respondents aged 18 to 34 rated this as important, with 43 percent of respondents aged over 65 doing the same.
• Employment Status: Differences by employment status were not significant.
• Social Grade: AB respondents were the most likely to rate lowering interest rates as important at 53 percent, with C1C2 respondents showing less support (48%) and DE respondents even less (44%).
• Education: Graduates were more likely than non-graduates to rate this policy change as important (57% versus 44%). However, the percentage point difference is less than the difference witnessed for the importance of lowering tuition fees.
39
Letting graduates wait until they have higher salaries before they start to pay back their loans
• Age: In terms of the stated importance of letting graduates wait until they have higher salaries before they start to pay back loans, there were some significant differences by age. Whilst respondents in the lowest age category are more likely to rate this policy change as important (59%), it is not true to say that as age categories go up rated importance drops. While 35 percent of respondents aged 55 to 65 rate this policy change important, among those aged over 65 the figure is 43 percent.
• Employment Status: There was no significant variation by employment status.
• Social Grade: In contrast with the first two policy changes discussed, respondents in the DE social grade category were more likely to support this option; while their responses were similar to those in the AB category (51% versus 50%), there is a greater difference when DE respondents are compared with C1C2 respondents (51% versus 43%).
• Education: Graduates were more likely to rate this policy change as important compared with non-graduates (56% versus 42%), with the percentage point gap between these two broadly similar to both the lowering interest rates and lowering tuition fee changes.
• Gender: Differences between males and females were not statistically significant.
“Writing off” loans earlier
• Age: Differences by age, in terms of the importance of writing off loans earlier, were statistically significant. A similar pattern emerges to lowering tuition fees and lowering interest rates. Fifty-five percent of 18 to 34 years-olds rated this as
important. As the age categories increase, importance for this policy change ebbs, with 37 percent of over 65s rating this change as important.
• Employment Status: There was no significant variation of views by employment status.
• Social Grade: Unlike previously discussed policy options, differences in social grade with regards to the stated importance writing off loans earlier were not statistically significant.
• Education: Graduates were more likely to support this change than non-graduates were (52% versus 40%). Again, the magnitude of this difference compares closely to other policy changes already discussed.
40
Giving students a higher loan to help with living costs
• Age: As with other policy changes, this change was more likely to be supported by those in the 18 to 34 category (48%). Generally, as respondents’ ages go up, the perceived importance of this potential policy change drops. Support for this policy change is relatively lower among the 55-65 years-old category (33%) and among those respondents aged over 65 (34%).
• Employment Status: There was no significant variation in views by employment status.
• Social Grade: Similarly, differences by social grade were not significant.
• Education: The percentage point difference between graduates and non-graduates is slightly smaller than for other policy changes but is still statistically significant. Graduates were more likely than non-graduates to rate this change as important (45% versus 36%).
• Gender: There was no significant difference in terms of support for this policy change by gender.
Letting graduates pay less back each month
• Age: Differences by age in terms of the rated importance of letting graduates pay less back each month were statistically significant. Support for this policy change was relatively higher among 18 to 34 year-olds (41%) and 35 to 44 years-olds (40%). It was relatively lower among 45 to 54 year-olds (31%), 55 to 65 year-olds (32%) and those aged over 65 (29%).
• Employment Status: Differences by employment status were not statistically significant.
• Social Grade: Similarly, differences by social grade were not statistically significant
• Education: Consistent with other policy changes discussed, differences by
education level were statistically significant, with graduates more likely to rate this option as important compared with non-graduates (42% versus 30%).
• Gender: There was no significant differences by gender.
The pop-up communities also reflected concerns about the cost of tuition (much like the survey), with this being widespread across many members of both the parent and total population groups.
41
“The fees are too high. It is not value for money. The interest fees are too high above RPI. The details keep changing and making it hard to plan year to year,” Member of the Parent Community.
“Firstly I would change the maximum amount on tuition fees. Almost £10 grand is a ridiculous amount to ask somebody to payback or laden in debt,” Member of the Parent Community.
“I think lowering tuition fees is a prime priority. The quality of
university education has not improved since the steep increase of the fees,” Member of the Parent Community.
“I chose lowering tuition fees first as this seems the easiest way of keeping student debts down in the first place,” Member of the General Population Community.
Another recurring theme from the pop-up communities (also reflected in the survey results) was concern around the rates of interest charged on student loans, with some members stating that these were barely distinguishable from a regular bank loan.
“The interest rate is higher than taking out a personal loan which seems wrong as the graduates will actually be helping society and they are being penalised for going to university,” Member of the Parent Community.
“I worry about the fact that the interest rate is so high for all of the students paying back their loans, I think this is unfair. Yes, they need to pay the money back but why at such a high rate. Those who come from poor backgrounds will suffer most under the current system,”
Member of the Parent Community.
“I think the current interest rate is more like that of a Wonga loan,”
Member of the Parent Community.
42
Which trade-offs would participants be happy with?
The survey asked participants, who had rated any policy option as seven or above out of ten, what they would be willing to sacrifice within the system to achieve that. For
example, if a participant rated lowering tuition fees as being important, the survey asked which of the following policy options they would be willing to trade off to achieve it:
o Students get less support with living costs
o Graduates start paying their loans off sooner (i.e. before they start earning £25,000)
o Graduates pay back more every month
o Graduates pay back their loans for longer (for example, until they retire)
o Higher interest on student loans
o None of these, even if this means that the number of university places has to be reduced
o None of these, even if this means that tax payers have to pay more
If a respondent rated more than three policy options as above seven, they were allocated three trade-off questions at random.
The next section looks at the responses of participants who selected ‘lowering tuition fees’ and ‘lowering the rate of interest on students loans’ as important to them. This is because these two policy options were popular choices amongst respondents.
Figure 14 shows that – to see a reduction in tuition fees – participants most commonly stated they would be willing to accept graduates paying more back per month (30%), graduates paying off their loans sooner (27%) and graduates paying back their loans for longer (26%).
43
Figure 14: What would you accept to lower tuition fees? Base: all giving “lower tuition fees” seven out of ten or higher at D12 and allocated to this (403)
Similarly, the survey asked those participants who would like to see a change in the interest rates charged on loans what policy options they would be willing to change to achieve this.
Again, the top three most popular policy options were graduates paying more back each month (32%), graduates start paying off their loans earlier (30%) and, to a lesser extent, graduates paying off their loans for longer (22%). The least popular policy option to change to achieve lower interest rates on loans was higher tuition fees.
2 Question D1 was: If you could change the student finance system, how important would the options below
44
Figure 15: What would you accept to lower interest rates? Base: all giving “lower interest rates” seven out of ten or higher at D1 and allocated to this (393)
Figure 16 provides an illustration of the relative importance of the different policy options for survey participants. The Figure shows, for instance, that though ‘letting graduates wait until they have higher salaries before they start to pay back their loans’ appeared relatively important initially (see Figure 10) its importance falls away when participants are asked about trade-offs, with participants willing to sacrifice this policy option to achieve others policy options within the system.
45
Figure 16: Importance of different policy options with willingness to trade these options. Base: all respondents (1,064)3
Changes to the student finance system: demographic
differences
Figure 17 shows the percentage of respondents that would support changes to the
student finance system4. The questionnaire itself asked participants to rate each potential
policy change out of ten. The measure used in the figure below, as well as in subsequent
3 This chart combines the stated importance of different policy options and whether respondents were
willing to trade a policy option off to see a different policy option happen. The X axis demonstrates the stated importance of each policy option (rated seven or above). For example, when asked what policies they would like to see changed, ‘letting graduates wait until they have higher salaries before they start to pay back loans’ was important. The Y axis demonstrates how willing respondents were to trade off a policy option to see another policy option happen. In this instance, to see, for example, ‘lowering tuition fees’ or ‘lowering interest rates’, a higher percentage of respondents were willing to trade off ‘letting graduates wait until they have higher salaries before they start to pay back loans’.
4 Question D1 was: If you could change the student finance system, how important would the options below
46
figures shows the proportion of different groups that supported any change (i.e. rated any policy option seven or above).
In total, 81 percent of respondents rated at least one policy change option above a seven, suggesting that there is widespread support for some changes to be made to the student finance system.
Looking at specific sub groups, there were significant differences by social grade. AB respondents were very slightly more likely than C1C2 respondents to support any sort of change, but both of these social grades were much more likely than those in the DE social grade category.
There were also significant differences in the views of respondents who were parents of children under the age of 18 and parents who were not. Parents of children who are under the age of 18 were more likely to support a change to the student finance system (87% versus 78%). Those respondents aged 18 to 34 were also more likely to support a change, compared with all other age categories surveyed (90% versus 77%), again, this was statistically significant.
There was also a significant difference by education levels in terms of respondents’ support for any change. Eighty-eight percent of graduates supported any sort of change to the student finance system, which is eleven percentage points higher than
47
Figure 17: Percentage of different groups that would support any changes to the student finance system. Base: all respondents (1,064); Graduates (698); Non-graduates (366); DE respondents (277); C1C2 respondents (452); AB respondents (335); Aged 18 to 34 (289: Not aged 18 to 34 (775); Parent of children aged under 18
(299); Not parents of children under 18 (765)
Figure 18 shows the percentage of different parental groups rating lowering tuition fees and lowering the interest rate as seven out of ten or above for the aforementioned question D1.
The figure demonstrates that parents of prospective applicants are slightly more likely to support a reduction in the cost of tuition versus the total population and those
respondents who were not parents of prospective applicants (58% versus 52% and 51%). However, parents of prospective applicants are similarly likely to believe that lowering interest rates are important when compared with both the total population and those who are not parents of prospective applicants (all 49%).
48
Figure 18: Support for lowering tuition fees and lowering interest rates by parental groups. Base: all respondents (1,064); Parent of a prospective applicants (131); Not
a parent of a prospective applicants (933); Not a parent of children under 18 (765); Parent of children under 18 (299)
How students choose what to study
49
Figure 19: Should students choose their subject based on potential earnings or personal interests? Base: all respondents (1,064)
Further Analysis of how students should choose their subjects
• Age: Differences by age in terms of how students should choose their subjects were statistically significant. Fifty-seven percent of those aged 18 to 34 and those aged 45 to 54 thought that subject interest was most important, which is slightly lower than those aged 55 to 65 and aged over 65 (61% and 59% respectively). The least support for students choosing their subject based on interest was witnessed in the 35 to 44 year-old age category (54%). Those in the 35 to 44 and 45 to 54 age categories were more likely to think earnings potential was important (21% and 20% respectively) versus 18 percent of 18 to 34 year-olds, 18 percent of 45 to 54 year-olds and 19 percent of over 65s.
• Employment Status: There were no significant differences by employment status.
• Social Grade: Twenty percent of both AB and C1C2 respondents thought that earnings potential should be the basis for decisions on what subject to study, compared with 17 percent of DE respondents. There is difference in “don’t know” responses, with 21 percent of DE respondents saying that they did not know, compared with 12 percent of C1C2 and 10 percent of AB respondents. With regards to whether students’ subject choices should be guided by interest, there was less of a difference across groups (AB-59%, C1C2-58% and DE-56%).
50
of non-graduates thought earning potential should be the basis for subject choices compared with 17 percent of graduates. Non-graduates were also more likely to say that they did not know (15% versus 11%).
• Gender: Differences by gender were not significant.
These findings were in line with findings from the pop-up communities, with some members suggesting trying to predict the earnings potential of a course left too much to chance for the students. Members also noted that though some students might profit from higher earning courses in their future careers, others might not. This could leave those individuals with repayment terms for a higher earnings course without having the predicted high earnings job to pay for it.
“While this sounds like a good idea, this is trying to predict the future and sadly the initial calculation could be incorrect because so many changes e.g. who could have predicted Brexit?” Member of the Parent Community.
“It’s very assumptive and I feel that it'll work for some, and not for others, who might not reach where predicted on this ‘system’. Plus it could work the other way, you might have a lucky break and earn substantially more when not predicted to do so. I cannot see how this would work well,” Member of the General Population Community
Despite participants believing that students should choose their subject based on their interests, a mixed picture emerges when participants considered the impacts of choosing any subject has on the taxpayer.
51
Figure 20: Should students be able to choose any subject even if this costs taxpayers? Base: all respondents (1,064)
Further Analysis of whether students should be able to choose any subject even if it costs taxpayers
• Age: There were significant differences by age, in terms of attitudes towards whether students should be able to choose any subject even if it costs taxpayers. Thirty-nine percent of respondents aged 18 to 34 supported students having freedom to choose, with those aged over 65 least likely (16%). Twenty-nine
percent of those aged 35-44, 30 percent of those aged 45 to 54 and 26 percent of those aged 55 to 65 supported freedom to choose. Conversely, 46 percent of those aged over 65 supported restrictions, along with 42 percent of those aged 55 to 65. Younger age categories were less likely to support restrictions, with 24 percent of those aged 18 to 34, 33 percent of those aged 35 to 44 and 31 percent of those aged 45 to 54 supporting some restrictions.
• Employment Status: Thirty-two percent of those respondents who were full-time employed supported freedom of choice, compared with 33% of those who