Lions (
Phocarctos hookeri
) in Contrasting Environments
Elaine S. Leung1,2*, Ame´lie A. Auge´1,2¤, B. Louise Chilvers3, Antoni B. Moore2, Bruce C. Robertson1 1Department of Zoology, University of Otago, Dunedin, New Zealand,2School of Surveying, University of Otago, Dunedin, New Zealand,3Department of Conservation, Aquatic & Threats Unit, Wellington, New Zealand
Abstract
Foragers can show adaptive responses to changes within their environment through morphological and behavioural plasticity. We investigated the plasticity in body size, at sea movements and diving behaviour of juvenile female New Zealand (NZ) sea lions (Phocarctos hookeri) in two contrasting environments. The NZ sea lion is one of the rarest pinnipeds in the world. Most of the species is based at the subantarctic Auckland Islands (AI; considered to be marginal foraging habitat), with a recolonizing population on the Otago Peninsula, NZ mainland (considered to be more optimal habitat). We investigated how juvenile NZ sea lions adjust their foraging behaviour in contrasting environments by deploying satellite-linked platform transmitting terminals (PTTs) and time-depth recorders (TDRs) on 2–3 year-old females at AI (2007–2010) and Otago (2009–2010). Juvenile female NZ sea lions exhibited plasticity in body size and behaviour. Otago juveniles were significantly heavier than AI juveniles. Linear mixed effects models showed that study site had the most important effect on foraging behaviour, while mass and age had little influence. AI juveniles spent more time at sea, foraged over larger areas, and dove deeper and longer than Otago juveniles. It is difficult to attribute a specific cause to the observed contrasts in foraging behaviour because these differences may be driven by disparities in habitat/prey characteristics, conspecific density levels or interseasonal variation. Nevertheless, the smaller size and increased foraging effort of AI juveniles, combined with the lower productivity in this region, support the hypothesis that AI are less optimal habitat than Otago. It is more difficult for juveniles to forage in suboptimal habitats given their restricted foraging ability and lower tolerance for food limitation compared to adults. Thus, effective management measures should consider the impacts of low resource environments, along with changes that can alter food availability such as potential resource competition with fisheries.
Citation:Leung ES, Auge´ AA, Chilvers BL, Moore AB, Robertson BC (2013) Foraging Behaviour of Juvenile Female New Zealand Sea Lions (Phocarctos hookeri) in Contrasting Environments. PLoS ONE 8(5): e62728. doi:10.1371/journal.pone.0062728
Editor:Andreas Fahlman, Texas A&M University-Corpus Christi, United States of America
ReceivedDecember 10, 2012;AcceptedMarch 25, 2013;PublishedMay 6, 2013
Copyright:ß2013 Leung et al. This is an open-access article distributed under the terms of the Creative Commons Attribution License, which permits unrestricted use, distribution, and reproduction in any medium, provided the original author and source are credited.
Funding:Data presented in this paper were collected from a long-term study funded by the New Zealand Department of Conservation (DOC) investigation no. 1638, in parallel with fieldwork undertaken for the DOC Conservation Services Program (DOC project Pop 2007/01; http://www.doc.govt.nz/conservation/ marine-and-coastal/commercial-fishing/conservation-services-programme/) and through a levy principally on the quota holders of SQU6T. Funding was also provided by the University of Otago Zoology Department. E.L. and A.A. were supported by University of Otago Postgraduate Scholarships. The funders had no role in study design, data collection and analysis, decision to publish, or preparation of the manuscript.
Competing Interests:The authors have declared that no competing interests exist.
* E-mail: elaineswleung@gmail.com
¤ Current address: Australian Research Council Centre of Excellence for Coral Reef Studies, James Cook University, Townsville, Australia
Introduction
Foraging behaviour can be influenced by numerous intrinsic (e.g. physiological and morphological) and extrinsic (e.g. environ-mental) factors [1]. Within physiological and morphological constraints, foragers exhibit plasticity under different environmen-tal conditions and can show adaptive responses to changing conditions [2,3]. Geographic variation in life history traits that are influenced by environmental factors (e.g. resource availability) has been observed in many taxa, including rodents [4,5], carnivores [6,7] and ungulates [8,9]. Investigating this plasticity allows us to understand species-specific responses to changing environments [10]. Hence, geographic comparisons across populations of the same species in different environments are useful in defining the degree of adaptation and in characterizing the range of behavioural traits [11].
Individuals from populations that exploit lower quality habitats (e.g. food resources are less accessible, lower quality and/or scarce) may need to expend more effort foraging than conspecifics
The New Zealand (NZ) sea lion (Phocarctos hookeri) provides an opportunity to examine plasticity in foraging behaviour of an understudied age class between contrasting environments, in a declining species of management concern. The NZ sea lion is one of the rarest and most highly localized pinnipeds (sea lions, seals and walruses) in the world [24]. The species is listed as ‘‘Vulnerable’’ by the International Union for Conservation of Nature [25] and as ‘‘Nationally Critical’’ by the NZ threat classification system [26]. The NZ sea lion once ranged along the entire length of the NZ coast, extending to the NZ subantarctic islands in the south [27]. This species was extirpated from the NZ mainland and hunted to near extinction in the offshore islands by the 19th century [27]. At present, the majority of the species is found in the NZ subantarctic Auckland Islands (AI; 71% of total pup production; 2010 pup production 1814639) [28]. In 1994, a small breeding population of NZ sea lions was established following a re-colonisation event on the Otago Peninsula on the NZ mainland by a single matriarch born in AI [29]. The Otago population currently only produces 4–6 pups per year [28].
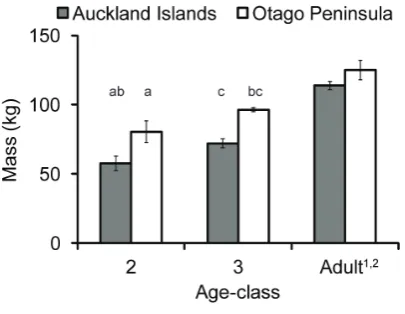
Several differences have been observed between lactating females from AI vs. those from Otago. Lactating NZ sea lions at AI are one of the deepest, longest diving otariids [30]. AI females also cover greater distances during foraging trips than many other otariid species and are hypothesized to operate at or close to their physiological maximum in a marginal foraging environment [30– 32]. In stark contrast, lactating NZ sea lions at Otago are amongst the shallowest, shortest diving otariids [33]. Otago females have small foraging ranges and short duration foraging trips compared to AI females [34] and are hypothesized to exploit more optimal habitat than AI females [34,35]. Furthermore, adult female NZ sea lions at Otago are also larger than females at AI (125.167.0 kg vs. 113.862.9 kg, respectively) [30,34]. AI female NZ sea lions have amongst the lowest milk fat content reported in otariids (21.3%) [36], but Otago females have milk fat content over 1.5 times higher than AI females [37].
These large disparities between the two populations of adult female NZ sea lions suggest the extreme foraging behaviour, smaller size and low milk fat content of AI females are not species-specific, but demonstrate plasticity in behaviour, morphology and physiology in response to differences in their environment. Prey species also differed between AI and Otago NZ sea lion diet [35,38], with the main prey species at AI having lower energy content (arrow squid, Nototodarus sloanii, 6.3 kJ/g; octopus, Enteroctopus zelandicus, 3.8 kJ/g) [38,39] than the main prey species of Otago females (barracouta, Thyrsites atun, 6.1 kJ/g; jack mackerel, Trachurus sp., 7.6 kJ/g) [40,41]. This suggests the food resources at AI are lower quality than at Otago [35]. These contrasts in behaviour, morphology and diet further emphasize the hypothesized low prey resources around AI [30]. The AI are likely a marginal foraging environment with limited and/or low quality prey resources given that AI rise is an iron-limited area with low levels of phytoplankton biomass and primary production [42]. Primary production in this region is predominantly limited by the combination of available light and low levels of dissolved iron [43]. Juveniles do not have as high energetic costs as lactating females [44] and their foraging behaviour is not constrained by having to return ashore periodically to nurse dependent young. Given that juveniles and lactating females face different limitations on foraging behaviour, these two groups likely adapt differently to environmental and human-induced changes in prey availability and distribution. Thus, we were interested in examining whether the significant differences in the foraging behaviour of adult female NZ sea lions at AI and Otago Peninsula were also evident in juveniles. By recording juvenile foraging behaviour in these two
areas, we investigated the range of plasticity in body size, at sea movements and diving behaviour of an understudied age class in the NZ sea lion. We sought to answer: (1) Does juvenile female NZ sea lion foraging behaviour differ between two contrasting environments? and (2) Is the foraging behaviour of juvenile female NZ sea lions influenced by their mass, age and/or habitat? We hypothesized that the foraging behaviour of juvenile female NZ sea lions at AI is mainly influenced by the low resource habitat, as demonstrated by AI females expending more foraging effort (e.g. longer durations at sea, forage over larger areas, dive deeper and longer) than Otago females.
Methods
Ethics Statement
This study was conducted with approval from the Department of Conservation (DOC) and University of Otago Animal Ethics Committees (permit numbers DOC AEC158, DOC AEC 200, DOC AEC 174 and University of Otago AEC 28/10 and 72107001). Instrument deployments were performed under inhalant gas anaesthesia, and all efforts were made to minimize pain and suffering.
Capture and Deployment
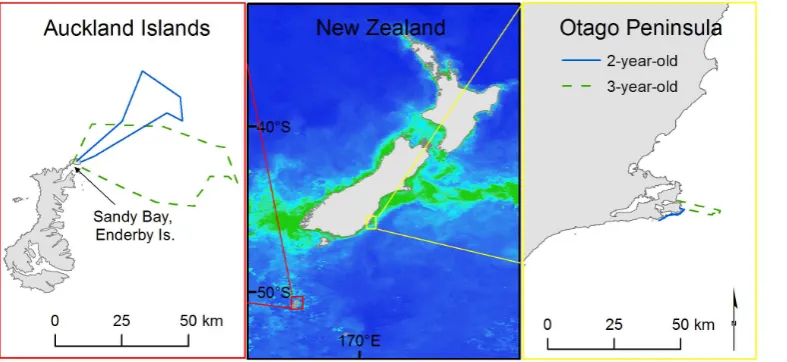
We collected data over four seasons from January–February (austral summer), 2007–2010 at Sandy Bay, Enderby Island in the NZ subantarctic AI and over two seasons from March–May (austral autumn), 2009–2010 at the Otago Peninsula, South Island, NZ (Fig. 1). Logistically, we were unable to collect data at both sites during the same season because the same instruments and capture gear were used at both study sites. We addressed the potential effects of seasonal differences in the discussion.
Study animals included a sample of 2 and 3-year-old juvenile female NZ sea lions at AI and the entire known population of 2 and 3-year-old females at Otago. All animals were aged accurately based on flipper-tags that were attached within a few months after birth. We should note the logistical difficulties of deploying and recovering instruments on juveniles, a rarely seen age group (e.g. less than 4% of known-aged individuals seen over the study period at Sandy Bay were 2–3 year-old females; B.L. Chilvers, unpublished data), restricted our sample sizes at AI whereas study animals at Otago were limited by the small population size. We captured animals using a specially designed hoop net and physically restrained them with two handlers [30]. The juveniles were anaesthetised using isoflurane delivered with oxygen to a mask via a field-portable vaporiser [45] and then strapped into a custom designed restraint frame and weighed using a 200 kg capacity scale (60.5 kg, Salter Housewares) suspended from an aluminium tripod.
allowed to recover and observed each animal until it was fully conscious. We recaptured each animal before the end of the field season to retrieve instruments.
Satellite Data
Animal positions at sea were estimated by the Argos satellite system and assigned to different location classes based on their accuracy. However, there are large variations in accuracy of the various location classes [46]. We used different satellite data correction methods for AI and Otago data in order to obtain the best estimates of foraging ranges; our choice of method depended on the configuration of the sites and the foraging characteristics of the animals. Due to the large scale of differences found in at sea movements between AI and Otago juvenile females, using different filters did not affect the validity of the comparison between the sites. Satellite locations from animals at AI were corrected and interpolated with a state-space model, fitted into a hierarchical Bayesian context [47,48]. We ran the models using WinBUGS [49] and R [50]. The analyses were conducted hierarchically by grouping tracks from multiple individuals within the same age group [48]. To fit the model, two Markov Chain Monte Carlo (MCMC) chains were run at a four hour time step for 40 000 iterations, with a burn-in of 20 000. To reduce sample autocorrelation, every tenth point of the remaining 20 000 samples was retained for a net of 4000 MCMC samples in each chain.
As a result of the small spatial scale of the satellite data of Otago females and based on personal observations of foraging activities of sea lions within a few meters from shore during our study, a custom-designed algorithm based on Freitas et al. [51] was used to filter Otago satellite data [34]. In addition to the Freitas et al. [51] filter (using threshold values of 3 m/s for speed and of 30u for inside turning angle), we followed these steps: (1) all locations with the highest Argos accuracy location class (i.e. LC 3) were kept during filtering, (2) locations with no neighbouring location closer than 5 km (based on a value of 4.8 km for the 95% confidence interval (CI) of nearest neighbour distances within each female’s unfiltered dataset) in the dataset of a particular animal were removed and (3) the remaining locations that were onshore but ,1 km from shore were moved to the nearest location at sea [34]. To reduce sample autocorrelation, we only retained the earliest
location if two or more locations were taken,30 minutes apart [34].
For AI females, we defined complete foraging trips as trips with the start and end locations within 10 km of Enderby Island [52]. At Otago, we defined complete foraging trips as trips with the start and end locations on land and the animals were at sea for more than two hours [34]. We restricted calculations of mean distance travelled per trip to complete foraging trips. Maximum distance travelled from the study site per foraging trip was measured in ArcGIS 9.3.1 [53] as the straight-line distance from the furthest recorded point to the study site, using great circle measurement type. We used filtered locations to calculate the 50% and 95% kernel utilisation distributions (UDs) using Home Range Tools [54] for ArcGIS 9.3.1. We calculated fixed kernel UDs using smoothing factors calculated from the ad hoc method (bandwidth = 0.5) [55] and kernel UDs were used as a representation of sea lion foraging ranges [48].
Dive Data
TDRs sampled dive depth (60.5 m) every 5 s when wet. Depth readings were corrected for shifts in the pressure transducer at the surface of the time-depth recorders before analyses. The dive profiles were visually examined for offsets from the surface and the zero-offset correction was performed using the offset method in the package diveMove [56] in R software v2.11.1 [50]. We only analysed dives$3 m in depth to avoid inaccuracies in determining when sea lions were at the surface [33]. We analysed diving data by producing summary statistics for each dive using diveMove [56]. The dive summary file for each individual included the date, time, maximum depth and duration of each dive. A period ashore began after the tag was dry for 20 minutes and ended after the tag was wet for 30 seconds. Summary statistics (at sea duration and percent time spent diving, transiting and ashore) were calculated for each foraging trip.
Statistical Analysis
[image:3.612.60.454.62.243.2]We tested for mass differences between age and study site groups with t tests or Wilcoxon rank sum tests. We also derived a
Figure 1. Study sites, with chlorophyll a concentration and juvenile female New Zealand sea lion satellite tracks.The scale of chlorophyll a concentration ranges from dark blue (0.1 mg/m3) to green (3.0 mg/m3). Chlorophyll concentrations calculated from ‘Ocean Colour Web’
Aqua MODIS standard mapped images (4 km resolution). The satellite tracks are from representative juvenile female New Zealand sea lions at the subantarctic Auckland Islands and Otago Peninsula, New Zealand.
body condition index (BCI) from the residuals of a linear regression of mass against body length (Fig. S1) [57]. Study site differences in BCI were analysed in a linear model with study site as the predictor variable. Full morphometric data for each individual animal are provided in the Supporting Information (Table S1).
Although inter-annual variation may influence the foraging behaviour observed, small sample sizes each year precluded the differentiation of annual and individual differences. Furthermore, foraging studies on individual adult NZ sea lions followed across several years indicate little annual variability in foraging behaviour [52]. Due to limited annual sample size, we pooled the data across all years. Foraging behaviour was assessed at the scale of individual foraging trips and individual dives. Trip characteristics included at sea duration, trip distance and the maximum straight line distance travelled from the study site. Diving behaviour was characterized by the maximum dive depth and duration of each foraging trip and also by the overall mean dive depth and duration. We ran multiple linear mixed effects models using foraging behaviour characteristics as response variables and individual animal as the random effect on repeated measures data, using the R package nlme [58]. The linear mixed effects models contained five predictor variables (study site, mass, age, study site:mass and age:mass). Residual plots were examined to assess model fits and where necessary, the response variables were power, log or square root transformed to improve the normality of the model residuals. We centred and standardized the age and mass predictor variables to improve the interpretability of regression coefficients [59]. To identify the relative importance of the predictor variables (study site, mass, age, study site:mass and age:mass) across the different foraging trip characteristics and to generate weighted coefficient estimates, we used a model averaging approach based on the Akaike Information Criterion correction for small sample size (AICc) scores [60]. We fitted a global model in R using the maximum likelihood method. A full sub-model set was generated from the global model using the R package MuMIn [61]. Models were ranked by their AICc scores and models with D,2 were included in the confidence model set [60]. To determine which variables had the strongest effect on foraging trip characteristics, we averaged the models using the zero method [62], where a parameter estimate (and error) of zero are substituted into models where the parameter is absent and parameter estimates are calculated by averaging over the model set [60]. We accounted for autocorrelation within individual animals (corAR1(form =, 1|a-nimal id)) and used a power variance function to allow for within group heteroscedasticity [63]. Lists of the model sets are provided in the Supporting Information (Tables S2 and S3).
Primary Productivity
We assessed the primary productivity using average chlorophyll a concentration as a proxy (Fig. 1) at the two study sites during the study period (January–May, 2007–2010). We calculated mean values for each month from ‘Ocean Colour Web’ Aqua MODIS standard mapped images (4 km resolution) [64] using areas defined by the sea lions’ foraging ranges. Chlorophyll a concentrations were compared between study sites with a Wilcoxon rank sum test.
Results
Between January–February 2008–2010, we retrieved satellite data for 19 females (seven 2-year-old and twelve 3-year-old females) and dive data for 12 females (three 2-year-old and nine 3-year-old females) at AI (Table 1). Between March–May, 2009–
2010, we retrieved satellite and dive data for the five known-to-be-alive juvenile females at the Otago Peninsula (three 2-year-old and two 3-year-old females; Table 1).
Mass and Body Condition Index
The 3-year-old juvenile females were significantly heavier than 2-year-olds at AI (t =24.9, df = 17,P,0.01; Fig. 2), but not at Otago (W = 0, P = 0.20; Fig. 2). Otago juvenile females were significantly heavier than AI animals (2-year-olds t =24.7, df = 8, P,0.01; 3-year-olds t =25.7, df = 12,P,0.01). Overall, Otago animals had better body condition than AI animals (Table S1; Fig. S1). However, there was no significant difference in BCI by study site (t = 0.6, df = 22,P = 0.53).
Study Site Differences in Juvenile Foraging Behaviour
Study site had the most important effect on all foraging behaviour characteristics and the effect of study site on all characteristics was large as the confidence interval for study site did not include zero (Tables 2 and 3). Both mass and age had small effects on the various foraging behaviour characteristics (Tables 2 and 3). At sea durations for AI juvenile females were three times longer than Otago females (Table 4). AI trip distances were five times longer (Fig. 1), with maximum distance travelled from the study site 10–20 times further for AI females than Otago females (Table 4).
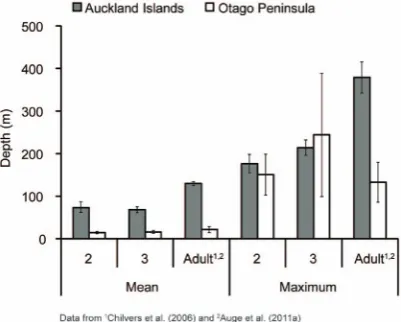
AI juvenile females dove longer and deeper than Otago females (Tables 3 and 4; Figs. 3 and 4). Average dive durations for AI females were,1.5 times longer than Otago durations although the maximum dive durations reached were within a similar range for both sites (Table 4). Average dive depths were approximately four times deeper for AI females than Otago females; however, the maximum dive depths reached were within a comparable range for both sites (Table 4; Fig. 3). However, dives .100 m represented only 1% of Otago juvenile dives compared with 33% of AI juvenile dives.
Primary Productivity
The average chlorophyll a concentration was significantly higher at the Otago Peninsula (1.7360.84 mg/m3) than the AI (0.4360.12 mg/m3) for the duration of the study period (W = 319,P,0.01). The yearly averages ranged from 0.41–0.45 mg/ m3at AI and 1.21–2.48 mg/m3at Otago from 2007–2010.
Discussion
contribute to the observed contrasts in foraging behaviour, such as differences in habitat/prey characteristics, conspecific density levels or interseasonal variation. Our results mirror the observed differences in body size and foraging behaviour of adult NZ sea lions at AI and Otago and corroborate the hypothesis that AI are less optimal habitat than Otago [30,32–34].
Habitat Effect on Juvenile Foraging Behaviour and Body Condition
Although foraging behaviour is constrained by numerous factors, the distribution of a predator’s foraging is largely influenced by the distribution of their prey. The short trip distances and durations of Otago females suggest there is sufficient food near-shore for them. However, predators will need to increase foraging effort, search time and search area (e.g. increase dive frequency, foraging trip duration and distances) when there is lower prey abundance around the central place [12,65–67]. The larger foraging area, longer trip durations and deeper dive depths at AI imply prey resources are scarcer and less accessible, as was suggested with Antarctic fur seals at Heard Island [12]. The hypothesis that AI has lower prey resources is supported by the lower levels of primary productivity in AI sea lion foraging areas
compared to Otago. Furthermore, the difference in diet (i.e. prey species) between NZ sea lion populations [35,38] suggest that prey availability differs between sites. Increased travel costs (e.g. further distance to foraging grounds, deeper depths or greater vertical movement) need to be offset by higher energy gains [68]. Despite higher travel costs, AI animals exploit less energy dense prey than Otago individuals [35,38,39]. This indicates that AI individuals are expending more foraging effort for lower energetic payoffs (e.g. less profitable prey) than Otago animals. The increased foraging effort may be a reflection of the behavioural plasticity (e.g. foraging strategies) required for successful foraging of different prey types and may indicate an adaptive trait in a species that is experiencing fluctuating conditions. It is important to note that although diet composition differed between AI and Otago populations, diet was similar between juvenile and adult NZ sea lions at each site [35,37,38].
The mass of AI study animals were within the range of mean mass calculated for 2 and 3-year-old female NZ sea lions in a larger study [69] and thus indicates that we did not inadvertently sample only smaller individuals. Nevertheless, Otago female NZ sea lions were heavier than AI females, for both juveniles and adults (Fig. 2) and had better body condition (Fig. S1). However, these animals exhibited diving behaviour contrary to what was expected based on their size. Mass and diving ability are positively correlated in diving mammals and birds, with larger animals diving deeper and longer than smaller individuals [70]. Interest-ingly, the smaller AI juvenile females on average exhibited extreme diving behaviour compared to the larger Otago juveniles (Table 4; Figs. 3 and 4), despite Otago individuals having access to deep water (depths .200 m) within 20 km of Otago. Further-more, Otago juvenile females demonstrated the ability to dive to similar maximum depths and durations as AI individuals (Fig. 3, Table 4), suggesting that there are no differences in physiological capacity between the two populations in their ability to exploit similar depths. The larger mass of Otago animals is likely a reflection of the increased food resources in this region, especially given that the original recolonizing female at Otago was from AI and thus the Otago population is not from a different genetic stock than AI.
Effects of Differences in Competition Levels and Season
Although differences in habitat-related effects such as prey availability may influence the observed contrasts in juvenile NZ sea lion foraging behaviour, confounding factors such as
differ-Table 1.Sample size, trip and dive characteristics of 2 and 3 year-old juvenile female New Zealand sea lions with satellite and dive data at the subantarctic Auckland Islands and Otago Peninsula on mainland New Zealand; values are mean6standard error of mean.
Satellite data Dive data
Study site Age
(years) Mass (kg)
Sample size
No. of days deployed
No. of foraging trips
Sample
size No. of dives Mean dive duration
(min) Maximum dive duration (min)
Auckland Islands
2 57.662.7 7 16.463.0 5.460.7 3 20796526 3.160.7 5.260.3
3 72.161.7 12 12.161.6 5.461.0 9 14746262 3.360.5 6.560.3
Otago Peninsula
2 80.564.0 3 35.362.4 31.062.0 3 573061328 1.860.6 6.461.0
3 96.360.8 2 39.067.0 33.566.5 2 782863841 1.860.7 7.160.0
[image:5.612.61.561.100.240.2]doi:10.1371/journal.pone.0062728.t001
Figure 2. Mass of juvenile and adult female New Zealand sea lions at Auckland Islands and Otago. abcValues that are
[image:5.612.59.262.518.675.2]Table 2.Summary results of linear mixed effects models run on juvenile New Zealand sea lion foraging trip characteristics: effects of each variable on at sea duration, trip distance and maximum distance from study site.
Trip characteristic Variable Estimate* SE Lower 95% CI Upper 95% CI Relative importance1
At sea duration (h; log transformed) Auckland Islands 3.560 0.134 3.290 3.820
Study site 21.100 0.280 21.650 20.553 1.00
Age 20.005 0.050 20.104 0.093 0.20
Mass 0.017 0.050 20.138 0.172 0.23
Trip distance (km; square root transformed)
Auckland Islands 10.600 1.030 8.570 12.600
Study site 26.590 1.960 210.400 22.740 1.00
Age 20.449 0.705 21.830 0.932 0.48
Mass 0.335 0.844 21.320 1.990 0.37
Max distance from study site (km; power transformed)
Auckland Islands 1.620 0.033 1.560 1.680
Study site 20.471 0.068 20.604 20.337 1.00
Age 20.003 0.011 20.025 0.019 0.18
Mass 20.011 0.026 20.061 0.039 0.47
Study site:mass 20.021 0.049 20.117 0.075 0.23
*Effect sizes have been standardised following Schielzeth (2010). Estimate values for ‘Study site’ indicate the difference in trip characteristics between study sites. 1
Relative importance values in bold indicate the confidence intervals for these parameter estimates do not include zero, indicating these predictor variables have a strong effect on foraging behaviour.
SE, standard error; CI, confidence interval. doi:10.1371/journal.pone.0062728.t002
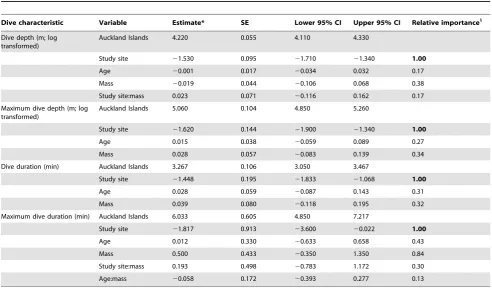
Table 3.Summary results of linear mixed effects models run on juvenile New Zealand sea lion dive characteristics: effects of each variable on dive depth and duration.
Dive characteristic Variable Estimate* SE Lower 95% CI Upper 95% CI Relative importance1
Dive depth (m; log transformed)
Auckland Islands 4.220 0.055 4.110 4.330
Study site 21.530 0.095 21.710 21.340 1.00
Age 20.001 0.017 20.034 0.032 0.17
Mass 20.019 0.044 20.106 0.068 0.38
Study site:mass 0.023 0.071 20.116 0.162 0.17
Maximum dive depth (m; log transformed)
Auckland Islands 5.060 0.104 4.850 5.260
Study site 21.620 0.144 21.900 21.340 1.00
Age 0.015 0.038 20.059 0.089 0.27
Mass 0.028 0.057 20.083 0.139 0.34
Dive duration (min) Auckland Islands 3.267 0.106 3.050 3.467
Study site 21.448 0.195 21.833 21.068 1.00
Age 0.028 0.059 20.087 0.143 0.31
Mass 0.039 0.080 20.118 0.195 0.32
Maximum dive duration (min) Auckland Islands 6.033 0.605 4.850 7.217
Study site 21.817 0.913 23.600 20.022 1.00
Age 0.012 0.330 20.633 0.658 0.43
Mass 0.500 0.433 20.350 1.350 0.84
Study site:mass 0.193 0.498 20.783 1.172 0.30
Age:mass 20.058 0.172 20.393 0.277 0.13
*Effect sizes have been standardised following Schielzeth (2010). Estimate values for ‘Study site’ indicate the difference in trip characteristics between study sites. 1
Relative importance values in bold indicate the confidence intervals for these parameter estimates do not include zero, indicating these predictor variables have a strong effect on foraging behaviour.
[image:6.612.63.556.399.687.2]ences in conspecific density levels or season may also impact foraging behaviour. For instance, AI individuals may face higher intraspecific competition because ,10,000 NZ sea lions inhabit the NZ subantarctic islands [71], compared to,170 NZ sea lions at Otago (McConkey, pers. comm.). Thus, AI individuals may need to expend greater foraging effort in response to higher competition for prey resources. However, while the NZ sea lion populations at AI have declined over the last 15 years, the foraging behaviour of adult females there has not changed over this period [30]. This trend suggests that NZ sea lion foraging behaviour at AI is likely not constrained by intraspecific competition [34]. Furthermore, intra and interspecific competition also exist at Otago since there are numerous marine predators that forage around Otago, including,20 000 NZ fur seals (Arctocephalus fosteri) [72], which feed on the same prey species and in similar areas as NZ sea lions [73]. Thus, differences in competition levels likely have less influence than habitat-related effects on the large contrasts in foraging behaviour between females at Otago and AI. Seasonal differences in prey distribution may also explain differences in foraging behaviour between AI and Otago individuals since data were collected in the austral summer and
autumn, respectively. For example, prey may be distributed at deeper depths or farther locations during the summer and at shallower depths and closer to colonies during the autumn. Hence, it is possible that juvenile NZ sea lions may exhibit more similar foraging behaviour in the same season. However, diet studies of both populations in the autumn have found AI and Otago animals forage on different prey types in the same season [35,38], with AI animals mainly targeting prey (e.g. arrow squid) found from surface waters to 500 m depth [74], while Otago individuals largely exploit prey (e.g. barracouta and jack mackerel) found from near the surface to 200 m depth within the continental shelf [75]. Thus, disparities in foraging behaviour are likely due to differences in prey behaviour at the two sites, with the main prey of NZ sea lions at AI being distributed at deeper depths than at Otago. Furthermore, primary productivity is higher at Otago than AI across all seasons [64], suggesting higher resources at Otago year-round. Hence, similarly, it is likely that the observed differences in foraging behaviour are more strongly driven by habitat-related effects than seasonal differences.
Implications of Suboptimal Habitat for Conservation Management
[image:7.612.62.556.88.258.2]Low food availability can have large impacts on population dynamics since unfavourable environmental conditions can have immediate effects on animal performance (e.g. lower survival or fecundity) [76]. Our study provides further support for Auge´ et al’s [34] conclusion that current population management models probably overestimate the rate of population increase of NZ sea lions by modeling populations exploiting optimal habitat. More-over, fisheries operations around AI may further reduce prey resources in this foraging environment [77]. The predominant human threat to the NZ sea lion at AI is the commercial arrow squid trawl fishery, both through mortality from bycatch and potential resource competition [28]. Juveniles are more vulnerable than adults to decreases in prey availability due to their restricted foraging ability [76] and thus, are likely more susceptible to resource competition. Resource competition with fisheries has been reported for numerous pinniped species [78–80] and is also likely for the NZ sea lion [77]. However, management measures to mitigate NZ sea lion-fishery interactions only focus on reducing bycatch rates in the squid fishery and do not consider the potential impacts of resource competition [81]. Given the continued decline
Table 4.Trip and dive characteristics of 2 and 3-year-old juvenile female New Zealand sea lions at the Auckland Islands and Otago Peninsula; values are means6standard error of mean (SEM).
2-year-old females 3-year-old females Overall mean
Trip or dive
characteristic Auckland Islands Otago Auckland Islands Otago Auckland Islands Otago
At sea duration (h) 36.466.7 11.662.9 33.765.0 12.063.6 34.764.0 11.862.3
Trip distance (km) 119.1619.1 19.8610.1 93.7613.3 16.6610.7 103.0610.9 18.567.7
Max. distance from study site per foraging trip (km)
37.166.3 2.860.8 32.364.5 1.660.6 34.163.7 2.360.5
Dive depth (m) 73.466.2 14.261.2 67.863.4 15.861.6 69.262.9 14.860.9
Max. dive depth per foraging trip (m)
141.6623.7 30.662.3 214.1616.5 33.663.1 153.9613.8 31.861.9
Dive duration (min) 3.160.2 1.860.2 3.360.1 1.960.2 3.260.1 1.860.1
Max. dive duration per foraging trip (min)
4.760.5 4.360.5 5.860.3 4.960.6 5.560.3 4.560.4
doi:10.1371/journal.pone.0062728.t004
Figure 3. Mean and maximum dive depths for juvenile female New Zealand sea lions at Auckland Islands and Otago.Mean6
standard error of mean.
[image:7.612.60.261.522.683.2]of the nationally critical NZ sea lion, effective management measures should also consider the impacts of potential resource competition and the suboptimal habitat of AI.
Conclusions
Juvenile NZ sea lion foraging behaviour differed between study sites, with age and mass having little influence on foraging behaviour. Otago juvenile and adult female sea lions are larger and feed on higher energy prey [35] with less foraging effort [30,33] in a higher productivity area, than AI juveniles and adult females. The plasticity in morphology and foraging behaviour exhibited in juvenile and adult NZ sea lions may be an adaptive trait in a species that is experiencing fluctuating conditions (e.g. differences in food availability and prey behaviour). However, we cannot attribute the contrasts in NZ sea lion foraging behaviour to a specific cause because various mechanisms (e.g. differences in competition levels or season) may also influence the observed differences in foraging behaviour. Nevertheless, the deeper dive depths and farther trip distances of AI juvenile NZ sea lions suggest prey are less accessible and scarcer at AI than at Otago. The combination of greater foraging effort, smaller body size, lower energy diet and lower productivity at AI suggest AI are less optimal habitat (e.g. lower quality and less prey resources) than
Otago. It is likely more difficult for juveniles to successfully acquire food in suboptimal habitat given their restricted foraging ability compared to adults. This work is critical information for the management of NZ sea lions and our results support the suboptimal habitat hypothesis. When this is added to the known low juvenile survival and low reproductive rates of AI NZ sea lions [82,83], this emphasizes that management of this species needs to be precautionary.
Supporting Information
Figure S1 Relationship between mass and body length of juvenile (2 and 3-years-old) female New Zealand sea
lions (Phocarctos hookeri) and a definition of the body
condition index (BCI) as the residual value between observed and expected mass.
(DOC)
Table S1 Morphometric, dive and satellite data avail-able for individual juvenile female New Zealand sea
lions (Phocarctos hookeri) at Auckland Islands (AI) and
Otago Peninsula. BCI, body condition index.
[image:8.612.63.461.77.432.2](DOC)
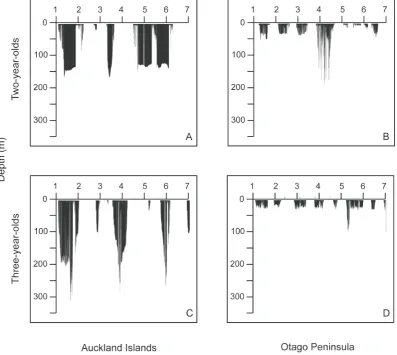
Figure 4. Dive profiles of representative juvenile female New Zealand sea lions at Auckland Islands and Otago.Juvenile females: A) 2-years-old Auckland Islands, B) 2-2-years-old Otago, C) 3-2-years-old Auckland Islands and D) 3-2-years-old Otago.
Table S2 Results of linear mixed effects models run on
juvenile New Zealand sea lion (Phocarctos hookeri)
foraging trip characteristics: at sea duration, trip distance and maximum distance from study site.
(DOC)
Table S3 Results of linear mixed effects models run on
juvenile New Zealand sea lion (Phocarctos hookeri) dive
characteristics: mean and maximum dive depth and mean and maximum dive duration.
(DOC)
Acknowledgments
We thank in particular J. Amey, M. Blake, L. Boren, S. Childerhouse, J. Fyfe, K. Geschke, R. Hood, K. Morgan, A. Maloney, H. McConnell, K.
McInnes, N. McNally, L. Meynier, G. Oakes, M. Riki and W. Roe for their assistance with animal captures. We are grateful to I. Jonsen for providing the state-space model R code and to the New Zealand Sea Lion Trust for keeping track of Otago individuals. M. Krkosek and an anonymous reviewer provided valuable comments on this manuscript.
Author Contributions
Conceived and designed the experiments: BC AA. Performed the experiments: BC AA EL. Analyzed the data: EL AA. Contributed reagents/materials/analysis tools: EL AA BC AM BR. Wrote the paper: EL. Obtained funding and permit: BC. Provided advice on data and statistical analysis: AA AM BR.
References
1. Hindell MA, Crocker DE, Mori Y, Tyack P (2010) Foraging behaviour. In: Boyd IL, Bowen WD, Iverson SJ, editors. Marine mammal ecology and conservation: A handbook of techniques. New York: Oxford University Press. 243–262. 2. Bolnick DI, Svanback R, Fordyce JA, Yang LH, Davis JM, et al. (2003)
Comparative approaches to intra-population niche variation. Integrative and Comparative Biology 43: 1078–1078.
3. Tinker MT, Bentall G, Estes JA (2008) Food limitation leads to behavioral diversification and dietary specialization in sea otters. Proceedings of the National Academy of Sciences of the United States of America 105: 560–565. 4. Wauters L, Dhondt AA (1989) Body-weight, longevity and reproductive success
in red squirrels (Sciurus vulgaris) Journal of Animal Ecology 58: 637–651. 5. Quispe R, Villavicencio CP, Cortes A, Vasquez RA (2009) Inter-Population
Variation in Hoarding Behaviour in Degus,Octodon degus. Ethology 115: 465– 474.
6. Monson DH, Estes JA, Bodkin JL, Siniff DB (2000) Life history plasticity and population regulation in sea otters. Oikos 90: 457–468.
7. Bojarska K, Selva N (2012) Spatial patterns in brown bearUrsus arctosdiet: the role of geographical and environmental factors. Mammal Review 42: 120–143. 8. Pettorelli N, Gaillard JM, Yoccoz NG, Duncan P, Maillard D, et al. (2005) The response of fawn survival to changes in habitat quality varies according to cohort quality and spatial scale. Journal of Animal Ecology 74: 972–981.
9. Sand H (1996) Life history patterns in female moose (Alces alces): The relationship between age, body size, fecundity and environmental conditions. Oecologia 106: 212–220.
10. Staniland IJ, Morton A, Robinson SL, Malone D, Forcada J (2011) Foraging behaviour in two Antarctic fur seal colonies with differing population recoveries. Marine Ecology Progress Series 434: 183–196.
11. Endler JA (1986) Natural selection in the wild. In: Levin SA, Horn HS, editors. Monographs in population biology 21. Princeton: Princeton University Press. 12. Staniland IJ, Gales N, Warren NL, Robinson SL, Goldsworthy SD, et al. (2010)
Geographical variation in the behaviour of a central place forager: Antarctic fur seals foraging in contrasting environments. Marine Biology 157: 2383–2396. 13. Millar JS, Hickling GJ (1990) Fasting endurance and the evolution of
mammalian body size. Functional Ecology 4: 5–12.
14. Daunt F, Afanasyev V, Adam A, Croxall JP, Wanless S (2007) From cradle to early grave: juvenile mortality in European shagsPhalacrocorax aristotelisresults from inadequate development of foraging proficiency. Biology Letters 3: 371– 374.
15. Heinsohn RG (1991) Slow learning of foraging skills and extended parental care in cooperatively breeding white-winged choughs. American Naturalist 137: 864– 881.
16. Horning M, Trillmich F (1997) Ontogeny of diving behaviour in the Galapagos fur seal. Behaviour 134: 1211–1257.
17. Owen-Smith N (1990) Demography of a large herbivore, the greater kudu
Tragelaphus strepsiceros, in relation to rainfall Journal of Animal Ecology 59: 893– 913.
18. Jeglinski JWE, Werner C, Robinson PW, Costa DP, Trillmich F (2012) Age, body mass and environmental variation shape the foraging ontogeny of Galapagos sea lions. Marine Ecology Progress Series 453: 279–296. 19. Craig MP, Ragen TJ (1999) Body size, survival, and decline of juvenile
Hawaiian monk seals,Monachus schauinslandi. Marine Mammal Science 15: 786– 809.
20. Irvine LG, Hindell MA, van den Hoff J, Burton HR (2000) The influence of body size on dive duration of underyearling southern elephant seals (Mirounga leonina). Journal of Zoology 251: 463–471.
21. Jenkins KJ, Barten NL (2005) Demography and decline of the Mentasta caribou herd in Alaska. Canadian Journal of Zoology 83: 1174–1188.
22. Finkelstein ME, Doak DF, Nakagawa M, Sievert PR, Klavitter J (2010) Assessment of demographic risk factors and management priorities: impacts on juveniles substantially affect population viability of a long-lived seabird. Animal Conservation 13: 148–156.
23. Raum-Suryan KL, Rehberg MJ, Pendleton GW, Pitcher KW, Gelatt TS (2004) Development of dispersal, movement patterns and haul-out use by pup and juvenile Steller sea lions (Eumetopias jubatus) in Alaska. Marine Mammal Science 20: 823–850.
24. Gales NJ, Fletcher DJ (1999) Abundance, distribution and status of the New Zealand sea lion,Phocarctos hookeri. Wildlife Research 26: 35–52.
25. IUCN (2011) IUCN Red List of Threatened Species. Version 2011.1. 26. Baker CS, Chilvers BL, Constantine R, DuFresne S, Mattlin RH, et al. (2010)
Conservation status of New Zealand marine mammals (suborders Cetacea and Pinnipedia), 2009. New Zealand Journal of Marine and Freshwater Research 44: 101–115.
27. Childerhouse S, Gales N (1998) Historical and modern distribution and abundance of the New Zealand sea lionPhocarctos hookeri. New Zealand Journal of Zoology 25: 1–16.
28. Robertson BC, Chilvers BL (2011) The population decline of the New Zealand sea lionPhocarctos hookeri: a review of possible causes. Mammal Review 41: 253– 275.
29. McConkey SD, McConnell H, Lalas C, Heinrich S, Ludmerer A, et al. (2002) A northward spread in the breeding distribution of the New Zealand sea lion
Phocarctos hookeri. Australian mammalogy 24: 97–106.
30. Chilvers BL, Wilkinson IS, Duignan PJ, Gemmell NJ (2006) Diving to extremes: are New Zealand sea lions (Phocarctos hookeri) pushing their limits in a marginal habitat? Journal of Zoology 269: 233–240.
31. Gales NJ, Mattlin RH (1997) Summer diving behaviour of lactating New Zealand sea lions,Phocarctos hookeri. Canadian Journal of Zoology 75: 1695–1706. 32. Chilvers BL, Wilkinson IS, Duignan PJ, Gemmell NJ (2005) Summer foraging areas for lactating New Zealand sea lions Phocarctos hookeri. Marine Ecology Progress Series 304: 235–247.
33. Auge´ AA, Chilvers BL, Davis LS, Moore AB (2011) In the shallow end: diving behaviour of recolonising female New Zealand sea lions (Phocarctos hookeri) around the Otago Peninsula. Canadian Journal of Zoology 89: 1195–1205. 34. Auge´ AA, Chilvers BL, Moore AB, Davis LS (2011) Foraging behaviour
indicates marginal marine habitat for New Zealand sea lions: remnant versus recolonising populations. Marine Ecology Progress Series 432: 247–256. 35. Auge´ AA, Lalas C, Davis LS, Chilvers BL (2012) Autumn diet of recolonising
female New Zealand sea lions based at Otago Peninsula, South Island, New Zealand. New Zealand Journal of Marine and Freshwater Research 46: 97–110. 36. Riet-Sapriza FG, Duignan PJ, Chilvers BL, Wilkinson IS, Lopez-Villalobos N, et al. (2012) Interannual and individual variation in milk composition of New Zealand sea lions (Phocarctos hookeri). Journal of Mammology 93: 1006–1016. 37. Auge´ AA (2011) Foraging ecology of recolonising female New Zealand sea lions
around the Otago Peninsula, New Zealand [PhD]. Dunedin, New Zealand: University of Otago. 275 p.
38. Meynier L, Mackenzie DDS, Duignan PJ, Chilvers BL, Morel PCH (2009) Variability in the diet of New Zealand sea lion (Phocarctos hookeri) at the Auckland Islands, New Zealand. Marine Mammal Science 25: 302–326.
39. Meynier L, Morel PCH, Chilvers BL, Mackenzie DDS, MacGibbon A, et al. (2008) Temporal and sex differences in the blubber fatty acid profiles of the New Zealand sea lionPhocarctos hookeri. Marine Ecology Progress Series 366: 271–279. 40. Pickston L, Czochanska Z, Smith JM (1982) The nutritional composition of some New Zealand marine fish. New Zealand Journal of Science 25: 19–26. 41. Vlieg P (1986) Proximate analysis of commercial New Zealand fish species New
Zealand Journal of Technology 9: 245–249.
42. Bradford-Grieve JM, Probert PK, Nodder SD, Thompson D, Hall J, et al. (2003) Pilot trophic model for subantarctic water over the Southern Plateau, New Zealand: a low biomass, high transfer efficiency system. Journal of Experimental Marine Biology and Ecology 289: 223–262.
[image:9.612.311.555.246.739.2]44. Winship AJ, Trites AW, Rosen DAS (2002) A bioenergetic model for estimating the food requirements of Steller sea lionsEumetopias jubatusin Alaska, USA. Marine Ecology Progress Series 229: 291–312.
45. Gales NJ, Mattlin RH (1998) Fast, safe, field-portable gas anesthesia for pinnipeds. Marine Mammal Science 14: 355–361.
46. Vincent C, McConnell BJ, Ridoux V, Fedak MA (2002) Assessment of Argos location accuracy from satellite tags deployed on captive gray seals. Marine Mammal Science 18: 156–166.
47. Jonsen ID, Myers RA, James MC (2006) Robust hierarchical state-space models reveal diel variation in travel rates of migrating leatherback turtles. Journal of Animal Ecology 75: 1046–1057.
48. Leung ES, Chilvers BL, Nakagawa S, Moore A, Robertson BC (2012) Sexual segregation in juvenile New Zealand sea lion foraging ranges: implications for intraspecific competition, population dynamics and conservation. PLoS ONE 7: e45389.
49. Spiegelhalter DJ, Thomas A, Best NG, Lunn D (2004) WinBUGS User Manual, version 2.0. Cambridge: Insitute of Public Health.
50. R Development Core Team (2010) R: A language and environment for statistical computing. Vienna, Austria: R Foundation for Statistical Computing. 51. Freitas C, Lydersen C, Fedak MA, Kovacs KM (2008) A simple new algorithm to filter marine mammal Argos locations. Marine Mammal Science 24: 315– 325.
52. Chilvers BL (2008) Foraging site fidelity of lactating New Zealand sea lions. Journal of Zoology 276: 28–36.
53. ESRI (2009) ArcGIS Desktop 9.3.1. Redlands, CA: ESRI,.
54. Rodgers AR, Carr AP, Beyer HL, Smith L, Kie JG (2007) HRT: Home Range Tools for ArcGIS. Version 1.1. Thunder Bay, Ontario, Canada: Ontario Ministry of Natural Resources, Centre for Northern Forest Ecosystem Research. 55. Worton BJ (1989) Kernel methods for estimating the utilization distribution in
home-range studies. Ecology 70: 164–168.
56. Luque SP (2007) Diving behavior analysis in R. R News 7: 8–14.
57. Guinet C, Roux JP, Bonnet M, Mison V (1998) Effect of body size, body mass, and body condition on reproduction of female South African fur seals (Arctocephalus pusillus) in Namibia. Canadian Journal of Zoology 76: 1418–1424. 58. Pinheiro J, Bates D, DebRoy S, Sarkar D, R Development Core Team (2010) nlme: Linear and Nonlinear Mixed Effects Models. R package, version 3.1–97. 59. Schielzeth H (2010) Simple means to improve the interpretability of regression
coefficients. Methods in Ecology and Evolution 1: 103–113.
60. Burnham KP, Anderson DR (2002) Model selection and multimodel inference: a practical information-theoretic approach. New York: Springer.
61. Barton´ K (2010) MuMIn: multi-model inference. R package, version 0.13.17. 62. Nakagawa S, Freckleton RP (2011) Model averaging, missing data and multiple
imputation: a case study for behavioural ecology. Behavioral Ecology and Sociobiology 65: 103–116.
63. Pinheiro JC, Bates DM (2000) Mixed-effects models in S and S-PLUS. New York: Springer.
64. Feldman GC, McClain CR (2006) Ocean Color Web, MODIS-Aqua, Reprocessing 1.1, NASA Goddard Space Flight Center.
65. Costa DP, Croxall JP, Duck CD (1989) Foraging energetics of Antarctic fur seals in relation to changes in prey availability. Ecology 70: 596–606.
66. McCafferty DJ, Boyd IL, Walker TR, Taylor RI (1998) Foraging responses of Antarctic fur seals to changes in the marine environment. Marine Ecology Progress Series 166: 285–299.
67. Monaghan P, Walton P, Wanless S, Uttley JD, Burns MD (1994) Effects of prey abundance on the foraging behaviour, diving effciency and time allocation of breeding guillemotsUria aalge. Ibis 136: 214–222.
68. Orians GH, Pearson NE (1979) On the theory of central place foraging. In: Horn DJ, Mitchell RD, Stairs GR, editors. Analysis of ecological systems. Columbus: Ohio State University Press. 154–177.
69. Childerhouse SJ, Dawson SM, Fletcher DJ, Slooten E, Chilvers BL (2010) Growth and reproduction of female New Zealand sea lions. Journal of Mammalogy 91: 165–176.
70. Halsey LG, Blackburn TM, Butler PJ (2006) A comparative analysis of the diving behaviour of birds and mammals. Functional Ecology 20: 889–899. 71. Geschke K, Chilvers BL (2009) Managing big boys: a case study on remote
anaesthesia and satellite tracking of adult male New Zealand sea lions (Phocarctos hookeri). Journal of Wildlife Research 36: 666–674.
72. Lalas C (2008) Recolonisation of Otago, southern New Zealand, by fur seals and sea lions: unexpected patterns and consequences. In: Clarkson B, Kurian P, Nachowitz T, Rennie H, editors. 2–4 July 2007; University of Waikato, Hamilton.
73. Harcourt RG, Bradshaw CJA, Dickson K, Davis LS (2002) Foraging ecology of a generalist predator, the female New Zealand fur seal. Marine Ecology Progress Series 227: 11–24.
74. Paul LJ (2000) New Zealand Fishes: Identification, natural history and fisheries. Auckland, New Zealand: Reed Books.
75. Ayling T, Cox GJ (1982) Collins guide to the sea fishes of New Zealand. Auckland, New Zealand: William Collins Publishers Ltd.
76. Lindstro¨m J (1999) Early development and fitness in birds and mammals. Trends in Ecology & Evolution 14: 343–348.
77. Meynier L, Morel PCH, Chilvers BL, Mackenzie DDS, Duignan PJ (2010) Quantitative fatty acid signature analysis on New Zealand sea lions: model sensitivity and diet estimates. Journal of Mammalogy 91: 1484–1495. 78. Alonzo SH, Switzer PV, Mangel M (2003) An ecosystem-based approach to
management: using individual behaviour to predict the indirect effects of Antarctic krill fisheries on penguin foraging. Journal of Applied Ecology 40: 692–702.
79. Andersen SM, Teilmann J, Harders PB, Hansen EH, Hjollund D (2007) Diet of harbour seals and great cormorants in Limfjord, Denmark: interspecific competition and interaction with fishery. ICES Journal of Marine Science 64: 1235–1245.
80. Trites AW, Donnelly CP (2003) The decline of Steller sea lionsEumetopias jubatus
in Alaska: a review of the nutritional stress hypothesis. Mammal Review 33: 3– 28.
81. Chilvers BL (2008) New Zealand sea lionsPhocarctos hookeriand squid trawl fisheries: bycatch problems and management options. Endangered Species Research 5: 193–204.
82. Chilvers BL, Mackenzie D (2010) Age and sex specific survival estimates incorporating tag loss for New Zealand sea lions,Phocarctos hookeri. Journal of Mammalogy 91: 758–767.