National Curriculum teacher assessments of
non-core subjects: Wales 2015
This Statistical First Release provides information on the National Curriculum teacher assessments of the non-core subjects in 2015, at Wales and local authority (LA) level. It includes non-core data for Welsh Second Language at Key Stage 2 (in Section 2).
Please see section 1.1 of the notes to this release for information on recalibration of teacher assessments in Torfaen LA, which has led to some of the 2015 results for Torfaen LA falling from the previous year. Also see this section of the notes for information on the external verification programme for teacher assessment, which may have an effect on the next year of results in 2016.
Key points for 2015
Key Stage 3 - at all Wales level:
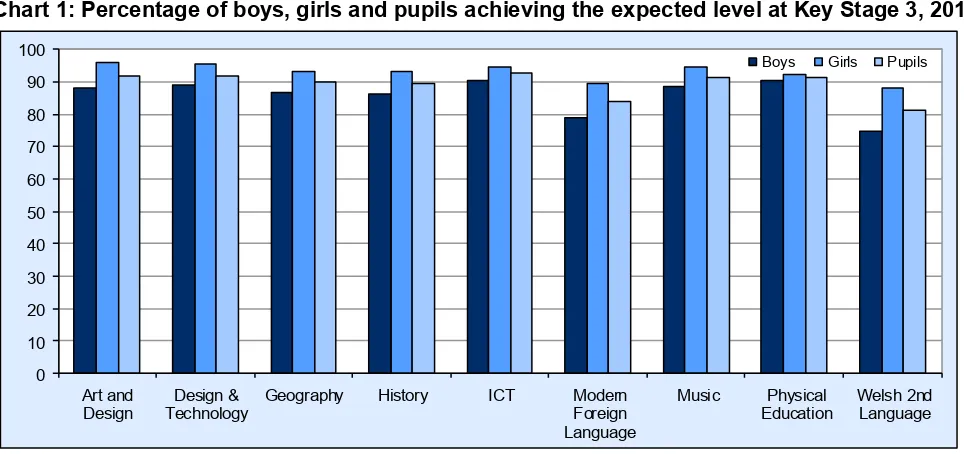
In 2015 the percentage of pupils achieving the expected level (level 5 or above)varied from 92.7 per cent in Information and Communication Technology (ICT) to 81.2 per cent in Welsh Second
Language (Chart 1, Table 1).
In each subject, a higher percentage of girls than boys achieved the expected level. The gap between girls and boys was greatest in Welsh Second Language (13.1 percentage points) (Chart 1, Table 1).
Since 2014 there has been an increase in the percentage of pupils achieving the expected level in every subject. The greatest increase was in Welsh Second Language (3.4 percentage points) (Chart 2, Table 1).
On average, the percentage of pupils achieving the expected level in non-core subjects in 2015 was 1.8 percentage points higher than 2014, lower than the average increase that was observed between both 2013 and 2014 (3.1 percentage points), 2012 and 2013 (3.6 percentage points), and 2011 and 2012 (3.5 percentage points).
Key Stage 3 - at LA level:
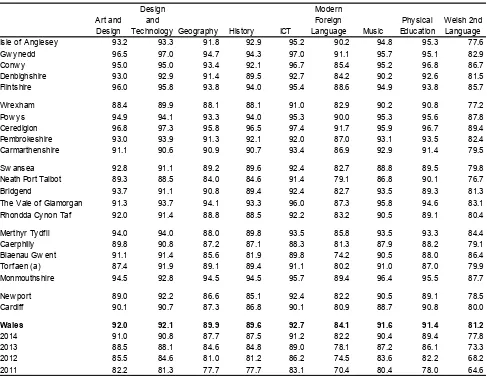
The percentage of pupils achieving the expected level varied considerably between LAs across all subjects. Modern Foreign Language had the greatest range of results, 91.7 per cent in Ceredigion compared with 74.2 per cent in Blaenau Gwent (Table 3).
Key Stage 2 - at all Wales level:
In 2015, the percentage of pupils achieving the expected level (level 4 or above) in Welsh Second Language was 76.1 per cent (Table 4).
SDR 128/2015 18 August 2015
Contents
Key points for 2015 ... 1
Section 1 – Key Stage 3 ... 2
Section 2 – Key Stage 2 ... 6
Notes ... 8
1. Context ... 8
2. Data source ... 9
3. Definitions ... 9
4. Rounding and symbols ... 10
5. Key Quality Information ... 10
6. Feedback ... 11
[image:2.595.52.534.539.766.2]List of tables
Table 1: Key Stage 3 non-core teacher assessment results, 2011-2015 ... 3Table 2: Key Stage 3 non-core teacher assessment results, by level, 2015 ... 4
Table 3: Key Stage 3 non-core teacher assessment results by LA, 2015 ... 5
Table 4: Key Stage 2 non-core teacher assessment results, 2015 ... 6
Table 5: Key Stage 2 non-core teacher assessment results by LA, 2011 - 2015 ... 7
List of charts
Chart 1: Percentage of boys, girls and pupils achieving the expected level at Key Stage 3, 2015 ... 2Chart 2: Percentage of pupils achieving the expected level at Key Stage 3, 2011-2015 ... 3
Section 1 – Key Stage 3
Chart 1: Percentage of boys, girls and pupils achieving the expected level at Key Stage 3, 2015
0 10 20 30 40 50 60 70 80 90 100
Art and
Design TechnologyDesign & Geography History ICT ModernForeign Language
Music Physical
Education Welsh 2ndLanguage
Chart 2: Percentage of pupils achieving the expected level at Key Stage 3, 2011-2015
0 10 20 30 40 50 60 70 80 90 100
Art and
Design TechnologyDesign & Geography History ICT ModernForeign Language
Music Physical
Education Welsh 2ndLanguage
[image:3.595.45.505.418.658.2]'11 '12 '13 '14 '15
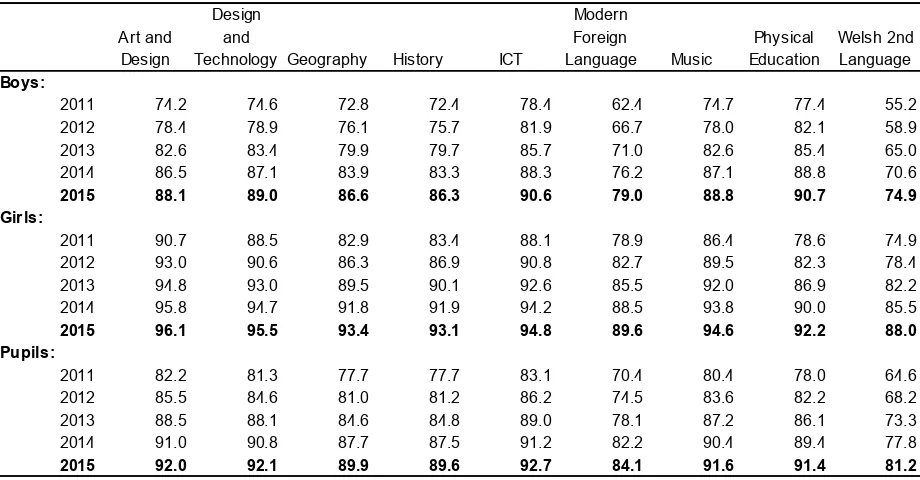
Table 1: Key Stage 3 non-core teacher assessment results, 2011-2015
Percentage of pupils achieving at least level 5 (the expected level) in teacher assessments
Design Modern
Art and and Foreign Physical Welsh 2nd
Design Technology Geography History ICT Language Music Education Language
Boys:
2011 74.2 74.6 72.8 72.4 78.4 62.4 74.7 77.4 55.2
2012 78.4 78.9 76.1 75.7 81.9 66.7 78.0 82.1 58.9
2013 82.6 83.4 79.9 79.7 85.7 71.0 82.6 85.4 65.0
2014 86.5 87.1 83.9 83.3 88.3 76.2 87.1 88.8 70.6
2015 88.1 89.0 86.6 86.3 90.6 79.0 88.8 90.7 74.9
Girls:
2011 90.7 88.5 82.9 83.4 88.1 78.9 86.4 78.6 74.9
2012 93.0 90.6 86.3 86.9 90.8 82.7 89.5 82.3 78.4
2013 94.8 93.0 89.5 90.1 92.6 85.5 92.0 86.9 82.2
2014 95.8 94.7 91.8 91.9 94.2 88.5 93.8 90.0 85.5
2015 96.1 95.5 93.4 93.1 94.8 89.6 94.6 92.2 88.0
Pupils:
2011 82.2 81.3 77.7 77.7 83.1 70.4 80.4 78.0 64.6
2012 85.5 84.6 81.0 81.2 86.2 74.5 83.6 82.2 68.2
2013 88.5 88.1 84.6 84.8 89.0 78.1 87.2 86.1 73.3
2014 91.0 90.8 87.7 87.5 91.2 82.2 90.4 89.4 77.8
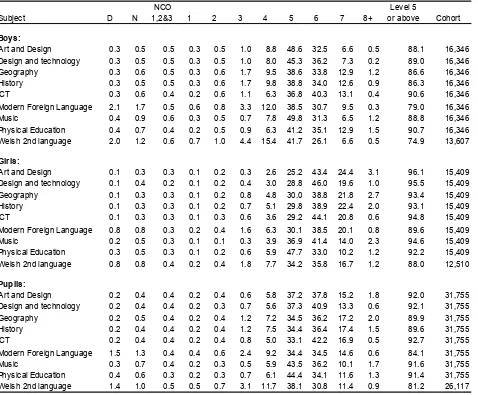
Table 2: Key Stage 3 non-core teacher assessment results, by level, 2015 (a) Percentage of boys, girls and pupils attaining each level
NCO Level 5
Subject D N 1,2&3 1 2 3 4 5 6 7 8+ or above Cohort
Boys:
Art and Design 0.3 0.5 0.5 0.3 0.5 1.0 8.8 48.6 32.5 6.6 0.5 88.1 16,346 Design and technology 0.3 0.5 0.5 0.3 0.5 1.0 8.0 45.3 36.2 7.3 0.2 89.0 16,346 Geography 0.3 0.6 0.5 0.3 0.6 1.7 9.5 38.6 33.8 12.9 1.2 86.6 16,346 History 0.3 0.5 0.5 0.3 0.6 1.7 9.8 38.8 34.0 12.6 0.9 86.3 16,346 ICT 0.3 0.6 0.4 0.2 0.6 1.1 6.3 36.8 40.3 13.1 0.4 90.6 16,346 Modern Foreign Language 2.1 1.7 0.5 0.6 0.8 3.3 12.0 38.5 30.7 9.5 0.3 79.0 16,346 Music 0.4 0.9 0.6 0.3 0.5 0.7 7.8 49.8 31.3 6.5 1.2 88.8 16,346 Physical Education 0.4 0.7 0.4 0.2 0.5 0.9 6.3 41.2 35.1 12.9 1.5 90.7 16,346 Welsh 2nd language 2.0 1.2 0.6 0.7 1.0 4.4 15.4 41.7 26.1 6.6 0.5 74.9 13,607
Girls:
Art and Design 0.1 0.3 0.3 0.1 0.2 0.3 2.6 25.2 43.4 24.4 3.1 96.1 15,409 Design and technology 0.1 0.4 0.2 0.1 0.2 0.4 3.0 28.8 46.0 19.6 1.0 95.5 15,409 Geography 0.1 0.3 0.3 0.1 0.2 0.8 4.8 30.0 38.8 21.8 2.7 93.4 15,409 History 0.1 0.3 0.3 0.1 0.2 0.7 5.1 29.8 38.9 22.4 2.0 93.1 15,409 ICT 0.1 0.3 0.3 0.1 0.3 0.6 3.6 29.2 44.1 20.8 0.6 94.8 15,409 Modern Foreign Language 0.8 0.8 0.3 0.2 0.4 1.6 6.3 30.1 38.5 20.1 0.8 89.6 15,409 Music 0.2 0.5 0.3 0.1 0.1 0.3 3.9 36.9 41.4 14.0 2.3 94.6 15,409 Physical Education 0.3 0.5 0.3 0.1 0.2 0.6 5.9 47.7 33.0 10.2 1.2 92.2 15,409 Welsh 2nd language 0.8 0.8 0.4 0.2 0.4 1.8 7.7 34.2 35.8 16.7 1.2 88.0 12,510
Pupils:
Art and Design 0.2 0.4 0.4 0.2 0.4 0.6 5.8 37.2 37.8 15.2 1.8 92.0 31,755 Design and technology 0.2 0.4 0.4 0.2 0.3 0.7 5.6 37.3 40.9 13.3 0.6 92.1 31,755 Geography 0.2 0.5 0.4 0.2 0.4 1.2 7.2 34.5 36.2 17.2 2.0 89.9 31,755 History 0.2 0.4 0.4 0.2 0.4 1.2 7.5 34.4 36.4 17.4 1.5 89.6 31,755 ICT 0.2 0.4 0.4 0.2 0.4 0.8 5.0 33.1 42.2 16.9 0.5 92.7 31,755 Modern Foreign Language 1.5 1.3 0.4 0.4 0.6 2.4 9.2 34.4 34.5 14.6 0.6 84.1 31,755 Music 0.3 0.7 0.4 0.2 0.3 0.5 5.9 43.5 36.2 10.1 1.7 91.6 31,755 Physical Education 0.4 0.6 0.3 0.2 0.3 0.7 6.1 44.4 34.1 11.6 1.3 91.4 31,755 Welsh 2nd language 1.4 1.0 0.5 0.5 0.7 3.1 11.7 38.1 30.8 11.4 0.9 81.2 26,117
(a) D represents pupils who have been disapplied under sections 113 - 116 of the 2002 Education Act, or pupils for whom teachers were unable to provide an assessment.
N represents pupils not awarded a level for reasons other than disapplication.
Table 3: Key Stage 3 non-core teacher assessment results by LA, 2015 Percentage of pupils achieving at least level 5 (the expected level) in teacher assessments
Design Modern
Art and and Foreign Physical Welsh 2nd
Design Technology Geography History ICT Language Music Education Language Isle of Anglesey 93.2 93.3 91.8 92.9 95.2 90.2 94.8 95.3 77.6
Gw ynedd 96.5 97.0 94.7 94.3 97.0 91.1 95.7 95.1 82.9
Conw y 95.0 95.0 93.4 92.1 96.7 85.4 95.2 96.8 86.7
Denbighshire 93.0 92.9 91.4 89.5 92.7 84.2 90.2 92.6 81.5
Flintshire 96.0 95.8 93.8 94.0 95.4 88.6 94.9 93.8 85.7
Wrexham 88.4 89.9 88.1 88.1 91.0 82.9 90.2 90.8 77.2
Pow ys 94.9 94.1 93.3 94.0 95.3 90.0 95.3 95.6 87.8
Ceredigion 96.8 97.3 95.8 96.5 97.4 91.7 95.9 96.7 89.4
Pembrokeshire 93.0 93.9 91.3 92.1 92.0 87.0 93.1 93.5 82.4
Carmarthenshire 91.1 90.6 90.9 90.7 93.4 86.9 92.9 91.4 79.5
Sw ansea 92.8 91.1 89.2 89.6 92.4 82.7 88.8 89.5 79.8
Neath Port Talbot 89.3 88.5 84.0 84.6 91.4 79.1 86.8 90.1 76.7
Bridgend 93.7 91.1 90.8 89.4 92.4 82.7 93.5 89.3 81.3
The Vale of Glamorgan 91.3 93.7 94.1 93.3 96.0 87.3 95.8 94.6 83.1 Rhondda Cynon Taf 92.0 91.4 88.8 88.5 92.2 83.2 90.5 89.1 80.4
Merthyr Tydfil 94.0 94.0 88.0 89.8 93.5 85.8 93.5 93.3 84.4
Caerphilly 89.8 90.8 87.2 87.1 88.3 81.3 87.9 88.2 79.1
Blaenau Gw ent 91.1 91.4 85.6 81.9 89.8 74.2 90.5 88.0 86.4
Torfaen (a) 87.4 91.9 89.1 89.4 91.1 80.2 91.0 87.0 79.9
Monmouthshire 94.5 92.8 94.5 94.5 95.7 89.4 96.4 95.5 87.7
New port 89.0 92.2 86.6 85.1 92.4 82.2 90.5 89.1 78.5
Cardiff 90.1 90.7 87.3 86.8 90.1 80.9 88.7 90.8 80.0
Wales 92.0 92.1 89.9 89.6 92.7 84.1 91.6 91.4 81.2
2014 91.0 90.8 87.7 87.5 91.2 82.2 90.4 89.4 77.8
2013 88.5 88.1 84.6 84.8 89.0 78.1 87.2 86.1 73.3
2012 85.5 84.6 81.0 81.2 86.2 74.5 83.6 82.2 68.2
2011 82.2 81.3 77.7 77.7 83.1 70.4 80.4 78.0 64.6
Section 2 – Key Stage 2
It is optional for schools to provide details of teacher assessments in Welsh Second Language to the Welsh Government. In 2015, 24,878 pupils from an eligible cohort of 25,767 (96.5 per cent) were assessed in Welsh Second Language, compared to 23,999 pupils from an eligible cohort of 25,393 (94.5 per cent) in 2014. The eligible cohort consists of those who did not have a teacher assessment in Welsh first language.
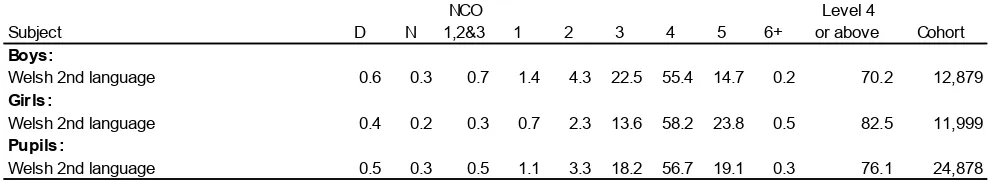
[image:6.595.41.536.257.348.2] In 2015, the percentage of pupils achieving the expected level (level 4 or above) in Welsh Second Language was 76.1 per cent.
Table 4: Key Stage 2 non-core teacher assessment results, 2015 (a) Percentage of pupils boys, girls and pupils attaining each level
NCO Level 4
Subject D N 1,2&3 1 2 3 4 5 6+ or above Cohort
Boys:
Welsh 2nd language 0.6 0.3 0.7 1.4 4.3 22.5 55.4 14.7 0.2 70.2 12,879
Girls:
Welsh 2nd language 0.4 0.2 0.3 0.7 2.3 13.6 58.2 23.8 0.5 82.5 11,999
Pupils:
Welsh 2nd language 0.5 0.3 0.5 1.1 3.3 18.2 56.7 19.1 0.3 76.1 24,878
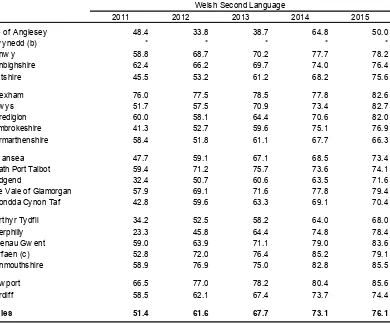
Table 5: Key Stage 2 non-core teacher assessment results by LA, 2011 - 2015 (a) Percentage of pupils achieving at least level 4 (the expected level) in teacher assessments
2011 2012 2013 2014 2015
Isle of Anglesey 48.4 33.8 38.7 64.8 50.0
Gw ynedd (b) * * * * *
Conw y 58.8 68.7 70.2 77.7 78.2
Denbighshire 62.4 66.2 69.7 74.0 76.4
Flintshire 45.5 53.2 61.2 68.2 75.6
Wrexham 76.0 77.5 78.5 77.8 82.6
Pow ys 51.7 57.5 70.9 73.4 82.7
Ceredigion 60.0 58.1 64.4 70.6 82.0
Pembrokeshire 41.3 52.7 59.6 75.1 76.9
Carmarthenshire 58.4 51.8 61.1 67.7 66.3
Sw ansea 47.7 59.1 67.1 68.5 73.4
Neath Port Talbot 59.4 71.2 75.7 73.6 74.1
Bridgend 32.4 50.7 60.6 63.5 71.6
The Vale of Glamorgan 57.9 69.1 71.6 77.8 79.4
Rhondda Cynon Taf 42.8 59.6 63.3 69.1 70.4
Merthyr Tydfil 34.2 52.5 58.2 64.0 68.0
Caerphilly 23.3 45.8 64.4 74.8 78.4
Blaenau Gw ent 59.0 63.9 71.1 79.0 83.6
Torfaen (c) 52.8 72.0 76.4 85.2 79.1
Monmouthshire 58.9 76.9 75.0 82.8 85.5
New port 66.5 77.0 78.2 80.4 85.6
Cardiff 58.5 62.1 67.4 73.7 74.4
Wales 51.4 61.6 67.7 73.1 76.1
Welsh Second Language
(a) Welsh Second Language data at Key Stage 2 was collected for the first time in 2010. The reporting of these results is optional for schools. For further information please see the notes at the end of this release.
(b) Most pupils in Gwynedd study Welsh as their first language and therefore the cohort size is very small.
Notes
1. Context
1.1 Policy/Operational
All learners in their final year of Key Stages 2 and 3 must be assessed through teacher assessments. Headteachers are responsible for reporting results for all learners on their school roll as at the second Tuesday in May; this is known as the ‘specified date on roll’. In 2015, the date for this was 12 May. Statutory assessment arrangements for the school year 2014/15 can be found at
http://learning.gov.wales/resources/browse-all/statutory-assessment-arrangements-for-end-of-foundation-phase-key-stage-2-and-3/?lang=en.
The National Curriculum subjects in Wales are split into two categories, core subjects and non-core subjects. The core subjects are:
English
Welsh first language
Mathematics
science
The non-core subjects are:
art and design
design and technology
geography
history
information and communication technology
modern foreign languages
music
physical education
Welsh second language
External verification programme for teacher assessment
On 18 May 2015, the Minister for Education and Skills gave a statement on “Securing reliability and consistency of Teacher Assessment in Wales: External Verification Programme”. From 2016, there is the possibility that improved rigour in teacher assessment will lead to an impact on the distribution of National Curriculum Levels awarded.
http://gov.wales/about/cabinet/cabinetstatements/2015/teacherassessment/?lang=en.
Recalibration of teacher assessment results in Torfaen LA
Throughout the 2014/15 academic year, Torfaen LA has been working to implement a new policy to monitor and evaluate teacher assessment across Torfaen. The LA has been working closely with headteachers of Torfaen schools, South East Wales Consortia, the Welsh Government, Estyn, and the Ministerial Recovery Board for Torfaen LA (put in place when Torfaen LA was placed in special measures by Estyn). This process has led to a fall in some of the 2015 results for Torfaen LA in this release, compared with the previous year.
Successful Futures: Independent review of curriculum and assessment arrangements in Wales
In March 2014 Professor Graham Donaldson was asked to conduct a fundamental review of curriculum and assessment arrangements from Foundation Phase to Key Stage 4. In the report published in
February 2015, Professor Donaldson made 68 wide-ranging recommendations to improve the curriculum and assessment arrangements in Wales. This independent review will have a significant impact on assessment arrangements and the publication of official statistics.
1.2 Related Publications
A similar release relating to mandatory areas of learning at end of Foundation Phase and core subjects at Key Stage 2 and 3, entitled “End of Foundation Phase Outcomes and National Curriculum Teacher Assessment of Core Subjects at Key Stages 2 and 3” was also released on 18 August 2015 and can be found at http://gov.wales/statistics-and-research/?topic=Education+and+skills&lang=en.
For school-level data and further information please visit My Local School (mylocalschool.wales.gov.uk
/ fyysgolleol.cymru.wales.gov.uk). The site contains a wealth of data from contextual information, such as data on pupil numbers and characteristics, to school performance, attendance and data on staffing and finance.
England publish separate releases on Key Stage 1 and 2, although no longer publish releases for key stage 3. Within the England release, figures are published on teacher assessments, as well as official exams (no longer sat in Wales). The latest available published statistics can be found at
http://www.education.gov.uk/researchandstatistics/statistics.
More detailed tables, including school-level data, are available on request.
2. Data source
The National Data Collection (NDC) is the electronic collection of teacher assessment data at end of Foundation Phase and Key Stages 2 and 3. Data is sent by schools to Knowledge and Analytical Services within the Welsh Government care of their Local Authority (LA).
A summary of the NDC process for 2015 covering timescales and reporting arrangements can be found at
http://gov.wales/topics/educationandskills/schoolshome/schooldata/ims/datacollections/nationald atacollection/?lang=en.
3. Definitions
3.1 Coverage
Most learners will be 11 or 14 years old at the end of Key Stage 2 and 3 respectively. It is possible that some may be older or younger and some may be taught in a class where the majority of learners are of a different age. For each Key Stage, learners must be statutorily assessed (i.e. they must receive an end of Key Stage teacher assessment) once only.
From 2010 schools were able to provide Key Stage 2 results for Welsh Second Language.
3.2 Expected levels
The general expectation is that the majority of 11 year olds will attain level 4 in each subject. Similarly, 14 year olds will attain level 5.
‘D’ represents pupils who have been disapplied under sections 113-116 of the 2002 Education Act, or pupils for whom teachers were unable to provide an assessment. ‘N’ represents pupils not awarded a level for reasons other than disapplication.
In 2010, level ‘W’ (working towards level 1) was removed and replaced by three new valid outcomes for Key Stage 2 and Key Stage 3 – National Curriculum Outcomes (NCO) 1, 2 and 3. These new levels have been introduced to describe achievement below level 1. For publishing purposes, these three outcomes have been grouped together and named ‘NCO 1, 2 and 3’.
4. Rounding and symbols
In tables where figures have been rounded to the nearest final digit, there may be an apparent discrepancy between the sum of the constituent items and the total shown.
The following symbols have been used throughout the publication:
- percentages less than 0.5 but not zero . not applicable
.. not available ~ not yet available
* figure is less than 5, or based on a figure less than 5.
5. Key Quality Information
This section provides a summary of information on this output against five dimensions of quality: Relevance, Accuracy, Timeliness and Punctuality, Accessibility and Clarity, and Comparability. It also covers specific issues relating to quality of 2015 data, and describes the quality management tool applied to this area of work.
5.1 Relevance
The statistics are used both within and outside the Welsh Government to monitor educational trends and as a baseline for further analysis of the underlying data. Some of the key users are:
Ministers and the Members Research Service in the National Assembly for Wales;
The Department for Education and Skills in the Welsh Government;
Other government departments;
The research community;
LAs and schools;
Students, academics and universities;
Individual citizens, private companies and the media.
These statistics are used in a variety of ways. Some examples of these are:
General background and research;
Inclusions in reports and briefings;
Advice to Ministers;
The all-Wales education core data packs (the replacement for the National Pupil Database);
LA and school comparisons and benchmarks;
To inform the education policy decision-making process in Wales including school reorganisation;
To inform ESTYN during school inspections;
The education domain of the Welsh Index of Multiple Deprivation;
To assist in research in educational attainment.
5.2 Accuracy
5.3 Timeliness and Punctuality
DEWi was available for uploading files on 12 May 2015, with schools asked to submit data for every pupil on roll at the school on 12 May for the relevant Foundation Phase/Key Stages and National Reading Tests. Schools and LAs were then asked to validate their data within the validation period, which closed on 3 July 2015.
Improvements in the data collection method and procedures and considerable effort by colleagues in local authorities and schools have resulted in us being able to tighten the National Data Collection timetable since 2008. In previous years we would have published a provisional set of results in September, followed by a final set in October once the data had been validated by schools.
5.4 Accessibilty and Clarity
This Statistical First Release is pre-announced and then published on the Statistics section of the Welsh Government website. It is accompanied by more detailed tables on StatsWales, a free to use service that allows visitors to view, manipulate, create and download data.
5.5 Comparability
No independent schools submitted Key Stage 2 or 3 data in 2015. One independent school submitted Key Stage 2 data in 2012 – the same independent school also provided results in 2009 and 2010. An independent school’s data will not be included in an LA’s results, but will appear in the overall results for Wales.
Attainment data for pupils arriving from non-English or Welsh based educational systems within the previous two academic years are removed from the school and LA’s results, but included in the overall results for Wales.
6. Feedback
We welcome feedback from users of our publications on content and presentation. If you have any feedback or require further information, please contact:
Stephen Hughes School Statistics Welsh Government
Cathays Park, Cardiff, CF10 3NQ
Telephone: (029) 2082 5060
e-mail: school.stats@wales.gsi.gov.uk
All content is available under the Open Government Licence v3.0 , except where otherwise stated.