The purpose of this statistical release is to present final enrolment figures for schools and for children in funded pre-school education for 2014/15.
Key points:
There are 165,548 pupils in primary schools (years
1-7), and this has risen by approximately 11,000 pupils in the last four years.
In total 142,553 pupils are enrolled in post-primary
schools, showing a decline for the fourth year in a row. This decrease is witnessed in enrolments to non-grammar schools, but grammar school enrolments remain stable. Enrolments of pupils in sixth form, however, continue to rise.
There are almost 24,000 pupils in funded pre-school
education, the highest figure on record.
There has been an increase in the proportion of pupils
entitled to free school meals, particularly among post-primary school pupils (rising from 18.5% to 26.1%). 26 February 2015
Coverage: Northern Ireland
Frequency: Annual
Theme: Children, Education and Skills
Issued by:
Statistics & Research Team Department of Education Rathgael House
Balloo Road Rathgill
BANGOR BT19 7PR
Telephone Press Office: 028 9127 9207
Statistics & Research Team: 028 9127 9717
Statistician: Paul Matthews
Email: statistics@deni.gov.uk
Internet
http://www.deni.gov.uk/index/ facts-and-figures-new.htm
Statistical Bulletin 3/2015
2
Contents
Section Title Page
Introduction 3
1 Funded pre-school education 4
2 Primary school education 6
3
4
5
6
Post-primary school education
Special education
Free school meal entitlement
Changes in enrolment patterns
8
10
11
13
3
Introduction
Enrolment data from the 2014/15 annual school census was released in December 2014. The purpose of this statistical release is to present the final enrolment figures, and a more detailed analysis of this information.
The data are taken from the school census exercise, which ran in October 2014. Data collected through the school census exercise are used by the Department of Education (DE) to inform a wide range of policy areas, including finance allocations, school estate development and planning, special education, school improvement, area based
planning, extended schools, additional educational needs, early years and integrated and Irish medium education. Other users include the Education and Library Boards (ELBs), the Education and Training Inspectorate and to inform responses to Assembly questions and requests from academic researchers, journalists, lobby groups and the public.
Statistics relating to school numbers and enrolments can be found on the Facts and Figures section of the DE website1. Analysis is provided at Northern Ireland, Education
and Library Board and school level.
1
4
Section 1: Funded pre-school education
1.1. Number of institutions
• There are a total of 798 institutions in Northern Ireland providing funded pre-school education (Table 1a).
o Approximately half of these are voluntary and private pre-school centres (401), and this has increased from 358 in 2009/10.
o In the same time period, there has been a rise in the number of primary schools with funded nursery units (213 in 2009/10 to 232 in 2014/15), and a substantial decrease in the number of schools with reception classes (108 to 70 this year)2.
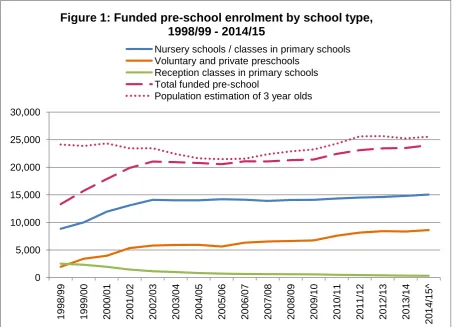
1.2. Enrolments
• There are almost 24,000 pupils in funded pre-school education (Table 2a), which equates to 91% of all three year olds in the Northern Ireland population3.
• Funded pre-school enrolments have steadily increased over the last decade, with approximately an additional 500 pupils in funded pre-school education compared to last year.
• Most pre-school pupils are enrolled in either nursery classes in primary schools (9,165) or voluntary and private schools (8,621). The increase in overall pre-school enrolments compared to last year can be accounted for by an increase in enrolments in both of these sectors (Figure 1).
2
Investing in Early Learning, published in 1997, set out the Department’s ‘intention to replace reception provision with suitable alternative provision so that all children below compulsory school age in school settings will be in planned pre-school provision which meets specified standards’ and proposed that’ no new reception provision in primary schools (ie provision in schools where a reception class or group does not exist in the 1998/99 school year) will be funded from September 1999’. This policy was implemented with the introduction of the Pre-School Education Expansion Programme in 1998.
3
This is calculated by dividing the number of pupils aged 3 according to the NI school census (23,281) by the number of children aged 2 in the 2013 mid-year estimates (25,545) (the most recent available at time of publication): http://www.nisra.gov.uk/archive/demography/population/midyear/NI_sya(1961_2013).xls
5
0 5,000 10,000 15,000 20,000 25,000 30,000
1998/99 1999/00 2000/01 2001/02 2002/03 2003/04 2004/05 2005/06 2006/07 2007/08 2008/09 2009/10 2010/11 2011/12 2012/13 2013/14 201
4
/1
5
[image:5.595.91.550.92.419.2]^
Figure 1: Funded pre-school enrolment by school type, 1998/99 - 2014/15
Nursery schools / classes in primary schools Voluntary and private preschools
Reception classes in primary schools Total funded pre-school
Population estimation of 3 year olds
6
Section 2: Primary school education
2.1. Number of schools
• There are 836 primary schools (including preparatory departments) in Northern Ireland. This has dropped by 30 schools in the last five years (table 1b).
2.2. Enrolments
• Enrolments of pupils in years 1 to 7 continues to rise. In October 2014 the total number of year 1-7 pupils was 165,548 (Table 2b), its highest level since
2002/03. Enrolments have increased sharply in recent years; by 11,000 pupils since 2010/11 and more than 3,300 compared to last year (Figure 2). The
increase observed is in line with the rise in the number of 4-10 year olds in NISRA’s mid-year estimates over the last three years4.
4
http://www.nisra.gov.uk/archive/demography/population/midyear/NI_sya(1961_2013).xls
100,000 110,000 120,000 130,000 140,000 150,000 160,000 170,000 180,000 190,000 200,000
1991/92 1992/93 1993/94 1994/95 1995/96 1996/97 1997/98 91
9
8
/9
9
1999/00 2000/01 2001/02 2002/03 2003/04 2004/05 2005/06 2006/07 2007/08 2008/09 2009/10 20
1
0
/1
1
[image:6.595.88.539.348.719.2]2011/12 2012/13 2013/14 2014/15^
Figure 2: Enrolments in primary schools in Northern Ireland 1991/92 - 2014/15
Year 1 - 7 Population estimation of 4-10 year olds
7 2.3. Class size
8
Section 3: Post-primary school education
3.1. Number of schools
• The number of post-primary schools in 2014/15 is 208 (Table 1b). One-third (68) of post-primary schools are grammars and the remaining two-thirds (140) are non-grammars. The total number of schools has fallen from 217 in 2010, accounted for by a drop in the number of non-grammar schools.
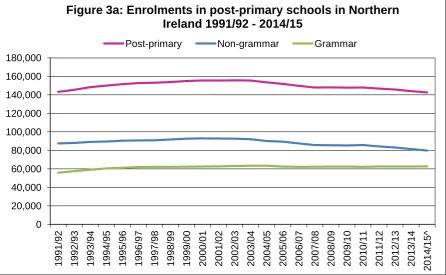
3.2. Enrolments
• Unlike primary schools, enrolments in post-primary schools continue to decline. The number of pupils in post-primary schools is 142,553 (Table 2b), and this has dropped by more than 5,000 pupils in the last four years (Figure 3a). Again this mirrors the decrease seen in NISRA’s population estimates in the same period.
• This trend only exists in secondary (non-grammar) schools; grammar school enrolments have remained stable in recent years (Figure 3a). Given the declining overall post-primary enrolment, a greater proportion of pupils is attending grammar schools than before (44.0% in 2014/15 compared to 41.1% in 2005/06).
0 20,000 40,000 60,000 80,000 100,000 120,000 140,000 160,000 180,000
[image:8.595.74.521.470.745.2]1991/92 1992/93 1993/94 1994/95 1995/96 1996/97 1997/98 1998/99 1999/00 2000/01 2001/02 2002/03 2003/04 2004/05 2005/06 2006/07 2007/08 2008/09 2009/10 2010/11 2011/12 2012/13 2013/14 2014/15^
Figure 3a: Enrolments in post-primary schools in Northern Ireland 1991/92 - 2014/15
9 3.3. Post year 12 pupils
• The overall decline in post primary pupils conceals a continual increase in the number of post year 12 pupils (Figure 3b). Enrolments have risen by almost 5,000 in the last ten years (26,330 in 2004/05 to 31,267 in 2014/15).
• The number of 16 and 17 year olds in the population has remained relatively stable in the same time period, therefore a greater proportion of the population are
staying on in school post year 12, increasing from 48.8% in 2004/05 to 63.4% in 2014/15.
0 20,000 40,000 60,000 80,000 100,000 120,000 140,000 160,000
1995/96 1996/97 1997/98 1998/99 1999/00 2000/01 2001/02 2002/03 2003/04 2004/05 2005/06 2006/07 2007/08 2008/09 20
0
9
/1
0
[image:9.595.74.523.270.604.2]2010/11 2011/12 2012/13 2013/14 2014/15^
Figure 3b: Enrolments in post-primary schools in Northern Ireland 1995/96 - 2014/15
Years 8-12 Population estimation of 11-15 year olds
Years 13-15 Population estimation of 16-17 year olds
10
Section 4: Special education
4.1. Special educational needs
In total, over 72,000 pupils in schools have some form of special educational needs, and this equates to 22.0% of the entire school population. Of this, almost 16,000, or 4.9%, have a statement of special educational needs (Table 7).
The number of pupils with special educational needs has been steadily rising, with an additional 1,700 pupils with any needs and more than 700 additional pupils with statements compared to last year.
4.2. Special school enrolments
• More than 5,000 pupils are enrolled in 39 dedicated special schools (Table 1b; Table 2b). A further 1,700 are educated in learning support centres in primary and post-primary schools across 87 schools.
• Pupils with special educational needs are increasingly being educated in mainstream schools rather than special schools. In 2005/06, 34.5% of
11
Section 5: Free school meal entitlement
5• The percentage of children in schools entitled to free school meals has risen from 25.8% last year to 29.7% this year (Tables 3a/b).
• The main reason for this increase is the sharp rise in post-primary pupils that are free school meal entitled, increasing from 18.5% to 26.1% (Figure 4). The
proportion of non-grammar pupils that are free school meal entitled has risen by ten percentage points to 37.1% this year. Entitlement increases by five percentage points from last year to 12.1% among grammar school pupils.
• This increase is likely to relate to the extension of the Working Tax Credit free school meal criterion to post-primary pupils in September 20146. By comparison, when entitlement was extended for primary school pupils in 2009/10 and
2010/11, the proportion of pupils entitled to free school meals increased from 19.2% (in 2009/10) to 27.0% (in 2011/12).
5
http://www.deni.gov.uk/index/support-and-development-2/5-schools_meals/school-milk-and-meals.htm
6 Eligibility under the Working Tax Credit free school meal criterion was introduced on a phased basis with
Nursery, Foundation Stage and Key Stage 1 pupils eligible from September 2010 and Key Stage 2 pupils eligible from September 2011. It was extended to post-primary pupils from September 2014.
0% 5% 10% 15% 20% 25% 30% 35%
1993/94 1994/95 1995/96 1996/97 1997/98 19
9
8
/9
9
[image:11.595.73.524.391.708.2]1999/00 2000/01 2001/02 2002/03 2003/04 2004/05 2005/06 2006/07 2007/08 2008/09 2009/10 2010/11 2011/12 2012/13 2013/14 2014/15
Figure 4: Percentage free school meal entitlement by school sector, 1993/94 - 2014/15
12 • The proportion of pupils that are free school meal entitled has also risen in all other
phases; 31.9% year 1-7 pupils in primary schools are entitled compared to 31.1% last year (Figure 4), 32.0% of pupils in nursery classes and schools compared to 31.3% last year, and 52.5% of pupils in special schools compared to 50.9% in 2013/147.
7
13
Section 6: Changes in enrolment patterns
This final section details changes in enrolment patterns in schools in recent years.
6.1. Irish medium education
• A total of 5,248 pupils participate in Irish medium education, with 4,166 pupils educated in Irish medium schools and a further 1,082 pupils educated in Irish medium units attached to English-medium schools (Table 2c).
• The total number of pupils in Irish medium education has steadily risen over time, increasing by almost 1,200 pupils since 2009/10 and more than 300 pupils since last year. Most of this increase is coming from greater enrolments in Irish medium schools rather than units. One of the reasons for this increase is the fact that there are six additional Irish medium primary schools in this period.
6.2. Newcomer8 pupils
• There has also been an increase in the number and proportion of newcomer pupils in schools in Northern Ireland (Table 6c). In 2014/15, there are approximately 11,550 newcomer pupils accounting for 3.5% of the school population. This has risen by almost 4,000 from five years prior. This may be explained by increased levels of migration among school age children over the last number of years9.
8
A newcomer pupil is one who has enrolled in a school but who does not have the satisfactory language skills to participate fully in the school curriculum, and the wider environment, and does not have a language in common with the teacher, whether that is English or Irish.
9
14
Notes for readers
National Statistics
1. The United Kingdom Statistics Authority has designated these statistics as National Statistics, in accordance with the Statistics and Registration Service Act 2007 and signifying compliance with the Code of Practice for Official Statistics.
Designation can be broadly interpreted to mean that the statistics:
• meet identified user needs;
• are well explained and readily accessible; • are produced according to sound methods, and
• are managed impartially and objectively in the public interest.
Once statistics have been designated as National Statistics it is a statutory requirement that the Code of Practice shall continue to be observed.
2. For general enquiries about National Statistics, contact the National Statistics Public Enquiry Service on 0845 601 3034
minicom: 01633 812399
E-mail: info@statistics.gov.uk
Fax: 01633 652747
Letters: Customer Contact Centre, Office for National Statistics, Rm 1.101, Government Buildings, Cardiff Road, Newport, NP10 8XG
3. You can also find National Statistics on the Internet: http://www.statistics.gov.uk
School Census
4. The statistics in this release have been derived from the annual school census; details can be found at
http://www.deni.gov.uk/census_description_for_web_14_15_r1.docx. For
voluntary and private pre-school centres, and nursery schools, the census consists of a paper return comprising a number of tables; for post-primary, primary and special schools, it consists of a return comprising individual pupil records, made by Electronic Data Interchange. The tables presented in the release reflect key
information on enrolments, as determined by Departmental needs and also on requests for information from other sources.
5. The 2014/15 figures in this statistical release are based on information as at 10 October 2014. They may be subject to minor revision and these will be notified in accordance with our revisions policy. This can be accessed at
15 6. The figures for nursery classes relate to approved nursery classes in primary
schools. The figures for reception refer to pupils who were below compulsory school age at 1st July 2014, who were admitted to a reception class or group in primary school following their 4th birthday. Schools may admit reception pupils throughout the year, but only those who have been admitted by 31st October are counted in the school census.
7. The figures for school children in this release relate to children in funded pre-school education. Previous releases included small numbers of children in non-funded pre-school places in preparatory departments of grammar schools. While previous statistical releases have not been revised to take account of this minor change, time series and other tables available on the Education statistics section of the DE website have been revised, so that the figures are consistent in definition and relate to children in funded pre-school education.
8. Further statistics relating to school numbers and enrolments can be found on the DE website (www.deni.gov.uk) under the Facts and Figures section.
The DE website presents figures taken from the school census, summarised at regional, Education and Library Board and school level. Statistics on pupil
attendance, pupil: teacher ratios, school leaver destinations and qualifications may also be accessed via the website.
9. The data is produced at aggregate level only, therefore individual pupils cannot be identified. More information on confidentiality can be found in the DE
Confidentiality and Access Statement at the following link:
http://www.deni.gov.uk/de_statement_on_data_confidentiality_and_access_r1.do c
Data quality and coverage
16 Further enquiries
Request for further information should be addressed to:-
Paul Matthews
Statistics and Research Team Department of Education Rathgael House
Balloo Road Rathgill BANGOR Co. Down BT19 7PR
Telephone (028) 9127 9717/ Fax (028) 9127 9594 e-mail: statistics@deni.gov.uk
Special analyses of the school census can be undertaken on request.
Press enquiries should be made to the Department’s Press Office at the same address, telephone (028) 9127 9207 / fax (028) 9127 9271.
Feedback on this publication can be provided directly to Paul Matthews (contact details above) or via the feedback questionnaire on our website.
2009/10 2010/11 2011/12 2012/13 2013/14 2014/15
Nursery Schools Controlled 65 65 65 65 64 64
Catholic Maintained 33 33 32 32 32 32
TOTAL 98 98 97 97 96 96
Controlled 106 107 107 109 112 114
Catholic Maintained1 85 85 87 87 88 88
Other Maintained2 5 9 9 11 11 13
Controlled Integrated 3 3 3 3 3 3
Grant Maintained Integrated 14 14 14 14 14 14
TOTAL 213 218 220 224 228 232
Controlled 39 30 35 31 26 22
Catholic Maintained 66 67 61 56 45 43
Other Maintained - 1 - 1 1 1
Controlled Integrated 3 4 3 4 4 4
Grant Maintained Integrated - - - -TOTAL 108 102 99 92 76 70
Voluntary 330 345 341 343 343 342
Private 28 35 40 47 53 59
TOTAL 358 380 381 390 396 401
All Centres GRAND TOTAL3 772 794 796 802 795 798
1
Includes one Irish medium school with a nursery class in 2014/15.
2
Excludes one Irish medium school with a nursery class in 2014/15.
3
The sum of the subtotals will not sum to the grand total as some primary schools have both nursery and reception classes
Voluntary and private pre-School centres with funded places
Primary Schools with Funded Reception
[image:17.595.59.539.125.401.2]Nursery Schools Controlled 65 65 65 65 64 64
Catholic Maintained 33 33 32 32 32 32
TOTAL 98 98 97 97 96 96
Primary Schools Controlled1 386 383 378 374 370 370
Catholic Maintained2,5 398 396 392 387 384 381
Other Maintained Irish Medium3 20 21 23 25 25 25
Other 4 4 4 4 4 4
Controlled Integrated 18 19 19 19 19 19
Grant Maintained Integrated 23 23 23 23 23 23
TOTAL 849 846 839 832 825 822
Preparatory Departments4 Controlled 3 3 3 3 3 3
Voluntary Schools under Catholic Management - - - -Schools under Other Management 14 14 12 12 11 11
TOTAL 17 17 15 15 14 14
Secondary Controlled 57 57 56 55 53 51
(Non Grammar) Catholic Maintained6 72 71 71 71 68 68
Schools Other Maintained Irish Medium 1 1 1 1 1 1
Other - - - -Controlled Integrated 5 5 5 5 5 5
Grant Maintained Integrated 15 15 15 15 15 15
TOTAL 150 149 148 147 142 140
Grammar Schools Controlled 17 17 17 17 17 18
Voluntary Schools under Catholic Management7 30 29 29 29 29 29
Schools under Other Management 22 22 22 22 22 21
TOTAL 69 68 68 68 68 68
Special Schools TOTAL 41 41 41 40 40 39
Hospital Schools TOTAL 2 2 2 1 1 1
Independent Schools TOTAL 14 15 15 15 15 14
All schools GRAND TOTAL 1,223 1,219 1,210 1,200 1,187 1,180
1
Includes two Irish Medium Controlled schools in 2014/15.
2 Includes one Irish Medium Catholic Maintained school in 2014/15. 3
Excludes two Irish Medium Controlled schools and one Irish Medium Catholic Maintained school in 2014/15.
4
These are part of grammar schools.
5
Includes 7 schools with Irish medium units.
6
Includes 3 schools with Irish medium units in 2014/15.
7
[image:18.842.56.740.95.436.2]Controlled Schools
Catholic Maintained
Schools
Other Maintained
Schools
Controlled Integrated
Schools
Grant Maintained
Integrated Schools
Voluntary Schools
Voluntary Pre-School
Centres
Private Pre-School
Centres
Grand Total
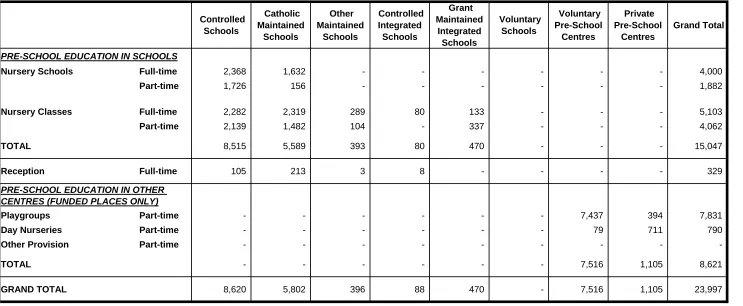
PRE-SCHOOL EDUCATION IN SCHOOLS
Nursery Schools Full-time 2,368 1,632 - - - - 4,000
Part-time 1,726 156 - - - - 1,882
Nursery Classes Full-time 2,282 2,319 289 80 133 - - - 5,103
Part-time 2,139 1,482 104 - 337 - - - 4,062
TOTAL 8,515 5,589 393 80 470 - - - 15,047
Reception Full-time 105 213 3 8 - - - - 329
Playgroups Part-time - - - - 7,437 394 7,831
Day Nurseries Part-time - - - - 79 711 790
Other Provision Part-time - - -
-TOTAL - - - - 7,516 1,105 8,621
GRAND TOTAL 8,620 5,802 396 88 470 - 7,516 1,105 23,997
[image:19.842.56.799.99.405.2]Schools under Other Management
NURSERY
Nursery Schools Full-time 2,368 1,632 - - - - - - 4,000
Part-time 1,726 156 - - - - - - 1,882
Nursery Classes Full-time 2,282 2,319 289 80 133 - - - 5,103
Part-time 2,139 1,482 104 - 337 - - - 4,062
TOTAL 8,515 5,589 393 80 470 - - - 15,047 PRIMARY
Reception 105 213 3 8 - - - - 329
Primary Schools (Year 1 - Year 7) 75,688 75,771 2,872 3,733 5,671 - - - 163,735
Prep. Departments (Year 1- Year 7) 186 - - - - - 1,627 - 1,813
TOTAL 75,979 75,984 2,875 3,741 5,671 - 1,627 - 165,877 SECONDARY (Year 8 - Year 14)
Secondary (Non Grammar) 27,918 39,347 581 2,502 9,492 - - - 79,840
Grammar 15,787 - - - - 27,391 19,535 - 62,713
TOTAL 43,705 39,347 581 2,502 9,492 27,391 19,535 - 142,553 SPECIAL 4,762 234 67 - - - - - 5,063 HOSPITAL 112 - - - - - - - 112 INDEPENDENT - - - - - - - 643 643
GRAND TOTAL 133,073 121,154 3,916 6,323 15,633 27,391 21,162 643 329,295
Non
Grant-Aided Grand Total Schools
under Catholic Management Controlled Catholic
Maintained
Other Maintained
Controlled Integrated
Grant Maintained
Integrated
[image:20.842.59.787.93.413.2]435
434 473 468 467 480
Nursery Classes in Irish-medium Schools Full-time 104 235 258 309 312 315
Part-time 52 23 - - - 52
Nursery Classes in Irish-medium units Full-time 26 26 26 26 26 30
Part-time - - - -Reception 5 - - - -
-TOTAL 622 718 757 803 805 877
PRIMARY Primary Schools (Year 1 - Year 7) schools 2,097 2,137 2,191 2,411 2,570 2,738 units 650 670 682 644 686 720
TOTAL 2,747 2,807 2,873 3,055 3,256 3,458 POST-PRIMARY (Year 8 - Year 14) Post-primary Schools schools 561 553 550 541 564 581
units 145 159 212 228 267 332
TOTAL 706 712 762 769 831 913
INDEPENDENT - 11 7 6 15
-GRAND TOTAL 4,075 4,248 4,399 4,633 4,907 5,248
2014/15
Voluntary and private pre-schools - funded places
[image:21.842.55.762.84.344.2]PRIMARY
Nursery Classes Full-time 261 238 235 212 212 213 Part-time 237 260 263 287 317 337
Reception 12 18 16 10 10 8
Year 1 - Year 7 8,105 8,402 8,525 8,881 9,100 9,404
TOTAL 8,615 8,918 9,039 9,390 9,639 9,962
SECONDARY (Year 8 - Year 14)
Year 8 - Year 12 10,418 10,417 10,405 10,279 10,194 10,050
Year 13 - Year 14 1,681 1,716 1,726 1,834 1,912 1,944
TOTAL 12,099 12,133 12,131 12,113 12,106 11,994
GRAND TOTAL 20,714 21,051 21,170 21,503 21,745 21,956
Note:
1. Figures include children attending Controlled Integrated schools and Grant Maintained Integrated Schools.
2013/14 2014/15
[image:22.842.34.717.85.274.2]Numbers and Percentages3
Number Enrolment Percentage
Nursery Schools
Full-time Controlled 1,074 2,368 45.4 Catholic Maintained 816 1,632 50.0 TOTAL 1,890 4,000 47.3 Nursery Schools
Part-time Controlled 194 1,726 11.2 Catholic Maintained 12 156 7.7 TOTAL4 206 1,882 10.9 Nursery Classes
Full-time Controlled 951 2,282 41.7 Voluntary - - -Catholic Maintained 1,030 2,319 44.4 Other Maintained 151 289 52.2 Controlled Integrated 44 80 55.0 Grant Maintained Integrated 47 133 35.3 TOTAL 2,223 5,103 43.6 Nursery Classes
Part-time Controlled 245 2,139 11.5 Voluntary - - -Catholic Maintained 196 1,482 13.2 Other Maintained 11 104 -Controlled Integrated - - -Grant Maintained Integrated 42 337 12.5 TOTAL 494 4,062 12.2 All Nursery Provision
Full- and part-time Controlled 2,464 8,515 28.9 Voluntary - - -Catholic Maintained 2,054 5,589 36.8 Other Maintained 162 393 41.2 Controlled Integrated 44 80 55.0 Grant Maintained Integrated 89 470 18.9 TOTAL 4,813 15,047 32.0 Voluntary and Private
Pre-School Centres (funded places only)
Part-time Voluntary 931 7,516 12.4 Private 48 1,105 4.3 TOTAL 979 8,621 11.4
TOTAL 5,792 23,668 24.5
Table 3a(ii) : Reception pupils entitled to Free School Meals by management type, 2014/15
Numbers and Percentages1
Number Enrolment Percentage
Reception pupils
Full-time Controlled # # #
Catholic Maintained 43 213 20.2
Other Maintained * * *
Controlled Integrated - 8 0.0 Grant Maintained Integrated - - 0.0 Voluntary - - 0.0
TOTAL 63 329 19.1
type and management type, 2014/15
1 Excludes reception pupils, since data on whether the parents of these pupils were in receipt of Income Support or
income-based Jobseeker's Allowance are not collected.
2 Income Support and income-based Jobseeker's Allowance are two of the benefits which determine eligibility for free
school meals. As school meals are not universally available to children in pre-school education, parental receipt of these benefits is a better indicator of social disadvantage for the pre-school sector. Pupils who are recorded as entitled to free school meals in nursery classes in primary schools are also inlcuded in the totals.
3
Percentages express the number of children in funded places whose parents were in receipt of Income Support or income-based Jobseeker's Allowance at the time of first application for admission, as a proportion of all children in funded places. Thus, for example, 45.4% of children in full-time places in controlled nursery schools had parents in receipt of these benefits.
1
[image:23.595.118.474.135.479.2]Numbers and percentages1
Number Enrolment Percentage
Primary Schools Controlled 21,930 75,688 29.0
(Year 1-Year 7) Catholic Maintained 26,708 75,771 35.2
Other Maintained Irish Medium 1,193 2,491 47.9
Other 56 381 14.7
Controlled Integrated 1,297 3,733 34.7
Grant Maintained Integrated 1,545 5,671 27.2
TOTAL 52,729 163,735 32.2
Prep. Departments Controlled 5 186 2.7
Voluntary 12 1,627 0.7
TOTAL 17 1,813 0.9
ALL PRIMARY AND PREP YEAR 1 - 7 PUPILS 52,746 165,548 31.9
Secondary Controlled 8,639 27,918 30.9
(Non Grammar) Catholic Maintained 16,480 39,347 41.9
Schools Other Maintained Irish Medium 352 581 60.6
Controlled Integrated 825 2,502 33.0
Grant Maintained Integrated 3,330 9,492 35.1
TOTAL 29,626 79,840 37.1
Grammar Schools Controlled 1,599 15,787 10.1
Voluntary Schools under Catholic Management 4,524 27,391 16.5
Schools under Other Management 1,487 19,535 7.6
TOTAL 7,610 62,713 12.1
ALL POST-PRIMARY SCHOOLS 37,236 142,553 26.1
ALL PRIMARY AND POST-PRIMARY SCHOOLS 89,982 308,101 29.2
ALL SPECIAL SCHOOLS 2,659 5,063 52.5
* Fewer than 5 cases. # Number suppressed.
1
[image:24.595.58.539.116.433.2]Average number of pupils per class
Nursery Schools Controlled 26
Catholic Maintained 26
TOTAL 26
Nursery Classes Controlled 26
Catholic Maintained3 26
Other Maintained Irish Medium 26
Other 26
Controlled Integrated 27
Grant Maintained Integrated 26
TOTAL 26
Reception Classes4 Controlled 10
Catholic Maintained 20
Other Maintained Irish Medium
-Other
-Controlled Integrated
-Grant Maintained Integrated
-TOTAL 14
Primary Schools Controlled 6 25
(Year 1 - Year 7)5 Catholic Maintained 7 24
Other Maintained Irish Medium 8 19
Other 21
Controlled Integrated 25
Grant Maintained Integrated 27
TOTAL 24
Preparatory Departments Controlled 12
(Year 1 - Year 7)5 Voluntary Schools under Catholic Management
-Schools under Other Management 19
TOTAL 18
1.
Class size data is only collected in respect of nursery and primary schools and prep. departments.
2.
Children in learning support centres are excluded.
3.
Includes one Irish medium school.
4.
These are classes consisting solely of reception pupils. (See Notes to Readers point 6)
5.
Any reception pupils integrated into primary classes are excluded.
6.
Includes two Irish medium schools.
7.
Includes one Irish medium school.
8.
Nursery Schools Controlled 1,947 1,190 202 59 696 4,094
Catholic Maintained 38 1,574 14 13 149 1,788
TOTAL 1,985 2,764 216 72 845 5,882
Nursery Classes & Controlled 2,613 530 207 46 1,130 4,526
Reception Voluntary
-Catholic Maintained 48 3,772 24 # # 4,014
Other Maintained 41 314 - - 41 396
Controlled Integrated 41 31 * - # 88
Grant Maintained Integrated 139 171 # * 126 470
TOTAL 2,882 4,818 262 95 1,437 9,494
Voluntary 1,937 3,473 169 47 1,890 7,516
Private 392 278 23 6 406 1,105
TOTAL 2,329 3,751 192 53 2,296 8,621
ALL FUNDED PRE-SCHOOL EDUCATION 7,196 11,333 670 220 4,578 23,997
*Fewer than 5 cases. #
Number suppressed.
Voluntary and Private Pre-School Centres (funded children only)
Total
Protestant Catholic Other Christian Non Christian No Religion / Not
[image:26.842.57.781.100.332.2]Nursery Schools Controlled 1,947 1,190 202 59 696 4,094
Catholic Maintained 38 1,574 14 13 149 1,788
TOTAL 1,985 2,764 216 72 845 5,882
Nursery Classes & Controlled 2,613 530 207 46 1,130 4,526
Reception Voluntary - - -
-Catholic Maintained 48 3,772 24 # # 3,844
Other Maintained 41 314 - - 41 396
Controlled Integrated 41 31 * - # 72
Grant Maintained Integrated 139 171 # * 126 436
TOTAL 2,882 4,818 231 46 1,297 9,274
Primary Schools Controlled 51,708 5,051 4,101 751 14,077 75,688
(Year 1 - Year 7) Catholic Maintained 579 73,197 403 478 1,114 75,771
Other Maintained 276 2,369 49 8 170 2,872
Controlled Integrated 1,518 1,118 203 61 833 3,733
Grant Maintained Integrated 1,800 2,443 411 70 947 5,671
TOTAL 55,881 84,178 5,167 1,368 17,141 163,735
Prep. Departments Controlled 119 8 14 - 45 186
(Year 1 - Year 7) Voluntary 787 204 215 37 384 1,627
TOTAL 906 212 229 37 429 1,813
Secondary Controlled 22,714 860 1,082 158 3,104 27,918
( Non Grammar) Catholic Maintained 467 38,189 203 123 365 39,347
Schools Other Maintained - 542 * - # 581
Controlled Integrated 1,634 402 # 23 # 2,502
Grant Maintained Integrated 4,026 3,867 458 99 1,042 9,492
TOTAL 28,841 43,860 1,832 403 4,904 79,840
Grammar Schools Controlled 11,959 1,335 792 94 1,607 15,787
(Year 8 - Year 14) Voluntary Schools under Catholic Management 260 26,658 150 82 241 27,391
Schools under Other Management 12,701 2,381 1,310 236 2,907 19,535
TOTAL 24,920 30,374 2,252 412 4,755 62,713
Special Schools Controlled 1,850 1,994 # # 763 4,762
Catholic Maintained * 224 - * 5 234
Other Maintained # 21 * * 13 67
TOTAL 1,885 2,239 128 30 781 5,063
ALL NURSERY, PRIMARY, POST-PRIMARY AND SPECIAL SCHOOLS 117,300 168,446 10,086 2,417 30,292 328,541
* Fewer than 5 cases.
#
Number suppressed.
Total Protestant Catholic Other Christian Non Christian No Religion /
[image:27.842.57.792.106.459.2]White (excluding
Irish Traveller)
Chinese Irish
Traveller
Indian/Sri
Lankan Pakistani Black
Other ethnic group
Mixed ethnic group
Total
Nursery Schools 5,637 25 6 # * 22 62 96 5,882
Nursery Classes & Reception 9,110 42 36 # # 48 79 102 9,494
Voluntary and Private Pre-School Centres (funded
children only) 8,288 24 14 36 8 25 130 96 8,621
ALL FUNDED PRE-SCHOOL EDUCATION 23,035 91 56 137 18 95 271 294 23,997
*Fewer than 5 cases.
White (excluding
Irish Traveller)
Chinese Irish
Traveller
Indian/Sri
Lankan Pakistani Black
Other ethnic group
Mixed ethnic group
Total
Nursery Schools 5,637 25 6 # * 22 62 96 5,848
Nursery Classes & Reception 9,110 42 36 # # 48 79 102 9,417
Primary Schools & Prep. Departments (Year 1 -
Year 7) 159,039 549 642 876 161 702 1,490 2,089 165,548
Secondary (Non Grammar) Schools 77,651 147 262 124 57 422 628 549 79,840
Grammar Schools (Year 8 - Year 14) 60,862 395 9 338 61 100 395 553 62,713
Special Schools 4,861 16 43 18 5 11 53 56 5,063
ALL NURSERY, PRIMARY, POST-PRIMARY AND
SPECIAL SCHOOLS 317,160 1,174 998 1,457 294 1,305 2,707 3,445 328,541
*Fewer than 5 cases.
#
[image:29.842.56.795.115.371.2]Number Percentage Number Percentage Number Percentage Number Percentage Number Percentage Number Percentage
Nursery Schools 175 3.0% 191 3.2% 242 4.1% 327 5.5% 330 5.6% 323 5.5%
Nursery Classes & Reception 342 3.9% 373 4.2% 483 5.3% 512 5.6% 570 6.1% 598 6.3%
Primary Schools & Prep. Departments
(Year 1 - Year 7) 4,788 3.1% 5,019 3.2% 5,149 3.3% 5,969 3.8% 6,854 4.2% 8,080 4.9%
Secondary (Non Grammar) Schools 2,001 2.3% 2,114 2.5% 2,218 2.6% 2,244 2.7% 2,288 2.8% 2,219 2.8%
Grammar Schools (Year 8 - Year 14) 401 0.6% 336 0.5% 264 0.4% 274 0.4% 213 0.3% 232 0.4%
Special Schools 47 1.1% 60 1.3% 62 1.4% 91 2.0% 101 2.1% 113 2.2%
ALL NURSERY, PRIMARY,
POST-PRIMARY AND SPECIAL SCHOOLS 7,754 2.4% 8,093 2.5% 8,418 2.6% 9,417 2.9% 10,356 3.2% 11,565 3.5% 2014/15
1.A newcomer pupil is one who has enrolled in a school but who does not have the satisfactory language skills to participate fully in the school curriculum, and the wider environment, and does not have a language in common with the teacher, whether that is English or Irish. This has previously been referred to as English an Additional Language. It does not refer to indigenous pupils who choose to attend an Irish medium school.
[image:30.842.53.788.111.341.2]% Statemented
children
% SEN children (non-statemented)
% SEN children (stage 1 - 5) VOLUNTARY and PRIVATE PRE-SCHOOL EDUCATION CENTRES2 0.4% 11.1% 11.6%
NURSERY SCHOOLS
Total nursery school pupils 1.3% 22.9% 24.2%
PRIMARY SCHOOLS and PREPARATORY DEPARTMENTS
Total nursery class pupils # # 4.5%
Total reception pupils * # 4.9%
Primary schools (year 1 - 7) 3.1% 18.6% 21.7%
Grammar school Preparatory Depts.(year 1 - 7) 1.4% 13.3% 14.7%
Total year 1 - 7 pupils 3.0% 18.6% 21.6%
Total primary pupils 2.9% 17.8% 20.7%
POST PRIMARY SCHOOLS
Secondary (non grammar) schools 6.5% 23.7% 30.2%
Grammar Schools 1.3% 7.7% 9.0%
Total post primary pupils 4.2% 16.7% 20.9%
SPECIAL SCHOOLS Total 94.7% 5.3% 100.0%
ALL SCHOOLS Total 4.9% 17.2% 22.0%
ALL SCHOOLS AND PRE-SCHOOL EDUCATION CENTRES 4.7% 17.0% 21.8%
[image:31.595.61.541.115.422.2]