Educational destinations of Key Stage 4 and post-16 learners, 2011/12
1Background
Arrangements for measuring performance in school sixth forms and in further education/work-based learning are currently entirely separate. Performance measures are produced from different data-collection systems using differing analysis methodologies. This means we are unable to compare outcomes in a meaningful way across learner settings, and that learners and parents do not have access to transparent information to inform their choices. This has been identified as an issue by various reviews such as the Thomas review of educational structures and the Review of Qualifications.
To address this disparity, the Welsh Government’s Department for Education and Skills (DfES) is currently working to develop a set of consistent measures for further education institutions and sixth forms to enable the publication of headline and provider level information on an annual basis. Further information about DfES’ development of consistent measures for post-16 learning can be found on the DfES website.
One of the proposed measures is learner destination (i.e. what a learner moves on to do after completing their learning) and Welsh Government (WG) statisticians have been working closely with DfES officials to consider and overcome the issues involved in deriving this measure.
Destinations of learners can be categorised into two broad types: educational and employment. A separate project is looking at options for how the employment destinations of learners could be determined, and the resource implications. Options include the use of administrative data-sources held by the Department for Work and Pensions (DWP) and HM Revenue & Customs (HMRC), Careers Wales management information or a follow-up survey of learners (similar to the destination survey that exists on the Higher Education side).
This article therefore focuses on the educational destinations of learners and provides an overview of progress made in addition to some preliminary analysis. These are experimental data, and as such we would value any feedback on the methodology, please see further information section.
Data Sources
There are three distinct data-sources relating to learners in Wales: the Pupil Level Annual School Census (PLASC), Lifelong Learning Wales Record (LLWR) and the Higher Education Statistics Agency (HESA)
Date of Publication: 18 December 2014
Next update: Not a regular output
Author: Scott Clifford, Post-16 Education Statistics, Knowledge and Analytical Services
E-mail:
[email protected]
Telephone: 029 2082 5067
Twitter: www.twitter.com/statisticswales | www.twitter.com/ystadegaucymru
student record. These collections relate to pupils enrolled at maintained schools in Wales; learners accessing post-16 learning at Further Education (FE) institutions, Work Based Learning (WBL) providers or Local Authorities; and students enrolled at HE institutions in the UK respectively.
Data Linking
Initial discussions were held to review the commonality of these datasets and consider the issues involved in linking them to determine the educational destinations/progression of learners.
Specific consideration was given to the Unique Learner Number (ULN) which was introduced in Wales in 2011. The requirement to submit ULN data for learners was added to both the PLASC and LLWR specifications from 2011/12 onwards and this information will facilitate data-linkage in future. However, analysis revealed that ULN-coverage was less than complete for 2011/12 and, combined with the absence of ULN data on the HESA student record, it was concluded that a significant amount of the data-linking work would need to be undertaken externally.
Following a tender-exercise, a contract to match the key datasets was awarded to Fischer Family Trust (FFT). Datasets relating to the 2011/12 and 2012/13 academic years were produced from the PLASC, LLWR and HESA data-collections and provided to FFT. Data-linking was undertaken throughout the summer and matched output datasets were delivered to the WG at the end of August. Further information on the data-matching methodology employed by FFT can be found towards the end of this article.
Initial results
On receipt of the matched datasets, WG statisticians undertook a quality assurance exercise to determine the proportions of the respective learner cohorts in 2011/12 that were successfully matched to an educational destination in 2012/13. In general, the match-rates were at a level as might be expected according to age, and sector:
High for year 11 and year 12 pupils (92 per cent and 93 per cent respectively) and relatively high for year 13 pupils (79 per cent)
High for FE learners aged under 20 (68 per cent) but lower for FE learners aged 20 and over (51 per cent), and
Lowest for WBL learners (35 per cent).
Note that WBL learners will predominantly progress into, or remain in, employment following their programme and therefore the low match-rate to educational destinations was not unexpected.
Based on these match-rates, it was decided to focus subsequent analysis on the Key Stage 4 and Key Stage 5 cohorts. For the purposes of this output, we have defined learners aged 16 to 19 who are engaged in a level 3 programme (excluding apprenticeship provision) at either a school sixth form or FE
institution as Key Stage 5.
Methodological Issues
Determination of leaver cohorts
The LLWR is a full-year data collection and includes information relating to completion status and the end-dates of learning programmes. Therefore determining leaver cohorts from FE institutions and WBL providers in a given academic year was relatively straightforward.
However, the PLASC is a census-based data-collection which includes all pupils “in learning” as at a given date in January each year. Data on completion status or actual leave dates has not previously been collected. (Data on completion is being collected for the first time for the 2013/14 academic year, but was not in place for the years covered by the data matching exercise.)
For the Key Stage 4 leaver cohort, all Year 11 pupils on PLASC are included.
In determining a Key Stage 5 leaver cohort, pupils in years 12, 13 and 14 on the January 2012 PLASC were compared against the pupils in years 12, 13 and 14 on the January 2013 PLASC. The pupils that were not recorded at the same school on the January 2013 PLASC at the same school were defined as ‘leavers’. It therefore includes leavers from Year 12 (i.e. during/after the first year of sixth form), as well as Years 13 and 14.
Categorisation of learning programmes
To quantify learner progression, it is necessary to determine the types and levels of learning programmes that learners have both undertaken and subsequently progressed to.
LLWR data for WBL provision is generally categorised into well-defined learning programmes (e.g. Apprenticeships, Traineeships), which reflect the funding and contractual arrangements for WBL. However, this isn’t the case for FE provision or sixth form provision (which has historically been funded at learning activity level, with programme-based funding introduced in 2014/15).
Hence, it was necessary to develop a methodology to derive the type and level of programme based on the learning activities undertaken by each learner (in the case of PLASC learners, this involved linking to the Post-16 PLASC activity dataset). Once developed, this methodology was then applied to both ‘leaver’ and ‘destination’ datasets.
Note that, due to data-linkage issues, it was not possible to determine the destination programmes of some sixth form learners. These are detailed under ‘Unspecified programme at school sixth form’ in the subsequent analysis.
Learners with multiple destinations
Our initial analysis of the matched datasets showed that some learners had been matched to multiple data-sources and therefore had multiple destinations. These instances can occur due to collaborative arrangements between school sixth forms and FE institutions. Other examples might include learners progressing to learning at an FE institution, withdrawing and subsequently enrolling at a sixth form in the same academic year.. Further to this, some learners who were matched to LLWR were recorded as undertaking multiple learning programmes in 2012/13.
Hence a hierarchal approach was developed which prioritised one destination for each leaver. In brief, this approach took the highest level destination for each learner and multiple destinations at the same level were then prioritised based on the start date of the respective programmes.
Further investigation suggested these were enrolments on HE ‘taster’ courses delivered by Welsh HE institutions. Hence, in these cases, the level 3 programme was prioritised ahead of HE.
Educational Destinations of Key Stage 4 and Key Stage 5 Learners
Tables 1 and 2 below detail the educational destinations of Key Stage 4 and Key Stage 5 learners who left in 2011/12.
Note that independent schools are not included in the analysis in terms of either the leaver or destination cohort as these establishments fall outside the scope of the PLASC data collection.
Key results are as follows:
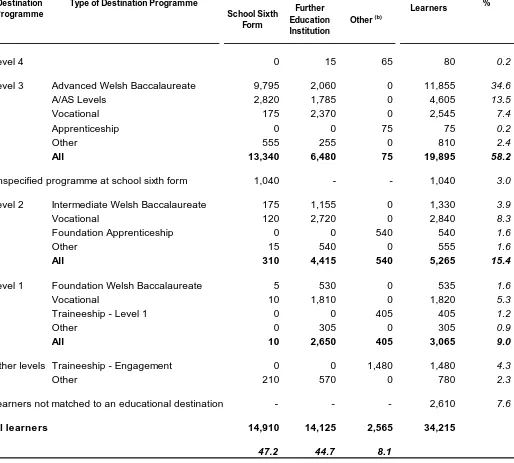
58 per cent of Key Stage 4 leavers progressed to a level 3 programme at a school sixth form, FE institution or WBL provider. A further 34 per cent remained in some form of education or training (i.e. at level 2 or below)
47 per cent of Key Stage 4 leavers with a matched destination were at school sixth forms and 45 per cent were at FE institutions.
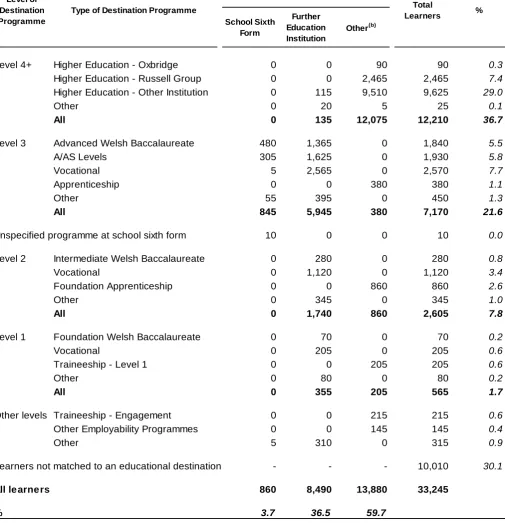
37 per cent of Key Stage 5 leavers progressed to a Higher Education programme at a HE or FE institution. A further 33 per cent remained in some other form of education or training such as (i.e. at level 3 or below)
Table 1: Educational Destinations of Key Stage 4 leavers
(a), 2011/12
School Sixth Form
Further Education Institution
Other (b)
Level 4 0 15 65 80 0.2
Level 3 Advanced Welsh Baccalaureate 9,795 2,060 0 11,855 34.6
A/AS Levels 2,820 1,785 0 4,605 13.5
Vocational 175 2,370 0 2,545 7.4
Apprenticeship 0 0 75 75 0.2
Other 555 255 0 810 2.4
All 13,340 6,480 75 19,895 58.2
Unspecified programme at school sixth form 1,040 - - 1,040 3.0
Level 2 Intermediate Welsh Baccalaureate 175 1,155 0 1,330 3.9
Vocational 120 2,720 0 2,840 8.3
Foundation Apprenticeship 0 0 540 540 1.6
Other 15 540 0 555 1.6
All 310 4,415 540 5,265 15.4
Level 1 Foundation Welsh Baccalaureate 5 530 0 535 1.6
Vocational 10 1,810 0 1,820 5.3
Traineeship - Level 1 0 0 405 405 1.2
Other 0 305 0 305 0.9
All 10 2,650 405 3,065 9.0
Other levels Traineeship - Engagement 0 0 1,480 1,480 4.3
Other 210 570 0 780 2.3
Learners not matched to an educational destination - - - 2,610 7.6
All learners 14,910 14,125 2,565 34,215
% 47.2 44.7 8.1
(a)
Defined as all year 11 learners enrolled at maintained schools in Wales.
(b)
Includes HE institutions and WBL providers
Sources: Pupil Level Annual Schools Census (PLASC), Lifelong Learning Wales Record (LLWR), HESA Student Record
Level of Destination Programme
Type of Destination Programme
Educational Establishment
Total
Table 2: Educational Destinations of Key Stage 5 leavers
(a), 2011/12
School Sixth Form
Further Education Institution
Other(b)
Level 4+ Higher Education - Oxbridge 0 0 90 90 0.3
Higher Education - Russell Group 0 0 2,465 2,465 7.4
Higher Education - Other Institution 0 115 9,510 9,625 29.0
Other 0 20 5 25 0.1
All 0 135 12,075 12,210 36.7
Level 3 Advanced Welsh Baccalaureate 480 1,365 0 1,840 5.5
A/AS Levels 305 1,625 0 1,930 5.8
Vocational 5 2,565 0 2,570 7.7
Apprenticeship 0 0 380 380 1.1
Other 55 395 0 450 1.3
All 845 5,945 380 7,170 21.6
Unspecified programme at school sixth form 10 0 0 10 0.0
Level 2 Intermediate Welsh Baccalaureate 0 280 0 280 0.8
Vocational 0 1,120 0 1,120 3.4
Foundation Apprenticeship 0 0 860 860 2.6
Other 0 345 0 345 1.0
All 0 1,740 860 2,605 7.8
Level 1 Foundation Welsh Baccalaureate 0 70 0 70 0.2
Vocational 0 205 0 205 0.6
Traineeship - Level 1 0 0 205 205 0.6
Other 0 80 0 80 0.2
All 0 355 205 565 1.7
Other levels Traineeship - Engagement 0 0 215 215 0.6
Other Employability Programmes 0 0 145 145 0.4
Other 5 310 0 315 0.9
Learners not matched to an educational destination - - - 10,010 30.1
All learners 860 8,490 13,880 33,245
% 3.7 36.5 59.7
(a)
Defined as all learners aged 16 to 19 engaged in a level 3 programme at either a school sixth form or FE institution.
(b)
Includes HE institutions and WBL providers
Sources: Pupil Level Annual Schools Census (PLASC), Lifelong Learning Wales Record (LLWR), HESA Student Record
Level of Destination Programme
Type of Destination Programme
Educational Establishment
Total
Further Information
1
Data Sources
This Statistical Article summarises data on the educational destinations of learners leaving Key Stage 4 and Post-16 learning in 2011/12. The leaver cohorts comprise Key Stage 4 (year 11) leavers from maintained schools in Wales and Key Stage 5 leavers from maintained school sixth forms and FE institutions.
The key data-sources used in this article are as follows:
Pupil Level Annual School Census (PLASC);
Lifelong Learning Wales Record (LLWR); and
Higher Education Statistics Agency (HESA) student record
Our statement of administrative sources, which refers specifically to the LLWR and HESA student record, can be found at:
Statement of Administrative Sources
2
Data Matching Process
The PLASC, LLWR and HESA datasets were matched to the FFT core pupil table2 to assign unique
candidate identifiers that were common across each dataset.
The specified requirement was for the PLASC, LLWR and HESA records to be statistically matched. That is, they were required to be matched at a level of quality suitable for use at aggregate level and statistical purposes, but not at individual pupil-level. Although the same matching routines would be applied by FFT when performing a full non-statistical match, there is less manual checking and fewer amendments of individual records. Instead, automated rules are used that guarantee a high rate of accuracy based on past matches using the same criteria from similar datasets that have been fully checked.
After matching had taken place, the post-16 identifiers along with other fields were used to cross-check the candidate identifiers allocated. The chances of successfully matching a record depend on: the number of common fields; the similarity of their values; and how effectively they discriminate between candidates. To improve the chances of a correct match the identifying fields are cleaned and reformatted to form a set of standard matching fields in each dataset.
The matching routines iterate through a list of field combinations until a match is found and an identifier can be assigned from one record to the other. The combinations include many transformations such as surname/forename reversals and so forth. To find the best match between datasets the routines work from the strongest through to relatively weaker match levels or combinations. Around two thousand match levels were used.
The match level can be used to approximate the quality of the match. It is important to note that any individual match is either successful or not and those at weaker levels are not necessarily mismatches. Match levels have been sampled and rated over time, with the matching of numerous similar datasets having contributed to match level ratings.
Minimum match criteria is applied to prevent over-matching. Over-matching is the problem where two candidates are matched when they should not be. Under-matching is the problem where two
2
records belonging to a single candidate are not matched together. In principle, under-matching is considered a preferable solution when the data quality does not allow correct matching to consistently take place.
Previously unseen learners (not present in FFT’s core pupil database) from the two leaver cohort datasets were allocated new candidate identifiers. Subsequent grouping and matching across all five datasets ensured that common identifiers were maintained across both the leavers and destinations cohorts.
3
Definitions
3.1 Terminology
The term ‘academic year’ is used throughout this article to refer to the period 1 August to 31 July.
The term ‘learning activity’ refers to a specific qualification or course pursued by a learner, for example, an A Level or Key Skill. The term ‘learning programme’ refers to a group of related learning activities.
3.2 Cohorts
The base cohorts underpinning table 1 comprises all year 11 pupils in maintained schools in Wales recorded on PLASC. In instances where a pupil is enrolled at more than one school, we have taken the pupil’s main school and excluded the registration at the subsidiary school.
The base cohort underpinning table 2 comprises the leaver cohort of year 12, 13 and 14 pupils undertaking level 3 programmes in maintained schools as well as all learners aged 16 to 19 undertaking level 3 programmes at FE institutions in the respective academic year.
The cohort includes learners in maintained special schools (but not Pupil Referral Units). Learners in independent schools are not included.
3.3 Destination
Note that the coverage of education destinations is limited to maintained schools, FE institutions and work-based learning providers in Wales. Destinations to either FE institutions or work-based learning providers in England will not be identified, nor to independent schools whether in Wales or England. The HESA data covers all UK institutions.
The Russell Group is an association of 24 leading UK universities. The group includes the University of Oxford and the University of Cambridge but we have detailed learner progression to these insitutions separately in Table 2.
4.
Rounding and Suppression
5
Key Quality Information
This section provides a summary of information on this output against five dimensions of quality: Relevance, Accuracy, Timeliness and Punctuality, Accessibility and Clarity, and Comparability.
5.1 Relevance
The measures set out in this article are intended to be used:
by the Welsh Government - DfES, to monitor providers’ performance and as baseline information to set targets for improvement;
by Estyn, to inform inspection judgements on Key Question 1 ‘How good are outcomes?’; by providers themselves, as a management tool to measure their own performance and benchmark themselves against sector averages, as part of their annual self-assessment cycles; and
in future years once the analysis is established, as the basis of published performance indicators for individual providers, to inform learner and parental choice..
The measures are also used both within and outside the Welsh Government to monitor educational trends and as a baseline for further analysis of the underlying data. Some of the key users are:
Ministers and the Members Research Service in the National Assembly for Wales; Officials in the Welsh Government;
Other government departments; Students, researchers, and academics;
Individual citizens, private companies, and the media.
These statistics are used in a variety of ways. Some examples of these are:
general background and research; inclusion in reports and briefings; advice to Ministers;
to inform and evaluate the education policy-making process in Wales.
5.2 Accuracy
Statisticians within the Welsh Government undertake quality assurance processes ahead of publishing this article.
Pages 2 and 3 provide an overview of methodological/data-quality issues that relate specifically to the data in this output.
5.3 Timeliness and Punctuality
5.4 Accessibility and Clarity
This statistical release is pre-announced and then published on the Statistics and Research section of the Welsh Government website.
5.5 Comparability
The Department for Education (DfE) has released analysis detailing the destinations of Key Stage 4 and Key Stage 5 learners in England which can be found via the following link:
Destinations of key stage 4 and key stage 5 pupils: 2011 to 2012
However, due to differences in methodology and data collection, caution should be exercised in making direct comparisons with the figures contained within this release. In particular, the DfE figures:
detail employment destinations as well as education destination
measure participation in a destination that has been sustained for 2 terms, and use a different definition for Key Stage 5 learners.
5.6 Coherence
Careers Wales undertake an annual survey of school leavers on behalf of the Welsh Government. The data from this survey provides a valuable snapshot of pupil destinations.
The education destinations of year 11 leavers in 2012 are broadly comparable with the figures detailed in Table 1 of this article.
The Oxbridge Ambassador Project was undertaken in 2013 to investigate the apparent recent decline in Welsh entrants to the colleges of Oxford and Cambridge Universities. The data-analysis underpinning the project (as summarised in the Oxford Ambassador's Final Report) is comparable with the figures for Oxbridge progression detailed in table 2 of this article.
6.
Additional Information
Notes on the use of statistical articles
Statistical articles generally relate to one-off analyses for which there are no updates planned, at least in the short-term, and serve to make such analyses available to a wider audience than might otherwise be the case. They are mainly used to publish analyses that are exploratory in some way, for example:
Introducing a new experimental series of data;
A partial analysis of an issue which provides a useful starting point for further research but that nevertheless is a useful analysis in its own right;
Drawing attention to research undertaken by other organisations, either commissioned by the Welsh Government or otherwise, where it is useful to highlight the conclusions, or to build further upon the research;
An analysis where the results may not be of as high quality as those in our routine statistical releases and bulletins, but where meaningful conclusions can still be drawn from the results.
Where quality is an issue, this may arise in one or more of the following ways:
being unable to accurately specify the timeframe used (as can be the case when using an administrative source);
the quality of the data source or data used; or other specified reasons.
However, the level of quality will be such that it does not significantly impact upon the conclusions. For example, the exact timeframe may not be central to the conclusions that can be drawn, or it is the order of magnitude of the results, rather than the exact results, that are of interest to the audience.
The analysis presented does not constitute a National Statistic, but may be based on National Statistics outputs and will nevertheless have been subject to careful consideration and detailed checking before publication. An assessment of the strengths and weaknesses in the analysis will be included in the article, for example comparisons with other sources, along with guidance on how the analysis might be used, and a description of the methodology applied.
Articles are subject to the release practices as defined by the release practices protocol, and so, for example, are published on a pre-announced date in the same way as other statistical outputs.
Missing value symbols used in the article follow the standards used in other statistical outputs, as outlined below.
.. The data item is not available
. The data item is not applicable
- The data item is not exactly zero, but estimated as zero or less than half the final digit shown
* The data item is disclosive or not sufficiently robust for publication