Spatial ecology and conservation of sea turtles in coastal foraging habitat
191
0
0
Full text
(2) Spatial ecology and conservation of sea turtles in coastal foraging habitat. Thesis submitted by. Takahiro Shimada BSc Agriculture, Meiji University MSc Ecosystem studies, The University of Tokyo. October 2015. For the degree of Doctor of Philosophy College of Marine & Environmental Sciences James Cook University.
(3)
(4) Acknowledgements. When I met Col in Japan in 2007, little did I know how it would change my life with the subsequent PhD journey. The path was rather winding and with lots of obstacles but it has finally come to the end. I could not have come this far without the tremendous amount of support given to me before and during the time of my candidature. I am extremely fortunate to have my incredible supervisory team. Mark, you are the most laidback supervisor I can imagine, but yet you know exactly how to support and motivate students at the right time in the most pleasant manner. I have learned that it is possible to be a successful academic as well as a perfect “family guy”. You have been a model for how I want to be. Col, you literally changed my life. Not only did you initiate my PhD journey, but you have given me tremendous support throughout my candidature that no student could dream of. I admire your dedication into science and conservation of wildlife, your pioneering spirit, creativity and adaptability to succeed in research and conservation, your mental and physical strength to achieve big goals, and of course your unique sense of humour. Indeed I have witnessed “whiteman’s magic”. Rhondda, I honestly do not know how I could have come this far without you. When I sent you a “love letter” at the early stage of my candidature, you kindly accepted supervisorship when you had no obligation, no perceptible benefits and no knowledge of this random Japanese student. Every single meeting with you was such an inspiration. You have taught me the essence and power of quantitative analyses which I will cherish for the rest of my career. James, thank you for keeping your door open. It was very reassuring to know that you were always there to help. I am grateful to the following organizations for their financial support: James Cook University and National Environmental Research Program for providing me with a Postgraduate research and tuition fee scholarship; and to the Commonwealth Department of Environment and the Queensland Department of Environment and Heritage Protection for the provision of substantial project funding. I am also thankful to ITO Foundation for International Education Exchange for providing tuition fee and stipend scholarship during my Master’s degree, which eventually extended to be part of my PhD programme. I would like to thank EHP staff, Queensland Turtle Conservation Project and JCU volunteers for taking the time to assist with my field work, especially James Limpus, Duncan Limpus and Michael Savige for their expert skills in turtle handling. A special thanks to the Limpus family (Col, Leisa, James and Gina) for their generosity and hospitality during my field trips in iii.
(5) Moreton Bay. I am thankful to Reef HQ Aquarium, Australia Zoo Wildlife Hospital, and Underwater World Aquarium, for contributing satellite-tracking data of their rescued sea turtles to this study, and to M. Smith, K. Huff, C. Lacasse, and H. Campbell for their help in providing access to the data. Thank you to Peter Yates, Kimmie Riskas, Ruth Kamrowski, Leila Brook, and April Reside for their help with English and/or analyses. Thanks also to the staff in the College of Marine and Environmental Sciences, in particular Beth, Glen, Bec, Jo, Mel, Jaimie and Sarah, who were always there to help with a smile and laugh. Thank you to colleagues and friends: Chris, Hector, Natalie, Kimmie, Ruth, Chad, Pete, Shane, Justin, Hannah, Bernie, Mariana, Coralie, Kay, Emma, Mel, Cindy, Kat, Milena, Rie, George, Owen, Carol, Monica, Kristen, Leila, Julia and the rest of the lab group and friends. You made my life here as happy as it could be: Hector’s daily Broadway shows, the best burger cake, potato feast, fishing or attempting to catch fish at our secret fishing spots (Chad, Pete, sound familiar?), and comforting companionship during the hardest times of my life (Yes Chris that time…), all good memories. I look forward to spending more time together for many years to come! I am forever in debt to my Australia parents John and Jeanie Adams who supported me all the way through my study in JCU. I could not ask for a better place and people to live with. It was incredibly comforting to have a place that felt like “home”. I would also like to thank the Bannai family for their life-long company and support. Finally I wish to thank my family Ukio, Hideko and Satomi who gave me unconditional love and support, made me who I am, and believed in me for whatever I do. I am very fortunate to have such wonderful people in my life.. iv.
(6) Statement on the Contribution of Others. Supervision Associate professor Mark Hamann, James Cook University Dr Colin Limpus, Queensland Department of Environment and Heritage Protection Professor Rhondda Jones, James Cook University Dr James Moloney, James Cook University Research funding Queensland Department of Environment, Australian Government National Environmental Research Program (NERP), Australian Government College of Marine & Environmental Sciences, James Cook University Stipend scholarship International Postgraduate Research Scholarship, James Cook University/NERP ITO Foundation for International Education Exchange Graduate Research School, James Cook University Tuition Fee scholarship James Cook University ITO Foundation for International Education Exchange Travel support College of Marine & Environmental Sciences International Sea Turtle Symposium travel awards In-kind support Tracking data of free-living turtles prior to 2012 Dr. Colin Limpus, Queensland Department of Environment and Heritage Protection Rachel Groom, GHD Tracking data of rescued turtles Reef HQ Aquarium Underwater World Aquarium Australia Zoo Wildlife Hospital. v.
(7) Contribution of Others by Chapter Thesis. Details of publication on which paper is. Nature of the intellectual input of. Chapter. based. each author. Shimada T, Jones R, Limpus C, Hamann. I designed the study. Limpus and I. M (2012) Improving data retention and. conducted field research at sea and I. home range estimates by data-driven. conducted terrestrial experiment. I. screening. Marine Ecology Progress. analysed data and developed methods. Series 457:171-180. to screen GPS satellite telemetry. doi:http://dx.doi.org/10.3354/meps09747. data. I wrote the manuscript and all. 2. authors contributed to the editing. 3. 4. Shimada T, Limpus C, Jones R, Hazel J,. Limpus, Hamann, Jones and I. Groom R, Hamann M (2016) Sea turtles. developed the concepts of the study.. return home after intentional displacement. Limpus, Hamann, Groom and I. from coastal foraging areas. Marine. conducted field research. I analysed. Biology 163:1-14. data with advice provided by Jones. I. doi:http://dx.doi.org/10.1007/s00227-015-. wrote the manuscript and all authors. 2771-0. contributed to the editing.. Shimada T, Jones R, Limpus C, Hamann. Jones and I developed the concepts. M (in prep.) Stop and go: Sea turtles halt. of the study. I analysed data with. to reassess direction and use sunrise. advice provided by Jones. I wrote the. related cues for fine-scale navigation.. manuscript and all authors. Target journal: Journal of Experimental. contributed to the editing.. Marine Biology and Ecology. 5. 6. vi. Shimada T, Jones R, Limpus C, Groom R,. Limpus, Hamann and I developed the. Hamann M (in review) Home range and. concepts of the study. Limpus,. site fidelity of green and loggerhead. Hamann, Groom and I conducted. turtles in Queensland, Australia:. field research. I analysed data with. Incorporating temporal effects for a robust. advice provided by Jones. I wrote the. conservation planning. Marine Ecology. manuscript and all authors. Progress Series.. contributed to the editing.. Shimada T, Limpus C, Jones R, Hamann. Limpus and I developed the concepts. M (in prep.) Marine protected areas as sea. of the study. Limpus, Hamann and I. turtle habitats in Moreton Bay, Australia.. conducted field research. I wrote the. Target journal: Ocean & Coastal. manuscript and all authors. Management.. contributed to the editing..
(8) Ethics Statement. All necessary permits required to capture and satellite track turtles were obtained from Queensland Department of Environment and Heritage Protection (SA212/11/395) and JCU (A1229 and A1683).. vii.
(9) Outputs Associated with This Thesis. Papers published or intended for publication Shimada T, Jones R, Limpus C, Hamann M (2012) Improving data retention and home range estimates by data-driven screening. Marine Ecology Progress Series, 457, 171-180. doi:http://dx.doi.org/10.3354/meps09747 (Chapter 2). Shimada T, Limpus C, Jones R, Hazel J, Groom R, Hamann M (2016) Sea turtles return home after intentional displacement from coastal foraging areas. Marine Biology 163:1-14 doi:http://dx.doi.org/10.1007/s00227-015-2771-0 (Chapter 3). Shimada T, Jones R, Limpus C, Hamann M (in prep.) Stop and go: Sea turtles halt to reassess direction and use sunrise related cues for fine-scale navigation. Target journal: Journal of Experimental Marine Biology and Ecology (Chapter 4). Shimada T, Limpus C, Jones R, Groom R, Hamann M (in review) Home range and site fidelity of green and loggerhead turtles in Queensland, Australia: Incorporating temporal effects for a robust conservation planning. Marine Ecology Progress Series (Chapter 5). Shimada T, Limpus C, Jones R, Hamann M (in prep.) Marine protected areas as sea turtle habitats in Moreton Bay, Australia. Target journal: Ocean & Coastal Management (Chapter 6).. Computer Programming SDLfilter: an R package to screen satellite-derived data using the method described in Shimada et al. (2012) and Shimada et al. (2016). The latest package is available at an online code sharing and publishing service GitHub https://github.com/TakahiroShimada/SDLfilter.. viii.
(10) Selected technical reports Limpus C, Hamann M, Reed M, Bell I, Bowlett J, Mulville C, Shimada T, Smith A, Smith J (2015) Turtle telemetry project, Triangular Island, eastern Shoalwater Bay, June 2014 - March 2015. Brisbane: Department of Environment and Heritage Protection, Queensland Government. Hamann M, Riggin J, Shimada T, Limpus (2014) Six month report on the interesting habitat use by flatback turtles off the Curtis Island coast: 2013 – 2014. Gladstone Ports Corporation. Busilacchi S, Butler J, Skewes T, Posu J, Shimada T, Rochester W, Milton D (2014) Characterising fisheries of the Torres Strait Treaty Villages, Papua New Guinea. CSIRO. Shimada T, Hamann M, Limpus C, Limpus D (2013) Turtle and dugong research and monitoring, western Shoalwater Bay, 25 June - 5 July 2012. B. Marine turtle satellite telemetry. A report made to the Great Barrier Reef Marine Park Authority.. Conference Presentations Shimada T, Limpus C, Jones R, Groom R, Smith M, Hamann M (2014) Displaced Sea Turtles Return Home. Oral presentation at the Australian Marine Turtle 2nd Biennial Symposium, Perth, Australia. Shimada T, Jones R, Limpus C, Hamann M (2014) STOP AND GO: GPS telemetry reveals sea turtles halt to correct their direction. Oral presentation at the 34th Annual Symposium on Sea Turtle Biology and Conservation, New Orleans, USA. Shimada T (2013) Sea turtles; Master navigators. Three Minute Thesis, James Cook University, Townsville, Australia. Shimada T, Limpus C, Jones R, Moloney J, Hamann M (2012) Marine park zoning of eastern Moreton Bay as a sea turtle habitat. Oral presentation at the Australian Marine Turtle 1st Biennial Symposium, Sunshine Coast, Australia.. ix.
(11) Other Outputs. Papers published Shimada T, Aoki S, Kameda K, Hazel J, Reich K, Kamezaki N (2014) Site fidelity, ontogenetic shift and diet composition of green turtles Chelonia mydas in Japan inferred from stable isotope analysis. Endangered Species Research, 25, 151-164. doi:http://dx.doi.org/10.3354/esr00616 Gredzens C, Marsh H, Fuentes MMPB, Limpus CJ, Shimada T, Hamann M (2014) Satellite tracking of sympatric marine megafauna can inform the biological basis for species comanagement. PLoS ONE, 9, e98944. doi:http://dx.doi.org/10.1371/journal.pone.0098944 Fuentes MMPB, Cleguer C, Liebsch N, Bedford G, Amber D, Hankin C, McCarthy P, Shimada T, Whap T, Marsh H (2013) Adapting dugong catching techniques to different cultural and environmental settings. Marine Mammal Science, 29, 159-166. doi:http://dx.doi.org/10.1111/j.1748-7692.2011.00531.x. Book Section Shimada T (2013) Green turtles in the waters surrounding Hachijo Island. In: Kameda K (ed) Green Turtle of Japan. Sea Turtle Association of Japan, Okinawa, Japan, pp 93-98 (in Japanese and English).. Conference Presentations Barrios-Garrido H, Espinoza-Rodriguez N, Shimada T, Wildermann N (2015) Body condition index in rescued Green turtles (Chelonia mydas) in the Gulf of Venezuela: a seven year assessment. Poster presentation at the 35th Annual Symposium on Sea Turtle Biology and Conservation, Muğla, Turkey. Shimada T, Kameda K, Aoki S, Kamezaki N (2012) Diet habit of the green turtles Chelonia mydas in Japan as indicated by stable isotope analysis. Oral presentation at the Conference for the Northwest Pacific Green Turtle, Kobe, Japan.. x.
(12) Thesis Abstract. Spatial ecology investigates mechanisms in nature by examining spatial patterns. Developing our knowledge of spatial ecology will improve our approaches to the conservation of threatened species. Our understanding of spatial ecology is limited for marine species such as sea turtles, due to the complexity and methodological challenges involved in the investigation at-sea behaviour. Most sea turtle species are conservation-dependent due to historical and current anthropogenic threats, but a lack of ecological knowledge in the marine environment may hinder or prevent appropriate actions being taken by conservation practitioners. Important knowledge gaps exist in our understanding of spatial and temporal movement of sea turtles in coastal foraging habitats where anthropogenic threats are high. These turtles may be relocated from their home habitats due to injury (e.g. from fisheries and boat strikes), following disasters (e.g. oil spills or extreme weather events), or following habitat loss (e.g. port expansion and dredging); thus, it is critical to understand the degree of fidelity and homing ability of turtles that have been displaced. For instance, if displaced turtles return to an oil spill area too soon after displacement, alternative conservation actions might be required. Additionally, if a turtle returns to its home habitat after displacement, as past studies have indicated, another question arises: how do the navigation mechanisms of sea turtles work? Current hypotheses theorise that sea turtles use geomagnetic cues for long-distance migration, but that they are likely to use non-geomagnetic cues during the last part of their migration. Details of their fine-scale navigation ability and potential cues are lacking. Fidelity to foraging habitat has been indicated by previous studies but key questions remain; (a) What is the extent of sea turtle foraging habitats? (b) How long do they remain in such habitat? and (c) What factors affect their faithfulness to specific foraging habitat? Answering these questions will improve credibility of home range analysis and its applications to conservation planning or evaluation such as determining the effectiveness of Go Slow Zones in Moreton Bay. Moreton Bay is a significant foraging area for green and loggerhead turtles in eastern Australia but the risk of boat strikes is high because of extensive recreational and commercial vessel traffic. Management systems, such as Go Slow Zones, are in place in some shallow areas but vessel collisions still occur more frequently in Moreton Bay than elsewhere along the Queensland coast. Therefore there is a need for assessing whether current regulation is providing adequate protection to sea turtles against vessel collisions in Moreton Bay. My thesis addresses these knowledge gaps and aims to advance our knowledge of ecology and. xi.
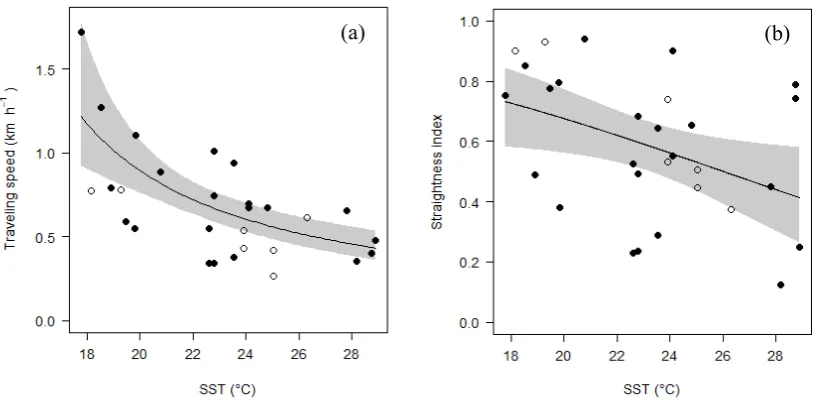
(13) conservation of sea turtles related to their spatial and temporal use of coastal foraging habitats, with particular focus on the Queensland region. Fastloc GPS (FGPS) is a powerful tool for investigation of fine-scale animal spatio-temporal ecology. Satellite-linked FGPS tags provide researchers with almost unlimited temporal and spatial range to monitor animal movements, and give more accurate and larger quantities of locations than earlier methods (e.g. platform transmitter terminals). These large and detailed locational data make understanding certain aspects of turtle ecology possible, whilst also enabling delineation of accurate areas for protection. However, it remains important to identify and remove locations with high error because some location fixes are much less accurate than others. I use FGPS tags as my primary tool to track turtle movements, and therefore need to handle FGPS estimates with high error prior to any ecological and conservation-based analyses. I began by investigating potential methods to screen FGPS data (Chapter 2). Increasing the number of source satellites required for a valid fix is a simple filter method but it comes at the cost of great data loss. Using data sets acquired from loggerhead turtles (Caretta caretta), I explored an alternative filtering approach, based on speed between successive locations, angles created by three consecutive locations, manufacturer's quality index, and number of satellites used for location calculation. The performance of the proposed filter method was evaluated by conducting terrestrial mobile tests. When my filter method was used, the linear error (mean ± SD) of Fastloc GPS data decreased from 2,645.5 ± 29,458.2 m (n = 1,328) to 47.1 ± 61.0 m (n = 1,246) while retaining more than 94% of data. My filter method also led to more accurate home range estimates than the simple filter method. This advance in processing satellite-derived data delivers an improved ability to analyse fine-scale animal movement. I went on to apply the filtering technique to my satellite telemetry data prior to subsequent analyses. In chapter 3, I investigated whether highly mobile sea turtles can be expected to remain at a new location after they were displaced. I addressed this question for sea turtles at foraging grounds along the coast of north-eastern Australia. I analysed 113 tracks comprising four species (Chelonia mydas, Caretta caretta, Lepidochelys olivacea, Eretmochelys imbricate) fitted with satellite-linked devices. Turtles released at their original “home” areas all remained there (n = 54). Among displaced turtles (released away from their original area, n = 59), the large majority travelled back to their respective home areas (n = 52) or near home (n = 4). Homing turtles travelled faster and adopted straighter routes in cooler water, and travelled faster by day than by night. My results showed that displacement up to 117.4 km and captivity up to 514 days did not disrupt homing ability nor did it diminish fidelity to the home area. However, for homing turtles I infer energetic costs and heightened risk in unfamiliar coastal waters. Confirmed homing xii.
(14) suggests that moving individuals away from danger might offer short-term benefit (e.g. rescue from an oil spill) but moving turtles to a new foraging area is unlikely to succeed as a long-term conservation strategy. Priority must rather be placed on protecting their original habitat. As confirmed in Chapter 3 and previous studies, sea turtles have an exceptional ability to navigate accurately between known habitats as well as from unknown areas back to familiar habitat. In Chapter 4, I examined the turning and orientation behaviour of 29 displaced sea turtles of two species (Chelonia mydas, Caretta caretta), tracked en route back to their foraging habitats in eastern Australia. I found that sea turtles tended to alternate stationary and travelling phases during their trip home. Orientation corrections predominantly occurred immediately after a stationary phase and after sunrise. This is the first study to demonstrate time-restricted orientation by sea turtles and provided a new insight into their sophisticated navigational abilities. My remaining data chapters (5, 6) focused on turtles’ behaviour in their foraging habitats, and resultant applications for conservation planning. In Chapter 5, I tracked adult green and loggerhead turtles foraging in the coastal waters of eastern Australia, objectively quantified home range size and site fidelity, and then examined how their spatial selections were affected by ecologically meaningful variables such as season, extreme weather events (tropical cyclones and extreme rainfall), habitat location and sex. Many individual turtles were observed multiple times over extended periods using satellite telemetry (PTT, FGPS or both) and mark-recapture methods. Evidence from these multiple observations inferred that many turtles maintained high fidelity to their coastal foraging habitats for long periods - up to 20 years. Within these longterm foraging habitat areas defined by my analysis, turtles generally shifted their main foraging areas on a seasonal basis. These characteristics of sea turtles emphasise the importance of conserving areas according to their space use, with careful consideration given to identifying temporal trends in habitat selection. I also identified a geographical advantage of two sites in eastern Australia (eastern Moreton Bay and eastern Port Curtis) as foraging habitats for sea turtles with relation to extreme weather events such as tropical cyclones and extreme rainfall. These important foraging habitats would benefit from prioritised conservation planning and management actions. My findings have direct relevance to conservation managers for planning, or revision, of designated conservation habitat such as Marine Protected Areas or restricted area zones, to protect these threatened species from increasing human activities at their foraging habitats in Australia and other regions. Finally, I investigated whether existing Go Slow Zones are providing adequate protection against boat strike for sea turtles foraging in Moreton Bay. To do so, I examined space use of xiii.
(15) green and loggerhead turtles in relation to the Go Slow Zones and water depth (Chapter 6). I found that most of the habitats used by my tracked turtles were in shallow water, and up to 55% of their habitats were included within the Go Slow Zones in eastern Moreton Bay. However, turtles are not protected from vessel collisions in the deeper zones (water depth ≥ 5 m), which lie adjacent to the Go Slow Zones, or in other shallow water zones in Moreton Bay. In particular, little or no protection is given to sea turtles in southern, western and northern Moreton Bay. By designating all shallow areas in Moreton Bay as Go Slow Zones, approximately 50% or more of the Bay’s turtle habitats would become protected from vessel collisions. Additionally, my data indicate that shallow zones plus a 1.2 km, 2.4 km, or 3.6 km buffer would protect ≥80%, ≥90% or ≥95% respectively, of habitats used by both species because they cover the deeper zones adjacent to the shallow zones. The results of this study will be highly informative for conservation managers when revising the current Go Slow Zones for improved management of these threatened sea turtle populations. The advanced technology and analytical tools I adopted in this thesis enabled me to overcome the difficulties associated with investigating sea turtle movements, and consequently to improve our understanding of their relationship with environmental variables. My approach has applications for investigating spatial ecology of other animals, including other populations of sea turtles. I concluded this study by discussing my key findings related to the behaviour of foraging sea turtles, highlighting conservation benefits that can be potentially derived from incorporating ecological knowledge into planning. I also suggest specific priorities for future research to enhance our knowledge of the spatial ecology of sea turtles, and consequently our ability to conserve these threatened marine reptiles which are necessary for healthy ecosystems.. xiv.
(16) Table of Contents. Acknowledgements ...................................................................................................................... iii Statement on the Contribution of Others .......................................................................................v Contribution of Others by Chapter............................................................................................... vi Ethics Statement .......................................................................................................................... vii Outputs Associated with This Thesis ......................................................................................... viii Other Outputs .................................................................................................................................x Thesis Abstract............................................................................................................................. xi Table of Contents .........................................................................................................................xv List of Tables ............................................................................................................................. xix List of Figures ............................................................................................................................ xxi Chapter 1 ........................................................................................................................................1 General Introduction ......................................................................................................................1 1.1 Sea turtles under threat .............................................................................................3 1.2 Challenges in studying foraging turtles and potential solutions ...............................4 1.3 Foraging sea turtles in Queensland, Australia ..........................................................6 1.3.1 Study species ......................................................................................... 6 1.3.2 Distributions .......................................................................................... 7 1.3.3 Diet ........................................................................................................ 7 1.3.4 Foraging range....................................................................................... 7 1.3.5 Seasonal shifts in habitat ....................................................................... 8 1.3.6 Developmental migration ...................................................................... 8 1.3.7 Site fidelity ............................................................................................ 9 1.3.8 Navigation ........................................................................................... 10 1.3.9 Threats and conservation ..................................................................... 11 1.4 Thesis objectives and structure ...............................................................................12 1.4.1 Primary research aim and objectives ................................................... 12 1.4.2 Thesis structure ................................................................................... 12 Chapter 2 ......................................................................................................................................16 Improving data retention and home range estimates by data-driven screening ...........................16 2.1 Introduction ............................................................................................................17 2.2 Materials and Methods ...........................................................................................19 xv.
(17) 2.2.1 Turtle tracking ..................................................................................... 19 2.2.2 Data retrieval and conversion .............................................................. 20 2.2.3 Data screening ..................................................................................... 20 2.2.4 Kernel estimation................................................................................. 22 2.2.5 Terrestrial mobile test .......................................................................... 22 2.2.6 Evaluation of filter performance.......................................................... 23 2.2.7 Home ranges of turtles......................................................................... 24 2.3 Results .................................................................................................................... 24 2.3.1 Filter performance in terrestrial tests ................................................... 24 2.3.2 Data-driven filter ................................................................................. 26 2.3.3 Effect of screening on turtle data ......................................................... 26 2.4 Discussion .............................................................................................................. 29 2.5 Chapter Summary .................................................................................................. 32 Chapter 3 ..................................................................................................................................... 33 Sea turtles return home after intentional displacement from coastal foraging areas ................... 33 3.1 Introduction ............................................................................................................ 34 3.2 Materials and Methods........................................................................................... 36 3.2.1 Study turtles ......................................................................................... 36 3.2.2 Data preparation .................................................................................. 37 3.2.3 Classification of displaced and non-displaced turtles.......................... 37 3.2.4 Detailed analyses for homing turtles ................................................... 39 3.3 Results .................................................................................................................... 42 3.3.1 Outcomes for displaced turtles ............................................................ 42 3.3.2 Outcomes for non-displaced turtles ..................................................... 44 3.3.3 Homing behaviour of displaced turtles ................................................ 44 3.3.4 Day/night movements .......................................................................... 48 3.4 Discussion .............................................................................................................. 50 3.4.1 Confirmation of homing behaviour ..................................................... 50 3.4.2 Potential fitness benefits and costs ...................................................... 50 3.4.3 Factors influencing homing travel ....................................................... 51 3.4.4 Way-finding ability of homing turtles ................................................. 52 3.4.5 Premature disruption of tracking ......................................................... 52 3.4.6 Conservation implications ................................................................... 53 xvi.
(18) 3.5 Chapter Summary ...................................................................................................54 Chapter 4 ......................................................................................................................................55 Stop and go: Sea turtles halt to reassess direction and use sunrise related cues for fine-scale navigation .....................................................................................................................................55 4.1 Introduction ............................................................................................................56 4.2 Materials and Methods ...........................................................................................57 4.2.1 Homing tracks ..................................................................................... 57 4.2.2 General patterns in tracks .................................................................... 57 4.2.3 Directional correction .......................................................................... 59 4.2.4 Temporal patterns in directional corrections ....................................... 60 4.2.5 Statistical methods............................................................................... 60 4.3 Results ....................................................................................................................61 4.3.1 General spatial patterns in tracks......................................................... 61 4.3.2 Directional correction at the movement transitions............................. 64 4.3.3 General temporal patterns in tracks ..................................................... 65 4.3.4 Temporal patterns in directional corrections at the movement transitions ..................................................................................................... 68 4.4 Discussion...............................................................................................................69 4.5 Chapter Summary ...................................................................................................71 Chapter 5 ......................................................................................................................................72 Home range and site fidelity of sea turtles in coastal foraging habitat: incorporating temporal effects for a robust conservation planning ...................................................................................72 5.1 Introduction ............................................................................................................73 5.2 Materials and Methods ...........................................................................................75 5.2.1 Field work ........................................................................................... 75 5.2.2 Data acquisition & preparation............................................................ 76 5.2.3 Definition of home range and site fidelity........................................... 77 5.2.4 Variables potentially affecting home range size and site fidelity........ 78 5.2.5 Statistical methods............................................................................... 80 5.3 Results ....................................................................................................................80 5.3.1 General properties of tracking data, home range and site fidelity ....... 80 5.3.2 Monthly home range size .................................................................... 84. xvii.
(19) 5.4 Discussion .............................................................................................................. 92 5.5 Chapter Summary .................................................................................................. 97 Chapter 6 ..................................................................................................................................... 98 Marine protected areas as sea turtle habitats in Moreton Bay, Australia .................................... 98 6.1 Introduction ............................................................................................................ 99 6.2 Materials and Methods......................................................................................... 102 6.2.1 Study turtles ....................................................................................... 102 6.2.2 Data acquisition and pre-processing .................................................. 103 6.2.3 Spatial analysis .................................................................................. 104 6.3 Results .................................................................................................................. 104 6.4 Discussion ............................................................................................................ 110 6.5 Chapter Summary ................................................................................................ 114 Chapter 7 ................................................................................................................................... 115 General Discussion .................................................................................................................... 115 7.1 Summary of thesis findings ................................................................................. 117 7.1.1 Thesis objective 1 .............................................................................. 117 7.1.2 Thesis objective 2 .............................................................................. 117 7.1.3 Thesis objective 3 .............................................................................. 119 7.2 Synthesis of turtle behaviour ............................................................................... 119 7.2.1 Homing behaviour and navigation .................................................... 120 7.2.2 Site fidelity and seasonal shifts in foraging habitats ......................... 121 7.3 Conservation implications ................................................................................... 122 7.4 Future research ..................................................................................................... 124 7.4.1 Turtle behaviour ................................................................................ 124 7.4.2 The ecosystem which supports sea turtles ......................................... 127 7.5 Concluding remarks ............................................................................................. 128 References ................................................................................................................................. 130 Appendix ................................................................................................................................... 158. xviii.
(20) List of Tables Table 1.1 Current status of studied sea turtles species. ............................................... 11 Table 2.1 Linear differences in meters (mean ± SD, max) between standard GPS locations and screened Fastloc GPS locations (∆loc). The numbers in the brackets are the percentage of each sample size (i.e. number of locations) when compared to that of generic>3 data set. ............................................................. 25 Table 2.2 The remaining number of Fastloc GPS locations after each filter was applied. Only the data acquired during foraging period is shown in this table. The numbers in the brackets are the percentage of each sample size (i.e. number of locations) when compared to that of generic>3 data set from the same turtle. .................................................................................................................. 28 Table 3.1 Data preparation for detailed analyses of homing turtle behaviour: Threshold speed (km h-1) used in the data driven filter. Vmax = maximum swimming speed, Max. Vlp = maximum “loop trip” speed, as defined in Chapter 2. ........................................................................................................................ 40 Table 3.2 Summary statistics for 29 turtles that were included in detailed analyses of homing behaviour. Data values shown as: median (minimum to maximum). For homing segments, sample size (n) is the number of homing tracks. For day/night segments, sample size (n) is the number of daytime and night-time track segments analysed for each species i.e. 22 green turtles and 7 loggerhead turtles. ................................................................................................................ 45 Table 3.3 Detailed analyses for homing turtle tracks: overall movements. Overall travelling speed (TS) and straightness index (SI) modelled with gamma and beta GLMs respectively. Explanatory variables are displacement distance (DD), sea surface temperature (SST), latitude (Lat), species (Sp) as well as TS or SI. p values, AICc, ∆AICc, and AICc model weights (ωi) are provided for each bestranked model. Cm = Chelonia mydas, Cc = Caretta caretta. ............................ 46 Table 3.4 Detailed analyses for homing turtle tracks: day/night movements. Diel travelling speed (DTS) and straightness index (DSI) modelled with gamma and beta GLMMs respectively. Explanatory variables are sea surface temperature (SST), day or night (DN), and species (Sp). p values, AICc, ∆AICc, AICc. xix.
(21) model weights (ωi) are provided for each best-ranked model. Cm = Chelonia mydas, Cc = Caretta caretta. ............................................................................. 49 Table 4.1 Duration and distance moved during each movement period. Data are presented in median with data range in brackets. Beeline distance is a straightline distance from the first and last locations and distance moved is the sum of distance between consecutive locations during each period. Duration was calculated as the time from the first and last locations during each movement state. N is the number of each period observed.................................................. 63 Table 5.1 Summary of satellite telemetry on green turtles (Cm) and loggerhead turtles (Cc) in north-eastern Australia. F = female, M = male. N is number of tracked turtles. Data are presented in median with minimum and maximum values in parentheses. ........................................................................................................ 76 Table 5.2 Monthly statistics on green turtles (Cm) and loggerhead turtles (Cc) tracked in north-eastern Australia. See Figure 5.1 for study locations. F = female, M = male. Data are presented in median with minimum and maximum values in parentheses. ........................................................................................................ 81 Table 5.3 Effects of environmental and biological variables on monthly home range size (mHR) of green turtles (Cm) and loggerhead turtles (Cc). See Figure 5.1 for study locations. F = female, M = male. All data subsets include fixes acquired during “affected months” and “normal months” (weather). f(SST) indicates SST was allowed to have a nonlinear effect. ............................................................. 84 Table 5.4 Effects of environmental and biological variables on site fidelity (MISE) of green turtles (Cm) and loggerhead turtles (Cc). See Figure 5.1 for study locations. F = female, M = male. All data subsets include fixes acquired during “affected months” and “normal months” (weather). f(ΔSST) indicates ΔSST was allowed to have a nonlinear effect. ............................................................. 88 Table 6.1 Seasonal habitat areas of green turtles (Cm) and loggerhead turtles (Cc) in eastern, southern, northern and western Moreton Bay. N is the number of turtles used to estimate the habitat areas. .................................................................... 105. xx.
(22) List of Figures Figure 1.1 Pictures of study turtle species: (a) green turtle, (b) loggerhead turtle, (c) olive ridley turtle, (d) hawksbill turtle. ................................................................ 6 Figure 1.2 Migration route taken by a female green turtle from her foraging habitat in Moreton Bay to her nesting habitat in southern Great Barrier Reef (Limpus, unpublished data). .............................................................................................. 10 Figure 1.3 Schematic diagram of thesis structure. ...................................................... 15 Figure 2.1 An example of errors, suspect locations and a loop trip in a data set (a) after screening using the generic>3 filter (i.e. requiring >3 source satellites), (b) after removing locations that were preceded and followed by unrealistically fast speeds, and (c) after screening using the data-driven>3 filter (see ‘2.2.3 Data screening’). ........................................................................................................ 21 Figure 2.2 Mean integrated squared error (MISE) of kernel estimates derived from the Fastloc GPS locations in the terrestrial mobile test. The Fastloc GPS data were screened by the data-driven filter (DD>3) and the generic filters that limited the use of locations by requiring the number of source satellites to be more than 3 (Gen>3), 4 (Gen>4), 5 (Gen>5), 6 (Gen>6), and 7 (Gen>7). ............................ 25 Figure 2.3 Density contours of home range estimates for T53800 and T93038 during foraging period. Data were screened by the data-driven filter (data-driven>3) and the generic filters that limited the use of locations by requiring the number of source satellites to be more than 3 (generic>3), 4 (generic>4), 5 (generic>5), 6 (generic>6), and 7 (generic>7). Lines represent 95, 75, 50% volume contours of the home range estimate. Dots are Fastloc GPS locations............................. 27 Figure 3.1 Release sites of study turtles were dispersed widely along the coast of Queensland, Australia. ....................................................................................... 36 Figure 3.2 At site 1 (see Figure 3.1) a loggerhead turtle T53800 was tracked twice. (a) On the first occasion in 1998 the turtle was not displaced. After release it remained in its original foraging area. (b) On the second occasion in 2010 the turtle was displaced by 18.3 km from its capture location. It travelled back to its original area, thus was regarded as a homing turtle. Square = capture location, triangle = release location, cross-hatched polygon = resettlement area. Grey line xxi.
(23) is the travelling path after displacement. Empty circle = location of relatively low residency, filled circle = location of relatively high residency. .................. 39 Figure 3.3 Representative tracks of turtles after displacement: square = capture location, triangle = release location, grey line = travelling path, grey filled polygon = resettlement area. (a, b) At Site 1 these green turtles were displaced and returned to their areas of capture. (c) At Site 2 this olive ridley turtle was found debilitated and displaced after rehabilitation. The turtle moved toward its capture area but its resettlement area did not include the capture location. (c) At Site 5 this green turtle was displaced and resettled away from its capture location. .............................................................................................................. 43 Figure 3.4 (a) Travelling speed and (b) straightness index for tracks of homing turtles that were released at various sea surface temperatures (SST): green turtles = filled circle, loggerhead turtles = empty circle. The solid line is model fit, grey band denotes 95% confidence interval. .............................................................. 48 Figure 3.5 Estimated travelling speed of homing turtles by day and by night. Filled circle is model fit, error bars denote 95% confidence interval........................... 49 Figure 4.1 Homing tracks of (a) green turtle K92598 and (b) loggerhead turtle T53800 following displacement: triangle = release point, empty circle = travelling state, filled circle = stationary state, square = end point. Successive locations are connected by grey lines. ..................................................................................... 58 Figure 4.2 Schematic diagrams for (a) absolute turning angle θ𝑡𝑡𝑡𝑡𝑡𝑡𝑡𝑡 at a transition between stationary and travelling states and (b) deviation from end point. following two examining points, θ∆𝑖𝑖and θ𝑖𝑖 + 1. Triangle = release point, empty. circle = travelling state, filled circle = stationary state, square = end point. Successive locations are connected by grey lines. Dashed arrow = actual. heading between two successive points, dashed line = direct path to the end point. .................................................................................................................. 59 Figure 4.3 Absolute deviation between initial headings and bearings to end points for the displaced (a) green turtles and (b) loggerhead turtles. Initial heading is the bearing from the release location to the first satellite fix. .................................. 62 Figure 4.4 Absolute turning angles at the transitions between stationary and travelling periods (transition) and during travelling period (travelling): (a) green turtles xxii.
(24) and (b) loggerhead turtles. The whiskers extend to the most extreme data point. .................................................................................................................. 64 Figure 4.5 Probability distribution of corrections (a, c) during travelling periods, and (b, d) at the transition between stationary and travelling states. Dashed line = no correction. (a, b) green turtles, (c, d) loggerhead turtles. ................................... 65 Figure 4.6 Frequency distributions of locations identified as (a, c) travelling state or (b, d) stationary state across a day. (a, b) green turtles, (c, d) loggerhead turtles. ................................................................................................................ 66 Figure 4.7 Frequency distributions of (a, c) the last and (b, d) the first locations during stationary period through a day. The former represents turtles’ transition timing from travelling state to stationary state, and the latter represents the transition timing from stationary state to travelling state. (a, b) green turtles, (c, d) loggerhead turtles............................................................................................... 67 Figure 4.8 Estimated corrections made by (a) green and (b) loggerhead turtles at the transitions between stationary and travelling periods during different time of day; early morning (sunrise ± 2hrs), daytime (after early morning, before sunset) and night-time (after sunset, before early morning). Filled circle = model fit, empty circle = mean, error bars = 95% confidence interval, n =number of locations, dashed line = no correction. ........................................... 68 Figure 5.1 Study locations in Queensland, Australia. MB = Moreton Bay, SS = Sandy Strait, PC = Port Curtis, SB = Shoalwater Bay, TS = Torres Strait. .................. 75 Figure 5.2 Schematic diagram of time frame in relation to the series of extreme weather events occurred in Moreton Bay (shaded in grey). Solid line encloses the “affected months” when the extreme weather events occurred and the following 12 months. Dotted lines enclose the “normal months” before and after the “affected months”. ....................................................................................... 79 Figure 5.3 Absolute difference in SST (∆SST) between any pairs of UDs estimated in different habitat locations. See Figure 5.1 for study locations. Dots are ANOVA model fits with error bars denoting 95% confidence intervals. ......................... 82 Figure 5.4 Yearly home ranges of sea turtles which were tracked for more than one year. Coloured polygons are home ranges in different years of each turtle and black dots are high-quality Argos fixes (LC 3, 2, 1). Home ranges were xxiii.
(25) estimated using the location fixes acquired during the periods shown in the legend with the number of fixes presented in brackets. (a) female green turtle K55740 in Shoalwater Bay, (b) female green turtle QA23117 in Sandy Strait, (c) female green turtle QA23188 in Sandy Strait, (d) female loggerhead turtle QA34297 in Moreton Bay, (e) female loggerhead turtle T14914 in Moreton Bay, (f) female loggerhead turtle T23158 in Moreton Bay, (g) female loggerhead turtle T29282 in Moreton Bay, (h) female loggerhead turtle T93038 in Moreton Bay, (i) male loggerhead turtle T53800 in Moreton Bay. .................................. 83 Figure 5.5 Geographical differences in home range size of adult female green turtles in north-eastern Australia. See Figure 5.1 for study locations. Dots are GAMM model fits with error bars denoting 95% confidence intervals........................... 85 Figure 5.6 Estimated effects of SST on monthly home range size of (a) adult female and male green turtles in Moreton Bay, (b) adult female green turtles in Sandy Strait, (c) adult female and male green turtles in Port Curtis, (d) adult female green turtles in Shoalwater Bay, (e) adult female green turtles in Torres Strait, and (f) adult female and male loggerhead turtles in Moreton Bay. Dots are predicted values for each observation. For significant relationship as shown in Table 5.2, GAMM model fit (solid line) is also presented with 95% confidence interval (grey band). ........................................................................................... 86 Figure 5.7 Estimated home range size of adult female green turtles in Sandy Strait in each month of year. Solid line is GAMM model fit with grey band denoting 95% confidence interval. Dots are predicted values for each observation. ........ 86 Figure 5.8 Estimated effects of SST on site fidelity by (a) adult female and male green turtles in Moreton Bay, (b) adult female green turtles in Sandy Strait, (c) adult female and male green turtles in Port Curtis, (d) adult female green turtles in Shoalwater Bay, (e) adult female green turtles in Torres Strait, and (f) adult female and male loggerhead turtles in Moreton Bay. MISE is the differences between each combination of UDs (a smaller MISE value indicate similar home ranges). ∆SST is the absolute difference in SST between each combination of UDs. Dots are predicted values for each observation. For significant relationship as shown in Table 5.4, GAMM model fits (solid line) are also presented with 95% confidence intervals (grey band). ...................................... 90 Figure 5.9 Chronological shift in habitat from summer months (a) by adult green turtles in Moreton Bay green, Sandy Strait red, Shoalwater Bay blue and (b) by xxiv.
(26) adult loggerhead turtles in Moreton Bay. MISE is the differences between each combination of UDs (a smaller MISE value indicate similar home ranges). Solid lines are GAMM model fits with grey bands denoting 95% confidence intervals. Dots are predicted values for each observation. ................................................ 91 Figure 5.10 Seasonal home range of (a) a female green turtle T5561 in Moreton Bay, (b) a female green turtle QA23117 in Sandy Strait, (c) a female green turtle K55740 in Shoalwater Bay, and (d) female loggerhead turtle T14914 in Moreton Bay. Coloured polygons represent summer (red), autumn (yellow), winter (blue), and spring (green) from each year. Water depth zones at mean sea level are shown by grey gradient: >0 - 25 m (light grey), >25 - 50 m (grey) and >50 m (dark grey). ............................................................................................. 92 Figure 6.1 Release locations of green turtles (Moreton Bay) and loggerhead turtles (Moreton Bay and Mon Repos). All tracked turtles settled in Moreton Bay. .. 100 Figure 6.2 Capture locations of (a) green turtles and (b) loggerhead turtles in Moreton Bay. Most turtles (n = 32) were captured in northern (purple circle), eastern (blue circle) and southern (green circle) Moreton Bay during this study. Other female loggerhead turtles (n = 6) were captured and release at their nesting habitat in Mon Repos during this study but five were previously captured at their foraging habitat in eastern Moreton Bay (blue triangle) prior to this study. Red hatched polygons denote the Go Slow Zones for turtles and dugongs. .... 101 Figure 6.3 Foraging habitats (95% UDs) of (a) green turtles and (b) loggerhead turtles in Moreton Bay, tracked in the east blue, the south green, the west brown and the north purple. Red hatched polygons denote the Go Slow Zones for turtles and dugongs. .................................................................................................... 106 Figure 6.4 Depth zone at turtle habitats within the Go Slow Zones black and outside the Go Slow Zones grey in Moreton Bay: (a) green turtles in the east, (b) green turtles in the south, (c) green turtles in the north, (d) loggerhead turtles in the east, (e) loggerhead turtles in the south, (f) loggerhead turtles in the west...... 107 Figure 6.5 Frequency distribution of distance between each grid cell of turtle habitats in deeper zones (>5 m) and the nearest shallow zone (≤5 m) in (a) green turtles and (b) loggerhead turtles. ............................................................................... 108. xxv.
(27) Figure 6.6 Proportion of home ranges within the Go Slow Zones (circles) and shallow zone (depth ≤ 5 m) with buffers ranging from 0 to 7.1 km (lines): (a) green turtles, (b) loggerhead turtles. Symbols are colour coded for different areas of Moreton Bay: east blue, south green, west brown, and north purple............... 109 Figure 6.7 Foraging habitats (95% UDs) of (a) green turtles and (b) loggerhead turtles tracked in Moreton Bay, with relation to the shallow zones with buffer widths ranging from 0 km lightest yellow to 8 km darkest red. Contours are colour coded by turtles tracked in different areas of Moreton Bay: east blue, south green, west brown, and north purple. ............................................................... 109. xxvi.
(28) Chapter 1 General Introduction. “The world is unavoidably spatial, and each organism is a discrete entity that exists and interacts only within its immediate neighbourhood.” - Tilman and Kareiva (1997). 1.
(29) Globally, the state of marine ecosystems has been affected by rapid growing human populations, especially in coastal areas (Jackson et al. 2001, Valiela et al. 2001, Millennium Ecosystem Assessment 2005, UNEP 2006, Halpern et al. 2008). One of the key components of coastal ecosystems is marine megafauna, such as marine mammals, seabirds and sea turtles. These marine wildlife groups often occur across large spatial areas and have significant roles for both marine ecosystems and human communities and cultures (Bjorndal and Jackson 2003, Campbell 2003). Conserving these species can be an effective approach for ocean conservation planning, because by conserving marine megafauna additional conservation benefits will be provided to other animals within their habitats, and in addition, marine megafauna often receive and generate significant public and political attention (Hooker and Gerber 2004, Frazier 2005). Sea turtles are often referred to as charismatic marine wildlife. Each of the species show similar life history and reproductive patterns (Buskirk and Crowder 1994), and being long-lived latematuring iteroparous animals, survivorship of large juveniles and adults greatly determines their reproductive fitness (Crouse et al. 1987, Heppell 1998). Many large juveniles and adult Cheloniidae (hard-shelled sea turtles) spend the majority of their life in coastal foraging habitat where anthropogenic threats are likely (Lutcavage et al. 1997). Yet, it is in the marine environment that we know the least about them. Therefore understanding the biology of, and conserving, foraging sea turtles, in particular large juveniles and adults, is vital for their conservation. The process of conservation management requires comprehensive ecological knowledge (Kareiva et al. 2007, Barbier et al. 2008). Since spatial interactions between organisms and their neighbouring environments are the fundamental function of nature, it is critical to consider the potential influence of space use by animals, to fully understand mechanisms of nature (Tilman and Kareiva 1997). A key knowledge gap for highly mobile sea turtles is an understanding of the relationships between species, their habitats and their threats (Hamann et al. 2010). My thesis addresses the spatial aspect of in-water sea turtle ecology, with particular focus on large juveniles and adult Cheloniidae, and considers its applications for conservation planning.. 2.
(30) Chapter 1: General Introduction. 1.1 Sea turtles under threat Numerous anthropogenic activities are impacting sea turtles worldwide. Fisheries bycatch can cause death or severe injuries to sea turtles, or damage their habitats (Poiner and Harris 1996, Robins and Mayer 1998, Lewison et al. 2004, Peckham et al. 2007, Gilman et al. 2010). Coastal development such as dredging, coupled with the expansion or modification of coastal land may cause habitat loss (Eckert and Honebrink 1992). Collisions between turtles and vessels occur most often in coastal shallow waters which are heavily used by commercial and recreational vessels (Lutcavage et al. 1997, Hazel and Gyuris 2006, Limpus 2008). Oil spills (e.g. the Gulf of Mexico Deepwater Horizon accident) and other pollutants may greatly increase mortality of sea turtles (Swarthout et al. 2010, van de Merwe et al. 2010, Antonio et al. 2011, Komoroske et al. 2011, Stewart et al. 2011). These anthropogenic threats are serious issues for sea turtle conservation because many sea turtle populations are still recovering from past exploitation by humans such as harvest for their meat, eggs and carapace shells (Bjorndal and Jackson 2003, Campbell 2003). One of used conservation approach is to enforce Marine Protected Areas (MPAs) to protect marine resources, including sea turtles, from known or potential anthropogenic threats (Hooker and Gerber 2004, Fernandes et al. 2005, Gaines et al. 2010). Levels of protection vary among MPAs. Some MPAs restrict human activities by setting limits for takes or boat operation while others provide more comprehensive protection with turtles protected from capture except for specifically permitted operations such as research and conservation activities (e.g. Queensland Government 1992, Pauly et al. 2002). MPAs can provide the comprehensive protection required to conserve marine resources as long as the designated areas cover important habitats of targeted marine resources (Pressey et al. 2007, Agardy et al. 2011). However, knowledge of habitat coverage is not always available to conservation initiatives. In many cases, MPAs have been established without prior study of their conservation target, and consequently adequate protection could not be provided (e.g. RojasBracho et al. 2006, Schofield et al. 2013b, Cleguer et al. 2015). Even for MPAs like the Great Barrier Reef Marine Park, the protection of larger mobile species is challenging (Dobbs et al. 2008, Dryden et al. 2008). MPA effectiveness could be improved with a more comprehensive understanding of the spatial ecology of key species and the spatial extent of their threats. While MPAs form one component of protecting animals in situ, in cases when animals become debilitated (e.g. vessel collisions), or threats exist in their habitat (e.g. oil spills), animals must. 3.
(31) be removed from their original habitat to help them regain health or protect them from threats to their health. Rescued turtles are usually taken to rehabilitation centres which are often distant from their original habitat. For logistical and financial reasons, rescued turtles may not be released back into their original habitat. The consequences of such displacement has not been well investigated.. 1.2 Challenges in studying foraging turtles and potential solutions Sea turtles spend most of their life at-sea, in foraging habitats (Bolten 2003), where they are challenging to study because they are almost always under water, except for occasional surfacing for breathing (Lutcavage and Lutz 1997). In addition, foraging sea turtles can move long distances, particularly juveniles of some populations (Musick and Limpus 1997, Morreale and Standora 2005, Mansfield et al. 2009, Narazaki et al. 2015), and can also reside in areas with poor water clarity (Limpus et al. 2005). These behaviours have made it difficult for researchers to monitor the movements and habitat use of foraging sea turtles. Consequently, the foraging phase of sea turtles, in particular that of adults, has been less well-studied compared to other stages of their life cycle - such as the nesting and hatching stages (Hamann et al. 2010). Key knowledge gaps include habitat size, degree of site fidelity, navigational mechanisms, factors affecting sea turtle in-water behaviour, and application of ecological knowledge into conservation management (Hays 2008, Hamann et al. 2010). Many of the key knowledge gaps related to foraging sea turtles can be addressed by investigating their fine-scale movement and their habitat use in relation to threats. Sea turtle researchers have traditionally adopted flipper-tags to study the movement of sea turtles, and have found evidence of long-distance migration and site fidelity, by both breeding and foraging sea turtles (e.g. Miller et al. 1998, van Dam and Diez 1998). However, only a snapshot of turtle movement can be obtained using the tagging technique because it can only provide the release and capture locations of each individual, and the time frames between tagging and recapture can span years, or even decades (Limpus et al. 1992, Godley et al. 2003). Since the 1960s, researchers have developed other techniques to track turtles, such as weather balloons to follow inter-nesting turtles (Carr 1967, Davis 2007), and more recently acoustic and radio telemetry to follow inter-nesting and/or foraging turtles (Kemmerer et al. 1983, Tucker et al. 1996, Whiting and Miller 1998, Seminoff et al. 2002, Avens et al. 2003, Makowski et al. 2006, Hazel et al. 2013). While these methods have potential advantages and have revealed turtle movements within small areas, their range of signal transmission is limited, which restricts the usefulness of. 4.
(32) Chapter 1: General Introduction. these techniques in studying turtle movement because turtles can often move beyond their transmission range (Avens et al. 2003, Hazel et al. 2013). Satellite telemetry has substantially improved animal tracking by providing full-time global coverage (Hazen et al. 2012). Since the early 1980s, platform terminal transmitters (PTTs) have allowed fairly crude tracking of animals, including sea turtles, using the Argos satellite system (Gillespie 2001, Godley et al. 2008). A PTT may be suitable to track long-distance movements of breeding and foraging turtles (e.g. Keinath and Musick 1993, Limpus and Limpus 2001, Hays et al. 2004, Shaver et al. 2005, Shaver and Rubio 2008, Bailey et al. 2012), but because the accuracy of the locations is low, it rarely allows fine-scale analysis of movements (Hays et al. 2001). However, the latter analysis is often required for studies on sea turtle populations that utilise coastal foraging habitat within a small area. In the early 2000s, Fastloc GPS (FGPS) emerged as a system for obtaining detailed positional information using the GPS satellite system (Bryant 2007, Rutz and Hays 2009, Wildtrack Telemetry Systems Limited 2010). By linking a FGPS receiver with a PTT, detailed positional data can now be remotely relayed, allowing travel routes and space use to be accurately measured over extended spatial and temporal scales (Schofield et al. 2013b, Hays et al. 2014c). Similarly, advances in analytical methods, and computer hardware/software to execute these analyses have allowed researchers to filter and process large datasets (e.g. Hoenner et al. 2012, Jonsen et al. 2013) and to undertake complex spatial and/or statistical analyses (e.g. Jonsen et al. 2005, Barraquand and Benhamou 2008, Bestley et al. 2014). By combining satellite telemetry data with contemporary analytical techniques, it is now possible to examine fine-scale animal movement and habitat use data to explore questions about the spatial ecology of foraging sea turtles. However, a challenge remains. While most location estimates obtained by FGPS tags are highly accurate, FGPS data sets often contain location estimates with a high degree of error (Hazel 2009). Inaccurate estimates lead to unreliable results and inferences. So there is a need for objective methods for screening FGPS data, which I have identified as the first objective of my thesis. Once this issue is solved, fine-scale analysis can be achieved with high confidence.. 5.
(33) 1.3 Foraging sea turtles in Queensland, Australia I will now provide a brief overview of foraging sea turtles with particular focus on the populations in Queensland waters. I consider this background information necessary for readers to follow the remainder of my thesis. I also highlight important knowledge gaps, which lead to the other objectives of my thesis.. 1.3.1 Study species Six of the seven species of marine turtle forage in Australian waters (Limpus 1995). In this thesis, I investigated the spatial ecology of green turtles (Chelonia mydas), loggerhead turtles (Caretta caretta), olive ridley turtles (Lepidochelys olivacea), and hawksbill turtle (Eretmochelys imbricata) in their coastal foraging habitat in Queensland, Australia (Figure 1.1).. (a). (b). (c). (d). Figure 1.1 Pictures of study turtle species: (a) green turtle, (b) loggerhead turtle, (c) olive ridley turtle, (d) hawksbill turtle.. 6.
(34) Chapter 1: General Introduction. 1.3.2 Distributions Green and loggerhead turtles are the most common species of the shallow coastal waters found in the temperate to tropical eastern Australia (Limpus 2008). Olive ridley turtles have a similar latitudinal range to green and loggerhead turtles but they use deeper waters, and are not generally associated with inter-tidal habitats or shallow reef environments (Limpus 2008). Hawksbill turtles are typically found in tropical reef areas, but some appear to feed in shallow coastal seagrass habitats where green and loggerhead turtles also forage (Limpus and Miller 2008).. 1.3.3 Diet Green turtles residing in the coastal habitats of Queensland are predominantly herbivorous. Their main diet depends on the location of foraging habitat and the presence/absence of seagrass. In general, it appears that if seagrass is available it will form the major component of green turtle diet. In the absence of seagrass, macroalgae is the dominant diet component (Fuentes et al. 2006, Arthur et al. 2008b, Limpus 2008). Mangrove fruits and leaves can be consumed but are not believed to be common diet items in most regions, although this warrants further research attention (Limpus and Limpus 2000). Some green turtles may feed on gelatinous prey when opportunity arises (Arthur et al. 2007, Limpus 2008). Loggerhead turtles are carnivorous, mainly feeding on benthic invertebrates and less frequently on gelatinous prey (Limpus et al. 2001). Olive ridley turtles are also carnivorous, feeding on benthic invertebrates (Limpus 2008). Hawksbill turtles feed primarily on sponges and macroalgae, and also on seagrass in some regions (Meylan 1988, Whiting 2004, Bell 2013).. 1.3.4 Foraging range The size range of foraging areas for green turtles has not been well quantified in most foraging habitats in Queensland, with the exception of a limited numbers of turtles and areas in Moreton Bay, Shoalwater Bay, Low Isles and Torres Strait. These green turtles generally used habitat less than 17 km2 but showed high individual variation, with some turtles using areas as large as 750 km2 (Whiting and Miller 1998, Hazel 2009, Hazel et al. 2013, Gredzens et al. 2014). The size of foraging habitat has not been quantified for loggerhead turtles in Queensland waters. However, turtles foraging in the southern Great Barrier Reef (GBR) were shown to move at least 10 km using mark-recapture data (Limpus 1985), and turtles foraging in Moreton Bay were shown to move around 21 km using low resolution satellite telemetry (Limpus and Limpus. 7.
(35) 2001). The size range of foraging habitat has not been quantified for olive ridley and hawksbill turtles in Queensland waters and studies are rare Australia wide (Hoenner et al. 2015). Our knowledge of home range size for sea turtles is clearly incomplete along the Queensland coast, especially for turtles in the shallow coastal habitats where anthropogenic influences are high, requiring conservation measures with careful design, such as Moreton bay near Brisbane and Port Curtis in Gladstone.. 1.3.5 Seasonal shifts in habitat In Queensland, no studies on foraging sea turtles have shown changes in behaviour in response to water temperature or season. Moreton Bay is the southern-most foraging habitat for sea turtles in Queensland and sea surface temperature (SST) can drop below 15 °C. However, even at those temperatures turtles appear to continue foraging (Read et al. 1996). In contrast, sea turtles in the western North Atlantic, western North Pacific and Mediterranean appear to respond to cold water either by shifting their habitat to warmer waters in lower latitude or deeper offshore waters (Mendonca 1983, Morreale and Standora 2005, Mansfield et al. 2009, Narazaki et al. 2015), or becoming dormant (Carr et al. 1980, Hochscheid et al. 2005). Read et al. (1996) hypothesised that sea turtles in Queensland water may be more tolerant of cold water than other populations of sea turtles. This could also be reflected in the absence of cold-stunned sea turtles in eastern Australia compared to high numbers recorded off the East coast of the USA.. 1.3.6 Developmental migration Based on the size distribution of hawksbill turtles along the Queensland coast, Limpus (1992) hypothesised that hawksbill turtles may shift their foraging habitats from temperate or subtropical waters to warmer tropical waters as they grow. However, despite extensive markrecapture research on tens of thousands of turtles, there is little evidence to suggest developmental shifts in habitat by any species of sea turtle foraging along the Queensland coast (Limpus and Limpus 2003a, Limpus 2008, Limpus and Miller 2008). Instead, the available data from Queensland suggests that turtles show long-term fidelity to particular sites. This absence of seasonal and developmental migration is in strong contrast with that observed in sea turtles from several other regions. Ontogenetic shifts in habitat are common in green turtles in the western North Atlantic, as indicated by studies of size distribution (Mendonca and Ehrhart 1982, Bjorndal and Bolten 1988, Epperly et al. 1995, Meylan et al. 2011), markrecapture (Bjorndal and Bolten 1995, Moncada et al. 2006) and genetic analysis (Lahanas et al. 8.
Figure


+7


Related documents
Outlook for the Intercity Bus Industry report draws attention to some of the industry’s changing fundamentals while also looking at notable developments anticipated this year
whether hatchlings can use ocean sounds during seafinding, I measured the behavioral responses of hatchling loggerhead sea turtles (Caretta caretta) collected from nesting beaches
Abstract.—We analyzed relative abundance of nesting Olive Ridley Turtles, Lepidochelys olivacea, on El Naranjo beach, Mexico during 1993–2010, as well as seasonal and spatial
4: las dos cabeceras de la cárcava indicada tienen un origen artificial, ya que se inician en sendas convexidades laterales de la vertiente, donde el flujo natural tendería
Therefore, the present study evaluates the relationship between sleep quality and the motivation and maintenance stages of healthy behavioral changes, according to the
In our hands-on SAN backup testing, the Symantec NetBackup Integrated Appliance running NetBackup 7.6 offered application protection to 1,000 VMs in 66.8 percent less time
• Set a time limit for the meeting and make sure members know at the start when the meeting will finish - no-one likes meetings which go on for hours • Ensure the meeting keeps
1) While firms may target 205, 185 or figures as modest as 100 square feet per worker, only a firm with an extremely stable worker base, a significant portion of remote flexible
