March 2016
Transforming rehabilitation?
Prison education:
Analysis and options
Nikki Stickland
EDUCATION
Published March 2016 Education Policy Institute
This work is licensed under a Creative Commons Attribution-NonCommercial-ShareAlike 4.0 International License. For more information visit creativecommons.org
About the author
Nikki Stickland is a Research Officer at the Education Policy Institute. She graduated from the University of Oxford in 2011 with a degree in History and Politics, and from the London School of Economics in 2013 with an MSc in Human Rights. Her publications for EPI include EPI’s Submission to the Smith Commission with Toby Fenwick, ‘Schools Plus: education at the heart of communities’ with Ben Nicholls, and ‘The ECI in Action: Austria and the UK’ with Tamara Ehs.
Acknowledgements
The author would like to thank the many stakeholders, academics and policy makers who contributed their time and expertise to informing and shaping the research for this report.
Particular thanks go to all those who contributed to the expert roundtable held at EPI in December 2015; to Drs Ruth Armstrong and Amy Ludlow for allowing this researcher to observe a ‘Learning Together’ class at HMP Grendon; and to Sally Benton and Josh Coleman at Nacro, Stephen Evans at the Learning and Work Institute and Dr Gerry Czerniawski at the University of East London for their insightful comments on various drafts. Finally, to Chris Thoung for his invaluable help with analysis.
At EPI, the author would particularly like to thank David Laws for his guidance in shaping the report, and Emily Frith for her tireless advice and editing support.
Contents
Executive Summary
4
Introduction
6
The purpose of prison education
8
Section 1: The current state of the prison education system
10
Section 2: Options and issues
22
Conclusion
39
Executive Summary
Given the role that education can play in enabling rehabilitation of prisoners, EPI’s starting point for this report was to investigate how much the promised “rehabilitation revolution” has materialised in this important aspect of the prison regime.
To analyse the performance of prison education since 2010, EPI developed a scorecard which assessed three key performance measures:
1. Access to and participation in education 2. Learning outcomes achieved
3. Quality of education.
Our analysis (presented in Section One) found that overall performance for all three measures has declined or stagnated in recent years. For certain indicators, including the achievement of higher level qualifications and the quality of education provision, performance had deteriorated substantially. There is no sign of a “rehabilitation revolution” if access to and quality of education is measured.
Access and participation
For prisoners’ access to education, EPI looked at a proxy measure of time out of cell, which showed little improvement in access to education and purposeful activity.1 There has been little change in
the percentage of prisoners spending 10 or more hours out of cell and in 2014/15 substantially more prisoners spent less than two hours out of cell than those who were unlocked for over 10 hours. This indicates that prisoners do not always have sufficient time in which they are able to access education and work, and this has remained unchanged in recent years.
For an approximate indication of how many prisoners are participating in education, researchers looked also at Her Majesty’s Inspectorate of Prisons (HMIP) survey data on how many prisoners said that they were involved in education, including basic skills. This showed a slight decline over the period 2008 to 2015.
In addition, analysis of Skills Funding Agency data shows that those who are participating in education are doing so increasingly at lower levels, and there has only been a small increase in the numbers participating in English and Maths learning below Level 2. The numbers studying for Level 3 qualifications have fallen by nearly two-thirds between 2011/12 and 2014/15, though there has been an increase in those studying for partial and full Level 2 qualifications.2
Outcomes
While the absolute numbers participating in below Level 2 education, including English and Maths, have increased, the achievement of accredited qualifications in English and Maths has actually fallen by 10 per cent between 2011/12 and 2014/15. There has been an increase in Level 2 and especially full Level 2 outcomes achieved, though Level 3 qualification outcomes have fallen by 83 per cent since 2011/12.
1 Figures for Time Out of Cell and Involvement in Education have been taken from the survey data contained in Annual Reports of Her Majesty’s
Inspectorate of Prisons. This therefore represents a small sample of the prison population, and is approximated to the nearest full figure. They are also figures as self-reported by prisoners, and so can more accurately be seen as a measures of prisoner perceptions/satisfaction rather than harder metrics.
2 A full Level 2 achievement is equivalent to 5 or more GCSEs at grade A* to C. A full Level 3 achievement is equivalent to 2 or more A-levels. See
Quality
There has been a significant decline in the quality of education offered, as rated by Ofsted, with a striking increase in the percentage of prisons graded as Requires Improvement or Inadequate since 2011/12. Nearly three-quarters of prisons were deemed to be in this category in 2014/15, the worst result since 2009/10.
EPI has produced a number of recommendations to improve prison education. A top priority should be the collection of sufficient data to enable the system’s performance to be monitored at a national level, as a major finding of this study has been the extent to which performance data collected for this sector is either inadequate or unreliable. This is particularly important if the Government plans to grant greater autonomy to individual prison governors: international best practice is for greater autonomy to be married to strong accountability.
The main recommendations for reform, discussed in detail in Section Two of the report, are as follows:
1. Each prison should collect a minimum data set of rehabilitation outcomes for education and employment, including employment and learning status on release and six months after, and these should be published and collated nationally to support performance management and quality improvement.
2. To improve performance, prison governors should be made responsible for education provision in their prisons, and for the achievement of these rehabilitation outcomes.
3. There should be clear entitlements for prisoners and access to education should be prioritised. As part of governor autonomy, more flexibility should be built into the system, to enable prisoners to pursue higher level qualifications where this is clearly linked with improved employment outcomes.
4. Inspection regimes should also be more stringent, with education a limiting factor for overall prison ratings, and a rigorous special measures regime could be put in place for failing prisons. 5. Greater focus should be placed on the needs of particular cohorts of prisoners, emphasising
the link with employment. In particular, consideration should be given to a distinct offer for prisoners aged 18-21.
Introduction
Policy context
The prison education system in England has been subjected to a high degree of change and reorganisation in recent years. The Coalition Government from 2010-2015 pursued a ‘Transforming Rehabilitation’3 agenda in an attempt to address stubbornly high reoffending rates. A joint review
of offender learning launched in July 20104 saw a redesign of outcome targets and funding
arrangements for the fourth round of the Offender Learning and Skills Service (OLASS) contracts. These came into effect in August 2012. The Government also rolled out a ‘Virtual Campus’ designed to broaden the range of employment and learning services available in custody.
In spite of these initiatives, educational outcomes for prisoners remain poor and in many respects are declining. There has also been little change in reoffending rates. From the latest figures published in January 2016, the reoffending rate for adult offenders released from prison in 2013/14 was 45.8 per cent.5 This is very similar to the rate for summer 2010/11, which was 46.9 per cent.6
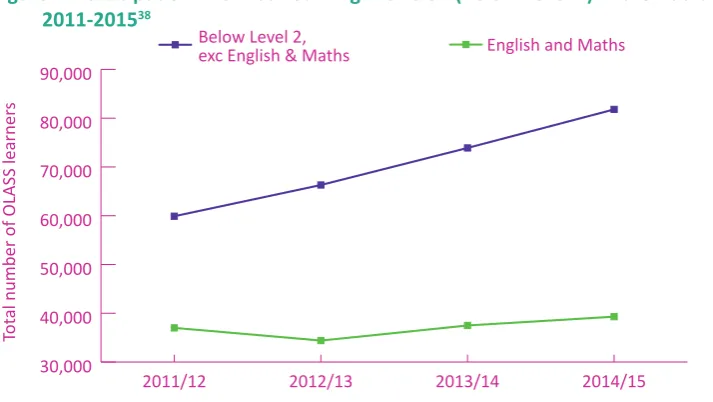
[image:6.595.92.513.421.651.2]In education there is some evidence of innovation and improved outcomes, particularly in the women’s estate, but the overall performance of prison education remains well behind the targets and outcomes expected. As EPI’s analysis shows, the barriers to accessing education in prison have increased, participation has remained variable, the number of higher level qualifications being achieved has fallen and there has been little improvement in literacy and numeracy outcomes. As mentioned above, the most worrying trend has been the deterioration in the quality of education offered in prisons since 2013/14. The graph below illustrates the striking decline in performance.
Figure 1: Percentage of Prisons and Young Offender Institutions graded Requires Improvement or Inadequate 2011-2015
0
10
20
30
40
50
60
70
80
2014/15
2013/14
2012/13
2011/12
per
cen
tag
e
Source: Ofsted Further Education and Skills Outcomes7 (Annual Reports)
3 Ministry of Justice, ‘Transforming Rehabilitation: A Strategy for Reform’, May 2013.
4 The review was undertaken in partnership by the Department for Business, Innovation and Skills (BIS) and the Ministry of Justice (MoJ). The final
report ‘Making prisons work: skills for rehabilitation’ was published in May 2011.
5 Ministry of Justice, ‘Proven reoffending statistics Quarterly Bulletin: April 2013 to March 2014’, (2015) p6.
6 Ministry of Justice, ‘Proven reoffending statistics Quarterly Bulletin: July 2010 to June 2010’, (2011) p14.
7 Data taken from National Archives, Ofsted, Inspection Reports, URL: http://webarchive.nationalarchives.gov.uk/20141124154759/http://www.ofsted.
In the light of the continuing poor outcomes for rehabilitation in prisons as a whole, and of education in custody in particular, the Secretary of State for Justice, Michael Gove, has sought to push rehabilitation up the political agenda since taking office in May 2015. He has launched an independent review of education provision in adult prisons and Young Offender Institutions (YOIs) led by Dame Sally Coates. The Prime Minister, David Cameron, has committed the Government to adopting the recommendations of the review,8 with the final report expected in late March 2016.
This report therefore analyses the problems of the current system of prison education, and considers options to address these.
8 Speech on Prison Reform to Policy Exchange, Rt Hon David Cameron MP, 8th February 2016 URL:
Despite the political rhetoric, recent attempts to create a ‘Rehabilitation Revolution’ have not yet borne fruit: reoffending rates in England and Wales remain high, and the quality of education in prison seems to have been in decline.
Isolating what works to prevent reoffending is complicated, particularly because of the paucity of data tracking outcomes for ex-offenders. Nevertheless, there is a substantial amount of evidence that education promotes rehabilitation. Basic skills education can contribute to a reduction in reoffending of about 12 per cent9 according to one study. Other research found that reductions in
reoffending caused by custodial education and vocational interventions created savings ranging from £2,000 to £28,000 per prisoner.10 A US-based study found that prison education led to a reduction in
the risk of reoffending by 13 percentage points and a saving of five dollars on reincarceration costs for every one dollar spent on correctional education.11
Education can also prevent reoffending by giving offenders the skills they need to enter the labour market. A survey of prisoners found that 68 per cent believed that the most important factor for helping them to stop offending was employment.12 The Ministry of Justice concluded in 2013
that ‘evidence suggests that steady employment – particularly if it offers a sense of achievement, satisfaction or mastery, can support offenders in stopping offending’.13 By forming a pathway
into employment, education can help to secure this outcome. This is borne out by evidence demonstrating the link between educational qualifications and employment. For instance, UK government statistics in 2008 showed that 88 per cent of working age people with a degree were in employment, compared with 67 per cent of those with qualifications at NVQ Level 1 or below and only 47 per cent of those working age people with no qualifications.14
Just over half of prisoners (53 per cent) report having any qualification, compared with 85 per cent of the working age population.15 An Institute of Education survey found that prisoner literacy levels
were very poor compared to the general population (with only 50 per cent having literacy skills at Level 1 or 2, compared to 85 per cent of the general population).16 42 per cent of prisoners also
report having been expelled or permanently excluded from school.17 In addition, the employment
market throughout Europe is changing, with a growing demand for higher level skills. It is estimated that by 2020, 16 million more jobs will require high-level qualifications, while the demand for low skills will drop by 12 million jobs.18
Time in prison, depending on the length and stability of sentence, provides an opportunity to address the gaps in prisoners’ learning and to support them to create the building blocks for successful integration into employment and society on release.
If the ultimate aim of prison education is to prevent reoffending, and employment has been shown as an effective means to do this, the prison education system should focus on education that is clearly linked to employment outcomes, such as vocational training.19 However, it is important not
to disregard the wider benefits of education, such as the development of ‘character and resilience’.
9 Office of the Deputy Prime Minister, Social Exclusion Unit, ‘Reducing re-offending by ex-prisoners’, July 2002, p44
10 NIACE, ‘Lifelong Learning and Crime: An Analysis of the Cost-Effectiveness of In-prison Educational and Vocational Interventions’, 2009, p3
11 LM Davis, JL Steele, R Bozick, M Williams, S Turner, JNV Miles, J Saunders, PS Steinberg, RAND, ‘How Effective is Correctional Education?’, 2014,
Sum-mary p20
12 Department for Business, Innovation and Skills/Ministry of Justice, ‘Review of Offender Learning - Making prisons work - skills for rehabilitation’, May
2011, p10
13 Ministry of Justice, Evidence on Reducing Reoffending, 2013, p8
14 Office for National Statistics, ‘Social Trends No. 38’, (2008 edition), p49. See also Ministry of Justice, ‘The pre-custody employment, training and
educa-tion status of newly sentenced prisoners: results from the Surveying Prisoner Crime Reduceduca-tion (SPCR) longitudinal cohort study of prisoners’; Kathryn Hopkins, MoJ Analytical Service, Ministry of Justice Research Series 3/12 March 2012, p14
15 Ibid, pii
16 B Creese, UCL Institute of Education, ‘An assessment of the English and maths skills levels of prisoners in England’, November 2015, p5
17 K Williams, Ministry of Justice, ‘Prisoners’ childhood and family backgrounds: Results from the Surveying Prisoner Crime Reduction (SPCR)’ longitudinal
cohort study of prisoners’, 2010, p14
18 J Hawley, I Murphy, M Souto-Otero, GHK Consulting, ‘Prison Education and Training in Europe: current state of play and challenges’, May 2013, p12
19 I Brunton-Smith, University of Surrey and K. Hopkins, Ministry of Justice, ‘The impact of experience in prison on the employment status of
longer-sen-tenced prisoners after release: Results from the Surveying Prisoner Crime Reduction (SPCR) longitudinal cohort study of prisoners’, Ministry of Justice Analytical Series 2014
These ‘life skills’ can reduce reliance on criminal responses to life’s difficulties, and are themselves valued by employers. A survey of employers’ views of prison education found that as well as the expected literacy and numeracy skills, employers also rated highly attributes including a positive attitude and the ability to work well with others as influencing their hiring decisions. Indeed, a positive attitude was viewed as more important than having the technical skills to do the job.20
Building up personal skills and capabilities, as well as self-confidence and support networks, are crucial for long-term desistance from crime.21
The central purpose of education in prisons is therefore to prevent reoffending, and as a means to do this, to help prisoners into employment. For this report EPI has analysed the performance of the current system in providing high quality and appropriate education for prisoners in order to achieve this goal.
20 CfBT Education Trust and YouGov, ‘Employers’ perception of best practice in prison education’, 2011, p12
21 L Terry with V Cardwell, Revolving Doors Agency, ‘Understanding the whole person: Part One of a series of literature reviews on severe and multiple
To assess the performance of the prison education sector, EPI has focused on three key indicators: 1. Access to and participation in education
2. Learning outcomes achieved 3. Quality of education offered
Measure 1: Access to and participation in education
Access
Analysis of available data indicates that prisoners are not always able to access education and other purposeful activity due to the limited time made available.
A new ‘core day’ was introduced in most adult prisons in 2014-15 with the intention of maximising prisoners’ time out of cell while making the most efficient use of staff time. The Prison Service has a public sector benchmark across YOIs and adult prisons (except for the high security estate) for the amount of time prisoners should spend out of cell. This is 10.25 hours unlocked, and 6.25 hours of
this are meant to be spent in ‘purposeful activity’, including education, training and employment.22
However, recent data found that prisoners reported spending only around seven hours per day out
of their cells on average.23 Only 14 per cent were spending the recommended 10 hours out of their
cells and there was little information on the number of hours spent in purposeful activity.24 The
clearest recent estimate comes from the National Audit Office in 2013, which referred to an average
figure of 24.7 hours of purposeful activity per week per prisoner.25
Given that time spent in education is not measured separately, and that there is a lack of data collected on how many hours prisoners spend in purposeful activity, this report uses a proxy measure of “level of hours of potential access to education”, based on the ‘Time Out of Cell’ data collected by HMIP.26 While this cannot be used to extrapolate numbers of hours spent in education
[image:10.595.90.521.508.673.2]and training and represents a limited sample of the prison population as a whole, it does highlight that the time prisoners spend out of their cell - with the opportunity to access education - has seen little improvement since 2008.
Figure 2: Time Spent Out of Cell by Prisoners 2011-2015
0 5 10 15 20
2014/15 2013/14
2012/13 2011/12
2010/11 2008/9
Per
cen
tag
e of prisoner
s r
eporting
spending 10+ hour
s out of cell
(w
eek
da
ys)
Source: Her Majesty’s Inspectorate of Prisons Annual Reports 2008/09 to 2014/2015. Note: No data available for 2009/10.
The HMIP reports from which this data is derived do not record the number of hours each individual
22 Ministry of Justice, ‘Government response to the Harris Review into self-inflicted deaths in National Offender Management Service custody of 18-24
year-olds’, December 2015 , p33
23 Ministry of Justice, ‘Prisoners’ experience of prison and outcomes on release: Waves 2 and 3 of SPCR’, 29 October 2014, p3
24 HM Inspectorate of Prisons, Annual Report 2014-15, p50
25 A Morse, National Audit Office, ‘Managing the Prison Estate’, 2013, p28
26 This data is based on surveys of prisoners conducted by Her Majesty’s Inspectorate of Prisons.
prisoner spends out of their cell, instead stating the percentage of prisoners stating that they spend 10 or more hours out of cell on weekdays. This has shown virtually no improvement, from 13 per cent of prisoners stating that they spent 10 or more hours out of cell on weekdays in 2008/9 to 14 per cent in 2014/15 (rounded to the nearest full percentage). Time out of cell figures for 2014/15 also show that substantially more prisoners say that they spend less than two hours out of cell on weekdays (21 per cent) than those who were out of cells for 10 or more hours (14 per cent). EPI also studied Independent Monitoring Board reports for individual prisons, looking at recorded figures on purposeful activity places available and hours spent in purposeful activity (including education, training and work). The variability of the data recorded makes generalisations difficult, but there were indications that places available by prison population for purposeful activity were declining in a number prisons. Availability of activity places therefore may be another area in which prisoners’ access to education and training is becoming more difficult.27
Participation
There are also severe limitations in data measuring participation in prison education. Published figures for 2014/15 indicate there were 101,600 adult offenders in the prison system participating
in education.28 However, this figure is virtually meaningless, as prisoners moving between prisons
or between prison and the community may be counted as learners multiple times, making accurate
calculations of the numbers engaged in learning very difficult.29
From August 2014 mandatory assessments in numeracy and literacy have been introduced for all
prisoners on entry to custody. All new entrants to prison are screened using the National Offender
Management Service (NOMS) Basic Custody Screening Tool (BCST), and where the outcome from the BCST indicates that an individual is below a Level 2 (GCSE grades A*-C or equivalent) for English and Maths, the NOMS will then refer the individual to the OLASS providers who will carry out the more
detailed mandatory numeracy and literacy assessments.30 A study on the mandatory assessments
found that for 2014/15, a total of 123,220 assessments of numeracy and literacy levels were carried
out by OLASS providers in England.31 It is estimated that this represents 90-95 per cent of new
prison entrants since August 2014 receiving this assessment.32
Despite these new assessments, the proportion of prisoners engaging in prison education courses is estimated to be much lower. Estimates of the percentage of prisoners participating in education range
from 42 per cent in 2008/933 to 23 per cent in 2014.34 The Government has set a target of 50 per cent
of prisoners being engaged in learning, but these estimates indicate that it is far from being met.3536
Given the lack of data on proportions of prisoners participating in education, for this report EPI looked at a combination of two data sources. Firstly, Skills Funding Agency data on participation in OLASS provision - in particular the number of learners participating in OLASS-funded education on
an annual basis. This was supplemented with figures from the HMIP survey data on those prisoners
27 These figures have been approximated to a survey-wide percentage (estimated to the nearest full figure) from data available in the appendices to
HMIP’s Annual Reports, available from: https://www.justiceinspectorates.gov.uk/hmiprisons/inspections/?post_type=inspection&s&prison-inspec-tion-type=annual-reports.
28 Skills Funding Agency, Statistical First Release, ‘Further Education and Skills: Learner Participation, Outcomes and Highest Qualification Held’, 21
Janu-ary 2016, p14 - Please note that these figures refer only to SFA-funded learning through the OLASS providers, and that prison education is wider than the OLASS system alone..
29 The numbers provided by the Skills Funding Agency represent absolute numbers of participants in OLASS education, and do not give an indication of
the percentage of the prison population engaged in OLASS learning. 30 Skills Funding Agency, Funding Rules 2015-16, pp100-1.
31 Ibid p6.
32 Estimate provided by the Institute of Education, January 2016 33 R O’Brien, RSA, ‘The Learning Prison’, 2010, p29.
34 K Hopkins (Ministry of Justice) and I Brunton-Smith (The University of Surrey) Ministry of Justice, ‘Prisoners’ experience of prison and outcomes on release: Waves 2 and 3 of SPCR’, p2 .
35 Government Response to the House of Commons Education and Skills Committee Report - Prison Education, June 2005, p12 – the 50 per cent target was set in the founding strategy documentation of OLASS, the ‘Offender’s Learning Journey’ in 2004..
who stated that they were involved in education including basic skills.
[image:12.595.88.525.182.354.2]The HMIP survey data showed a decline between 2008 and 2015, from 34 per cent in 2008/9 to 24 per cent in 2014/15. Given the limitations of the data sources used, this should not be generalised across the whole prison population.37
Figure 3: Involvement in Education (including basic skills) 2008-2015
0 5 10 15 20 25 30 35
2014/15 2013/14
2012/13 2011/12
2010/11 2008/9
Per
cen
tag
e of prisoner
s r
eporting
in
volv
emen
t in educ
ation
(including basic skills)
Source: Her Majesty’s Inspectorate of Prisons Annual Reports 2008/09 to 2014/2015. Note: No data available for 2009/10.
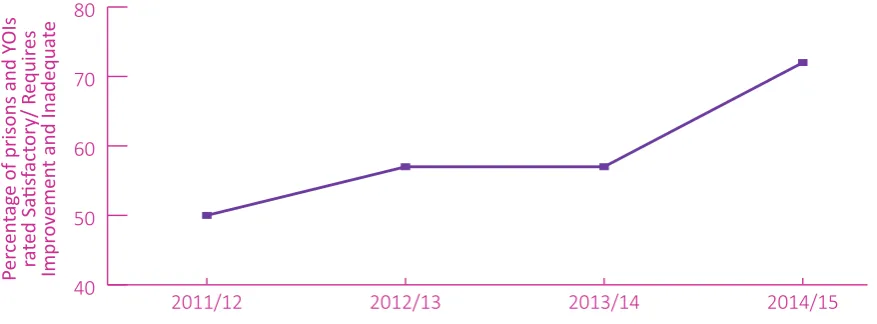
[image:12.595.89.446.449.650.2]The numbers provided by the Skills Funding Agency represent absolute numbers of participants in OLASS education, and do not give an indication of the percentage of the prison population engaged in OLASS learning. However, they do give an indication of trends in the numbers participating in particular levels of education.
Figure 4: Participation in OLASS Learning Provision (Below Level 2) in the Adult Secure Estate 2011-201538
30,000 40,000 50,000 60,000 70,000 80,000 90,000
English and Maths Below Level 2,
exc English & Maths
2014/15 2013/14
2012/13 2011/12
Tot
al number of OLASS learner
s
Source: Skills Funding Agency
Figure 4 highlights that while participation in below Level 2 OLASS education has risen across the board in recent years, the rise is much higher in subjects other than English and Maths, despite reiterated Government commitments to literacy and numeracy. This suggests less improvement in the numbers of prisoners engaged in learning focused on improving their literacy and numeracy,
37 The HMIP surveys represent a small-scale snapshot survey based on the views of prisoners, and the figures for education do not include those for vocational training.
despite this being recognised as crucial for employment and therefore reductions in reoffending.
Figure 5: Participation in OLASS Level 2 and 3 Learning Provision in the Adult Secure Estate 2011-201539
Tot
al number of OLASS learner
s
0 10,000 20,000 30,000 40,000 50,000
Level 3 Level 2
2014/15 2013/14
2012/13 2011/12
Source: Skills Funding Agency
Figure 6: Participation in OLASS Full Level 2 and 3 Learning Provision in the Adult Secure Estate 2011-201540
0 5,000 10,000 15,000 20,000
Full Level 3 Full Level 2
2014/15 2013/14
2012/13 2011/12
Tot
al number of OLASS learner
s
Source: Skills Funding Agency
The absolute numbers of prisoners engaging in learning at Level 2 has risen over the period. However, while there has only been a slight increase in Level 2 numbers, there has been a substantial rise in Full Level 2 qualifications, suggesting that a higher proportion of Level 2 participation now contributes to Full Level 2 than previously.
The numbers participating in Level 3, however, learning have fallen from 2,100 in 2011/12 to 600 in 2014/15 (though participation in Full Level 3 has remained static at 100 participants for both years, bearing in mind the small numbers involved at this level).
39 Please note that these graphs do not show those prisoners who undertook OLASS learning with ‘No Level Assigned’ (7800 in 2011/12; <50 in 2012/13; 4500 in 2013/14; 400 in 2014/15).
[image:13.595.75.433.391.586.2]Measure 2: Learning outcomes achieved
The current contracts for OLASS education in prisons have the effect of prioritising basic skills or vocational qualifications at Levels 1 or 2. Providers have been expected to focus on prisoners achieving accredited qualifications in a core curriculum.41 As highlighted by the graphs below, the
vast majority of these outcomes are for qualifications below Level 2 (excluding English and Maths),42
and it is the increases in these lower level outcomes that has been driving the overall growth in the number of outcomes achieved. The number of Level 3 outcomes supported by OLASS and achieved in prison halved between 2011/12 and 2013/14, from 1,200 courses to 600.43 They then dropped
by a further two-thirds in 2014/15 alone, from 600 to 200.44 The number of Full Level 3 outcomes
[image:14.595.93.526.290.556.2](equivalent to two or more A Levels) being achieved remains low, falling from 100 in 2011/12 to fewer than 50.45
Figure 7: Qualifications Achieved in OLASS Learning Provision in the Adult Secure Estate 2011-201546 0 10,000 20,000 30,000 40,000 50,000 60,000 70,000 80,000 2014/15 2013/14 2012/13 2011/12 No Level Assigned Level 3 Level 2 Full Level 3
Full Level 2 English and
maths Below Level 2
(excluding English & Maths)
No Le
vel Assigned
Le
vel 3
Le
vel 2
Full Le
vel 3
Full Le
vel 2
English and ma
ths
Belo
w Le
vel 2
(e
xcluding English
& Ma
ths)
Total number of OLASS learner
s
The graphs below show the trend in outcomes achieved for both below Level 2 qualifications and Level 2 and Level 3 courses. There has been a substantial increase in the number of below Level 2 outcomes achieved (from 70,600 in 2011/12, to 90,800 in 2014/15, a 29 per cent increase). However, this increase is the result of a rise in achievements excluding English and Maths (from 47,200 to 69,700, a 48 per cent increase), while English and Maths learning outcomes achieved
41 Learning and Skills Council, ‘Developing an Improved Learning and Skills Offer for Offenders in the Community’, September 2009, p5; email
correspon-dence with the Skills Funding Agency.
42 Skills Funding Agency, Statistical First Release, ‘Further Education and Skills: Learner Participation, Outcomes and Highest Qualification Held’, 21
Janu-ary 2016, Table 10.2
43 Ibid. See also, N. Champion, Prisoners’ Education Trust, ‘The Future of Prison Education Contracts: Delivering Better Outcomes’, May 2015, p3.
44 Skills Funding Agency, Statistical First Release: ‘Further Education and Skills: Learner Participation, Outcomes and Highest Qualification Held’, 21
Janu-ary 2016, Table 10.2
45 The numbers for Full Level 2 and Full Level 3 represent a subset of Level 2 and Level 3. Level 2 and Level 3 figures represent the numbers of enrol-ments for Level 2 and 3 courses. Full Level 2 and Full Level 3 numbers represent the numbers achieving sufficient Level 2 or 3 courses to achieve the equivalent of a Full Level 2 or 3 qualification. Where those numbers achieving a learning outcome were fewer than 50 this is reflected in the graphs by use of a figure of 25.
46 Skills Funding Agency, Statistical First Release, ‘Further Education and Skills: Learner Participation, Outcomes and Highest Qualification Held’, 21
actually declined from 23,400 in 2011/12 to 21,100 in 2014/15, a fall of roughly 10 per cent. The largest drop in these outcomes came from 2011/12 to 2012/13, where they fell by approximately 30 per cent.47
Figure 8: Below Level 2 Qualifications Achieved in OLASS Learning Provision in the Adult Secure Estate 2011-201548
0
10,000
20,000
30,000
40,000
50,000
60,000
70,000
80,000
Below Level 2
English and maths
Below Level 2
(excluding English & Maths)
2014/15
2013/14
2012/13
2011/12
Tot
al number of OLASS learner
s
Source: Skills Funding Agency
For higher level outcomes, there has been an increase in the number of Level 2 learning outcomes achieved since 2011 (from 31,800 in 2011/12 to 32,700 in 2014/15, a 3 per cent increase). The most striking rise has been in the number of Full Level 2 outcomes achieved: from 2,300 in 2011/12 to 10,600 in 2014/15, representing a 361 per cent increase. In contrast, Level 3 outcomes have declined sharply from an already low level (from 1,200 in 2011/12 to 200 in 2014/15, a fall of 83 per cent).
The trends for learning outcomes therefore seem to be somewhat mixed. The quantity of qualifications achieved has increased, in particular Full Level 2 qualifications, which is a welcome trend. However, Level 3 outcomes have hugely declined, and English and maths outcomes have also declined slightly. It should be noted that increases in qualifications achieved may reflect both a higher prison population, but also individual prisoners achieving a greater number of learning outcomes. The SFA makes clear that an offender learner may be counted more than once ‘if they participated/achieved in learning at different institutions during an academic year’.49
47 Skills Funding Agency, Statistical First Release, ‘Further Education and Skills: Learner Participation, Outcomes and Highest Qualification Held’, 21
Janu-ary 2016, Table 10.2
48 Ibid
Figure 9: Level 2 and Full Level 2 Qualifications Achieved in OLASS Learning Provision in the Adult Secure Estate 2011-2015
0
5,000
10,000
15,000
20,000
25,000
30,000
35,000
Full Level 2
outcomes achieved
Level 2
outcomes achieved
2014/15
2013/14
2012/13
2011/12
Tot
al number of OLASS learner
s
Source: Skills Funding Agency
Figure 10: Level 3 and Full Level 3 Qualifications Achieved in OLASS Learning Provision in the Adult Secure Estate 2011-2015
0
300
600
900
1,200
1,500
Full Level 3
outcomes achieved
Level 3
outcomes achieved
2014/15
2013/14
2012/13
2011/12
Tot
al number of OLASS learner
s
Source: Skills Funding Agency. NB: numbers of Full Level 3 outcomes for 2012/13, 2013/14 and 2014/15 are fewer than 50.
An emphasis on low level accredited qualifications is reinforced by the current funding methodology for the OLASS 4 contracts. Under OLASS 3, payment was made against teaching hours delivered which, while it gave providers flexibility over what they could deliver, did not incentivise progress or achievement of concrete outcomes for learners. Under the new approach for OLASS 4 funding is attached to qualifications and courses completed. This approach has incentivised the provision of quantity over quality: a “qualifications factory” in the view of some education staff.50 There is often
insufficient flexibility for providers to draw down funding for above Level 2 courses. The pressure
50 P Kirk, ‘Thoughts on OLASS 4’, Inside Time, 1st October 2012. See also G. Czerniawski, ‘A Race to the bottom – Prison Education and the English and
[image:16.595.96.527.411.628.2]to accredit (as well as risk aversion on the part of providers and prison management) means that opportunities to progress in educational pathways that do not lead to a defined qualification can be lost. This is frequently of crucial importance given the variety of needs within the prison population. Types and levels of qualifications achieved may not then match what is needed for prisoners to secure employment and prevent reoffending. Analysis has shown a significant relationship between literacy and numeracy and employment,51 and higher level qualifications are becoming increasingly
important in the labour market (see discussion below). This indicates a need for a more sophisticated measurement of value-added progress for offender learning.
Measure 3: Quality of education
The quality of education provided in prison has been assessed as consistently poor, with a further decline in performance over recent years52. EPI has chosen to analyse available data on quality,
including the ratings by Ofsted of education, training and skills provision and the ratings given by HMIP for purposeful activity.
[image:17.595.76.515.361.523.2]The graphs below shows the trend in the proportion of prisons and YOIs graded Satisfactory/ Requires Improvement and Inadequate by Ofsted over the past decade.53
Figure 11: Ofsted Performance Ratings (Prisons and Young Offender Institutions) 2011 – 2015
40 50 60 70 80
2014/15 2013/14
2012/13 2011/12
Per
cen
tag
e of prisons and Y
OIs
ra
ted Sa
tis
fact
or
y/ R
equir
es
Impr
ov
emen
t and Inadequa
te
Figure 8 shows a steep deterioration from 2011-2015. 2014/15 saw the worst performance since 2009. 72 per cent of prisons were graded Inadequate or Requires Improvement in 2014/15, the worst performance for five years. These trends also fit with the assessments of HMIP, which announced that many prisons had experienced a steep decline in performance in 2014/15.
The graphs below give a more detailed picture for the three headline measures used by Ofsted: outcomes for prisoners engaged in learning and skills and work activities, quality of provision and leadership, and management of education, training and skills. These show the same trend of improvement up to 2012 and a subsequent stagnation and then decline in performance across all three areas. These more specific measures show some pockets of good performance, with a slight increase in Outstanding prisons, though overall there has been a substantial increase in Satisfactory/ Requires Improvement and Inadequate ratings.
51 A Vignoles, A De Coulon and O Marcenaro-Gutierrez, ‘The value of basic skills in the British labour market’, NRDC, October 2008, p21. 52 Ofsted, Annual Report 2014/15: Education and Skills, December 2015, p28.
18
Figures 12-14: Ofsted Performance Ratings 2010 – 2015
Outcomes of prisoners engaged in learning and skills and work activities
0 10 20 30 40 50 60 70 80 2014/15 2013/14 2012/13 2011/12 2010/11 Inadequa te Sa tis fact or y/ Requir es impr ov emen t Good Outs tanding Per cen tag
e of prisons and Y
OIs
Quality of provision
0 10 20 30 40 50 60 70 80 Inadequate Satisfactory/Requires improvement Good Outstanding 2014/15 2013/14 2012/13 2011/12 2010/11 Inadequa te Sa tis fact or y/ Requir es impr ov emen t Good Outs tanding Per cen tag
e of prisons and Y
OIs
Leadership of management of education, training, and skills
0 10 20 30 40 50 60 70 80 Inadequate Satisfactory/Requires improvement Good Outstanding 2014/15 2013/14 2012/13 2011/12 2010/11 Inadequa te Sa tis fact or y/ Requir es impr ov emen Good Outs tanding Per cen tag
e of prisons and Y
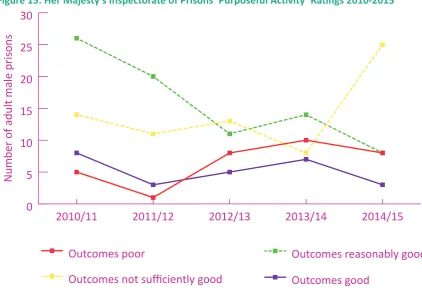
Figure 15: Her Majesty’s Inspectorate of Prisons ‘Purposeful Activity’ Ratings 2010-2015
0
5
10
15
20
25
30
Outcomes good
Outcomes reasonably good
Outcomes not sufficiently good
Outcomes poor
2014/15
2013/14
2012/13
2011/12
2010/11
Number of adult male prisons
Source: HMIP Annual Reports 2011-15. The graph reflects the numbers of prisons and YOIs holding adult and young adult men achieving these ratings for purposeful activity outcomes.
Overall this analysis of inspection reports indicates consistently poor quality provision and a decline in quality over recent years.
General trends in the prison system
The barriers to delivery of effective education in prison include: overcrowding, movement of prisoners between prisons and in and out of custody, staffing shortages, conflicting prison priorities and the engagement of prisoners in learning.54 The decline in the above measures from 2012/13
indicate that many of these barriers have been compounded in recent years by tightened funding and increased pressure on the capacity of the system. As of 8th January 2016, the overall prison
population stood at 84,950.55 This is not far below the useable operational capacity of 87,797. HMIP
and Ofsted have both been vocal about the links between overcrowding, reduced staffing levels and funding constraints on the ability for education to be a core part of prison provision. The strains on the prison system in recent years are indicated by the graph below showing prison performance ratings from the National Offender Management Service.
54 J Hurry, L Rogers, M Simonot and A Wilson, Sir John Cass’s Foundation and the Institute of Education, ‘Inside Education: The Aspirations and Realities of Prison Education for under 25s in the London area’, June 2012, p7
Figure 16: NOMS Annual Performance Ratings 2010-2015
0 20 40 60 80 100 120
1. Overall performance is of serious concern 2. Overall performance is of concern
3. Meeting the Majority of Targets 4. Excellent
Performance
2014/15 2013/14
2012/13 2011/12
2010/11
Number of prisons
Source: National Offender Management Service Prison Annual Performance Ratings 2010-2015. The figures reflect absolute numbers of prisons achieving each rating.
[image:20.595.90.527.564.747.2]While purposeful activity outcomes and education quality have seen a stark decline from 2013/14 to 2014/15, this has not been strictly mirrored in outcomes for overall prison performance. There has been a clear decline in wider prison performance since 2010, though this seems to have stagnated somewhat from 2013, while education and purposeful activity deteriorated more sharply. This could reflect the prioritisation of alternative prison targets such as security and respect in the light of financial and capacity pressures, or indicate that the decline in education is not wholly accounted for by wider prison trends of overcrowding and funding constraints. This stagnation is also evident in reoffending rates, which have barely moved since 2009, another indication of the pressures on the system.56
Figure 17: Re-offending Rates for Adult Offenders Release from Custody 2009-2014
30 40 50 60
2013/14 2012/13
2011/12 2010/11
2009/10
Pr
ov
en r
eoff
ending r
at
e
(per
cen
tag
e)
Source: Ministry of Justice. For comparative purposes the graph used proven reoffending statistics for April-March yearly intervals
Assessment of the current system
EPI’s scorecard of prison education performance shows an overall picture of variable and declining performance.
There has been a stagnation in the time that prisoners spent out of cell: the hours in which they have the opportunity to access education and other purposeful activity. In 2014/15 21 per cent of prisoners spent less than two hours out of cell compared to 14 per cent who were unlocked for over 10 hours. The percentage spending 10 or more hours out of cell in 2014/15 had changed little from 2008/9. In addition a review of IMB reports on available activity place indicated that access to education may be becoming more difficult.
The percentage of prisoners stating that they were involved in education had declined over the
period, though there has been a rise in absolute numbers participating in available courses. However,
this rise has been mainly limited to participation in courses for low level qualifications. Participation in English and Maths courses and Level 3 courses has fallen.
This pattern has had a concerning impact on some learning outcomes achieved: while the number of below Level 2 outcomes achieved has increased substantially, qualifications achieved in English and Maths have actually declined by roughly 10 per cent. Meanwhile, Level 3 learning outcomes achieved have dropped significantly. The rise in Level 2 and Full Level 2 qualifications is a welcome trend, though there are questions about the fall in English and Maths outcomes and about the ability for prisoners to progress beyond this if needed.
In light of the above analysis of the performance of the current system, the following section outlines potential options for reform of prison education.
In summary, these are:
: Effective induction and assessment processes for all new prisoners;
: A greater consideration of the different cohorts of working age prisoners, based around skills
and employment but with provision for personalisation and non-accredited programmes;
: An emphasis on highly qualified education and careers staff, with specialised training routes
and comprehensive access to continuous professional development;
: A more linked-up and consistent management of education, employment and training
progression;
: Greater focus on sufficient collection of data on delivery and performance; : Clear outcome measures;
: A distinct accountability structure and robust measures to tackle failing performance.
Clear entitlements
Effective prioritisation
The prison population is not currently segmented effectively into cohorts of prisoners with different needs and suitability for particular interventions. Existing entitlements are not clearly set out for adults. This is in contrast to the youth secure estate where education providers in public sector Young Offender Institutions (YOIs) have been required to provide 27 hours of education a week, supplemented by 3 hours of physical exercise since mid-2015.57
In addition, in light of the very real financial and operational constraints under which the sector is operating,58 the Government will be mindful of the need for the system to be targeted and cost
effective. There must be clarity over which prisoners are entitled to which forms of education, to determine funding and resource levels.
More rigorous prioritisation would focus the system on those prisoners for whom educational intervention is most likely to reduce reoffending. Employment is acknowledged as one of the main, if not the central, factor in enabling individuals to move away from crime on release from prison. Education in preparation for employment is highly valued by prisoners, and therefore more likely to engage them in education. A recent survey found that 53 per cent of prison learners were motivated to do a course for employment-related reasons, with 25 per cent motivated at least in part, to help them set up a business when leaving prison.59
Working age prisoners
Interventions could therefore be more focused on getting those prisoners who can work, ready for work. Prisoners of working age who lack the skills to engage in the labour market should receive the education, vocational training and employment opportunities in custody that will enable them to compete in an increasingly competitive job market on release.
In order to prepare for the expectations of future employment, the Government could consider an entitlement for working age prisoners of a full working week of activities, with a minimum proportion
57 Ministry of Justice, ’30 hours education a week for young offenders’, 15 December 2014, URL: https://www.gov.uk/government/news/30-hours-educa-tion-a-week-for-young-offenders
58 Ministry of Justice, ‘Ministry of Justice’s settlement at the Spending Review 2015’, 25 November 2015, URL: https://www.gov.uk/government/news/
ministry-of-justices-settlement-at-the-spending-review-2015. The Ministry of Justice is expected to achieve a cut in its overall resource budget of 15 per cent by 2019-20
59 Department for Business, Innovation and Skills, Research Paper 260, ‘Prior Qualifications of Adult OLASS learners 2015’, January 2016, p3
of these hours spent in education for those lacking functional skills and basic qualifications. A possible proportion could be 15-20 hours dedicated to education out of a 30-40 hour full week, though this might need to be flexible depending on the needs of the prisoner, i.e. if more time needs to be allocated to substance misuse or mental health interventions. There would be an expectation that working age prisoners would engage with this provision and an appropriate system of incentives could be designed.
The offer for prisoners aged 18-65 should therefore be focused on moving working age prisoners towards a level of qualification needed for employment purposes, and towards supporting them to become well-adjusted and employable members of society. There is a general need for a more agile and flexible workforce with the skills needed for the digital age. Across Europe, by 2020, 16 million more jobs will require high-level skills, while the demand for low skills will drop by 12 million jobs.60
Employers will be looking increasingly for intermediate skills, i.e. Level 3, for entry level jobs.61 This
is in line with the goals set for 2020 by the Leitch Review of UK skills, which included a goal for more than 90 per cent of the adult population to be qualified to at least Level 2, and to shift the balance of intermediate skills from Level 2 to 3.62
In line with this, the Government should consider whether the entitlement to education for prisoners should be more tailored and flexible, allowing for prisoners who are ready and able to achieve a Level 3 qualification to do so, where this is needed for progression and employment. However, given the multiple barriers to educational achievement that many prisoners face and the frequently low levels of prior qualifications, focus for the majority of prisoners will remain on improving their skills levels, particularly in numeracy and literacy, below Level 3. Engagement in education would be considered obligatory for those with below Level 2 qualifications. Depending on individual circumstances and length of sentence, a realistic target would be for every prisoner to attain a certain level of progress towards employability while in custody, based on personalised targets which reflect differing starting points and circumstances.
Similarly, greater provision of tailored employability support and options to progress learning and qualifications could be available for those prisoners already qualified to Level 2 and above. This would be at the discretion of prison governors where they could fund this from their allocated budget.
Prisoners aged 18-21
A distinctive offer for young prisoners aged 18-21 could be considered, reflecting the high rates of recidivism: for instance, for 2011, 18–20 year olds reoffended at a rate of 56.1 per cent, in comparison to a rate of 45.6 per cent for prisoners aged 21 and older.63 Young adults (aged 18-20) are also more
likely than older prisoners to report issues with schooling.64 It is therefore more likely to be
cost-effective to focus particular efforts on this group. This could focus on their readiness to enter the labour market and align their offer with that received by young people in the community. This also reflects the priorities of this age group and so provides a means of engaging these prisoners in education and training. Younger prisoners are more interested in gaining employment and training and more likely to state that having a job when released would stop them from re-offending (81 per cent compared with 66 per cent of older prisoners)65.
One possibility is for the offer to young prisoners to mirror the ‘youth obligation’ for 18-21 year olds claiming benefits in the community from April 2017.66 This involves those aged 18-21 and
60 J Hawley, I Murphy and M Souto-Otero , ‘Prison Education and Training in Europe: Current state of play and challenges’, May 2013, p12
61 R O’Brien, RSA, ‘The Learning Prison’, 2010, p62
62 Leitch Review of Skills, ‘Prosperity for all in the global economy – world class skills’, December 2006, p3
63 Ministry of Justice Consultation, ‘Transforming Management of Young Adults in Custody’, November 2013, p25
64 K. Williams, Ministry of Justice, ‘Needs and characteristics of young adults in custody: Results from the Surveying Prisoner Crime Reduction (SPCR)
survey’, Analytical Summary 2015 65 Ibid
66 W Wilson, House of Commons Library, ‘Housing Benefit: withdrawing entitlement from 18-21 year olds’, Briefing Paper Number 06473, 26 August
entitled to universal credit receiving six months intensive support for employment and skills, followed by an apprenticeship, traineeship or mandatory work placement. Given the low levels of qualifications and skills held by a large proportion of prisoners, this form of work-focused intervention could be more useful after a certain level of educational progress had been achieved, and so a certain amount of mandatory education could be part of a prisoners’ ‘youth obligation. In addition, apprenticeship and work experience opportunities would need to be clearly designed and risk-assessed, as well as synchronised with sentence planning and possible provision for temporary release.
Short-sentenced prisoners
It is difficult to deliver meaningful education to prisoners serving less than one month. The options to consider here would be whether short-sentenced prisoners assessed as below Level 2 would be entitled to similar educational provision as their longer-term counterparts but in units or bite-sized chunks suitable for the short sentence, or simply signposted to appropriate through-the-gate support by the Community Rehabilitation Companies (CRCs - see page 29) and other public and third sector bodies.
Prisoners not automatically entitled to funded education
Retirement age prisoners
Focusing on employment outcomes could mean that those prisoners of retirement age would not be entitled to funded educational provision, though this could be mitigated by guaranteeing a greater amount of access to the prison library facilities and signposting to workshops and activities provided by charitable and third sector organisations, as well as provision for independent and distance learning.
Higher qualified prisoners
Prisoners with prior qualifications of Level 3 and above (or who achieve Level 3 in custody) would already have reached a level suitable for employment. The focus would then be on providing them with employment and work experience and enhancing wider life skills. Limited funding could be made available if a clear need for higher level qualifications (mainly additional Level 3 courses) related to employment was demonstrated. Otherwise it seems sensible that these prisoners would be expected to engage in a full working week and again be signposted to distance learning opportunities and non-Government funded charitable provision where available.
Quality
As was evident in the years up to 2004, merely having a target of hours for ‘purposeful activity’ was insufficient to ensure an appropriate and quality learning and skills offer for offenders. Clearer guidance on what constitutes meaningful educational provision should therefore be considered. A wide definition of education, skills and employment is necessary to capture the full range of services that offenders require and that should be offered within the set weekly hours. National guidelines should be created defining what activities can be deemed part of this meaningful offer, to avoid the perverse incentive to warehouse prisoners in mundane, repetitive tasks like wing cleaning, in order to hit the required number of hours.
The term, ‘purposeful activity’ is too vague a definition to ensure quality activities. The Government could consider an alternative measure of education and employment provision such as ‘employability activity’, ‘work activity’ or ‘training time’.
Figure 18: Qualifying activities for provision of employability activity
Qualifying Activity
Non-Qualifying Activity
Education, including: basic literacy and numeracy; accredited units and qualifications up to Level 3; vocational qualifications.
Repetitive activity, such as cleaning and washing up, where this did not form part of well-rounded employment or a particular vocational course.
Employment and training, including: paid work, work experience, apprenticeships and traineeships, vocational training.
Personal exercise or use of the gym, when not focused on qualifications or career goals.
Personal and social development skills, including: accredited and non-accredited courses, group courses and activities with strong evidence base for aiding rehabilitation, including drama, art and team sport, family engagement with education.
The risk with targets for hours of education provision for the prison population or particular cohorts of prisoners is that quantity of provision replaces quality: prisoners might be placed in maximum-size group classes that may be inappropriate to their educational or vocational needs. There are, however, ways in which this risk can be mitigated. Firstly, by specifying minimum proportions of the weekly hours to be spent on certain skills areas. The following is a suggested offer if a target of 35 hours of activity were to be given to a prisoner:
: Fourteen hours of education or vocational training
: Fourteen hours of employment/work-based activities, linked to skills development or
achievement of qualifications
: Seven hours of personal and social development skills (PSD)
Outlining guideline minimums for different kinds of activities is one way of guaranteeing that each prisoner receives a balanced offer, and beyond these proportions, particular areas could then be scaled up depending on the needs of the individual. For instance, the rest of the hours being allocated to education if the prisoner has no or only low-level qualifications, or to prison-based employment if they possess relevant qualifications but lack practical experience. In addition, an emphasis on flexibility in how qualifications are awarded is essential, given the churn within the prison population. This means an emphasis on a modular approach to qualifications to avoid prisoners missing windows for sitting exams and thereby being unable to achieve qualifications, even after completing the majority of a course.
Figure 19: Table of Prisoner Entitlements to education
Prisoner category
Education entitlement
Age 18-21, sentence of longer than one month Below Level 3 qualification
Entitled and mandatory Full week of activity, with a minimum amount of education depending on levels of qualification, combined with pre-employment
programmes
Apprenticeships/Traineeships Aged 22-65, sentence of longer than one
month.
Below Level 3 qualification
Entitled and mandatory
Full working week
Up to Level 3 qualifications, with flexibility for higher qualifications
Aged 18-65, qualified above Level 3 Entitlement to a work-related qualification at Level 3 or above, where link with employment/
career path is clearly demonstrated Assessed and signposted to private/third
sector provision
Funded education for above Level 3 only if can show it is needed for employment purposes
Aged 65 and over No automatic entitlement
Assessed and signposted to private/third sector provision
Assessments
To achieve effective personalisation in provision, a greater focus is needed on appropriate induction and assessment. Currently there is no standardised practice for induction upon entry to prison, other than the new mandatory literacy and numeracy assessment and a meeting with the National Careers Service, which can be basic.67 This means that individual learning plans for prisoners are
often not effectively tailored to their specific needs and capabilities. The induction for all new prisoners should, at a minimum, include:
: An assessment of literacy and numeracy;
: Previous education and qualifications, including previous experiences of education and
attitudes towards learning;
: Previous employment experience and employment preferences; : Criminal background and offending behaviour;
: Family and support network;
: Accommodation and resettlement needs e.g. finance;
: Any health needs including mental health and substance abuse; : Overall priorities for the prisoner .
67 Her Majesty’s Inspectorate of Prisons, HM Inspectorate of Probation and Ofsted, ‘Resettlement provision for adult offenders: accommodation and
This induction should take place early in a prisoner’s sentence, and planning could subsequently focus in more detail on particular priorities identified for each prisoner.
Individual Learning Plans and review process
Beyond the initial assessment and induction, the monitoring of educational progress for prisoners could be improved and standardised. Currently this is the point at which the learning and skills plan for an individual is designed, but fragmented responsibility between the creation and delivery of an ILP, and the lack of sufficient follow-up and monitoring of goals set, undermine their use as a basis for progression. The National Careers Service designs goals for a prisoner, and the OLASS provider must then design a plan to deliver these. These are also both separate from the more general sentence planning under NOMS.68 When a prisoner is released he or she now has a statutory period
of supervision lasting for twelve months, undertaken either by the new Community Rehabilitation Companies (CRCs) or the National Probation Service (NPS), depending on the risk level of the individual. Currently the CRCs and NPS have only a minimal responsibility of signposting with regards to prisoners’ education, training or employment (ETE) needs on release.69
A joined-up data collection system and shared outcome framework should be developed as an effective basis on which the various stakeholders and agencies can coordinate and monitor plans to ensure the achievement of learning goals. The outcomes to be monitored both during custody and on release need to be clearly specified in order to hold all partners to account. A minimum number of reviews per year of ILPs including learners, education providers, relevant prison staff and the National Careers Service could happen in all prisons. These could become part of the current Quality Improvement Group meetings,70 but the learner should be included as standard
for at least part of the review. The focus should also remain on effectively monitoring learners’ and partners performance, as happens already in Outstanding prisons. For instance, HMP Hollesley Bay, the first adult male prison to gain an Ofsted Outstanding rating for its education provision (in January 2015), has a comprehensive and stringent review process of ILPs, “identifying and implementing timely improvements”.71 This review could better be used as an opportunity for
prisoners to feed into their plans and targets and review timescales, encouraging ownership of the plans and their relevance to prisoners’ learning experiences. Ofsted gives HMPYOI Low Newton as an example of good practice in the use of individual learning plans. Here detailed ILPs were created during a five-day induction process, and prisoners were encouraged to view them not just as planning tools but as a means for them to engage with staff and tutors.72
Assessments and learning plans could also be better used to support those prisoners with learning difficulties or multiple needs, who may need more specialised support to engage with education. It is estimated that the prevalence of learning disabilities is much higher among prisoners compared with the general population, approximately 20 to 30 per cent.73 The new mandatory assessments
in literacy and numeracy are expected to screen also for any learning disabilities or difficulties, but this is often reliant on prisoners self-reporting or staff picking up on potential issues. In most cases there is insufficient recording of how a prisoner’s learning disability may affect their sentence planning and ability to access learning and skills training, with limited provision of specially adapted programmes.74 More comprehensive induction processes could identify particular learning needs,
which would then be a major part of the review process.
68 House of Commons Business, Innovation and Skills Committee, ‘Adult Literacy and Numeracy’, Fifth Report of Session 2014-15, p33
69 Offender Rehabilitation Act 2014, and see Target Operating Model: Rehabilitation Programme
70 These are regular meetings of managers and senior staff in individual prisons to discuss issues and strategy, Meetings can usually include Heads of
Reducing Re-offending, Learning & Skills Managers, Education Managers, Activities Managers, Heads of Commissioning and Contracts and the National Careers Service.
71 HM Chief Inspector of Prisons, ‘Report on an unannounced inspection of HMP Hollesley Bay’, 2015, p40
72 Ofsted, ‘Using individual learning plans to improve personal and vocational skill development: HMP and YOI Low Newton’, 11 July 2012
73 Criminal Justice Joint Inspection, ‘Offenders with learning disabilities not getting help they need in prison, say inspectors’, 26 March 2015, URL: https://www.justiceinspectorates.gov.uk/cjji/media/press-releases/2015/03/learningdisbailitiespt2news/
74 Criminal Justice Joint Inspection, “A joint inspection of the treatment of offenders with learning disabilities within the criminal justice system - phase
System governance
The governance and accountability of prison education at a national and local level is complex and fragmented. Despite the best intentions and efforts of prison staff and external providers, too often there is confusion regarding roles and responsibilities. This undermines seamless end-to-end management of a prisoner’s education throughout their sentence and on release.
While prison governors are nominally accountable for the performance of all rehabilitation programmes in their individual prison, including education, and are accountable to HMIP for ‘purposeful activity’ outcomes they do not have control over the management of these programmes. A Coalition Government consultation revealed that often governors “feel they do not have…a
sufficiently important role in the process of deciding who will provide learning in their prison;… [or] enough influence on what will be delivered”.75 Prisons have been subject in recent years both
to centralising moves towards benchmarking and an increasing number of services within prisons being provided by external contractors. This means that governors need to play an increasing role in managing partnerships and ensuring that fragmented provision shares a common focus on core targets, but they have not been given the tools to do so effectively, as highlighted by the House of Commons Justice Select Committee.76 Instead they are primarily accountable to NOMS for security
and overall performance outcomes.
The role of prison governors
The Secretary of State for Justice has announced an intention to increase the autonomy of prison governors to manage the various services collected in a prison, including education.77 Given the
governor’s overall responsibility for prison outcomes, they could be given greater flexibility in the provision and offer of education, which is crucial to the process of rehabilitation. Nevertheless, there are risks inherent in such a move, including further fragmentation of provision and the risk that education may take a back seat to governors’ other priorities, including security and overall regime management. Therefore key performance targets for governors should be considered, such as provision of a certain number of hours for prisoners aged 18-65, and targets for outcomes on release.
In such a system, rather than providers bidding for regional contracts, prison governors would be allocated funding, and then choose for themselves - either on an individual basis or in regional clusters - the education, National Careers Service and other providers with whom they wished to contract, or whether they wish to deliver education internally. This would enable governors to shape the curriculum and offer according to the needs of their prisoners and the local labour market, which high performing prisons already adopt. It could also improve lines of accountability as prison governors would be ultimately responsible for learning and employment outcomes on release from their prison, and so would be incentivised to encourage joined-up working throughout the prison focused on these ultimate outcomes. Prison governors could either employ their own dedicated education staff, which would have the advantage of continuity, or contract out where they felt that external providers had better expertise, for example in particular vocational or employment training. Given the need for more flexibility over entitlements to Level 3 qualifications highlighted earlier in this report, governors could have discretion over funding education to this level, and for what point in a prisoner’s sentence they allow this, if they could accommodate this from within their overall education budget.
Governors could also have discretion over the length of contracts to award (where they did not wish to develop their own in-house expertise), though given targets set for outcomes and the 75 Department for Business, Innovation and Skills and Ministry of Justice, ‘Making Prisons Work: skills for rehabilitation’, Review of Offender Learning,
May 2011, p6
76 House of Commons Justice Committee, ‘Prisons: planning and policies’, Ninth Report of Session 2014-15, 4 March 2015, p4
disruption often caused to prison education departments by the current triannual retendering, a longer contract period of 5 years could be introduced initially (with provision of break clauses in case of poor performance and failure).
Funding incentives
Prison governors would, as part of genuine autonomy, receive their own individual education budgets to spend as they wish, though they would be held to