in focus
RESEARCH AND
DEVELOPMENT
â
THEME 9-1/2000
R&D STATISTICS
Contents
Human Resources in
Science & Technology:
A European Perspective
Ibrahim Laafia
Introduction/definitions 2
Stock Indicators 2
Employment Patterns in HRST 3
Scientists & Engineers 4
S&T Unemployment in the EU .5
Flow Indicators 5
Science and Engineering 6
Conclusions and Future Work.6
Manuscript completed on: 18.04.2000
ISSN 1024-7971
Catalogue number: KS-NS-00-001-EN-C
Price in Luxembourg per single copy
(excl.VAT):EUR6
© European Communities, 2000
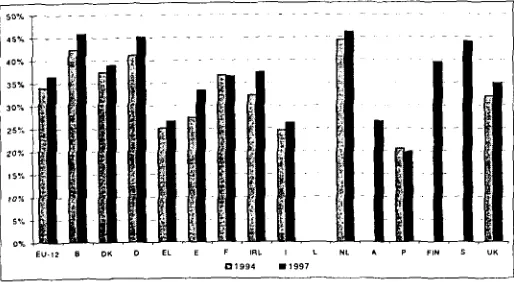
Figure I: HRSTC as a proportion of the labour force (1994,1997)
>
According to the Community Labour Force Survey and the definitions laid
down in the Canberra Manual, 21.7 million people (12.9% of the labour
force) achieving a third level education were, in the EU-15 in 1997,
working in a science and technology occupation (HRSTC).
> Ina majority of countries, the importance of S&T related occupations has
increased over the period 1994 to 1997.
> A majority of EU Member States have an HRST unemployment rate of
between 3 and 5 per cent. This is significantly lower compared with
unemployment among other persons.
> There has been an overall rise across the EU-15 in tertiary education
levels over the time period analysed.
> In a majority of cases, annual average employment growth is higher for
those S&E that have a third level education.
Introduction/definitions
As countries have increasingly begun to recognise the
importance of human capital as an engine of growth,
with rising emphasis on the 'Knowledge based
economy', there has been an increased interest in
measuring the cohorts of these highly qualified persons.
To what degree do nations and regions have the
capacity to turn human potential into technological and
innovative practices
(stocks)?
And are the respective
education systems meeting this demand
(flows)?
The
measurement ot stocks ano iìows of Human
Resources in Science and Technology (HRST) aims to
deal with these questions. HRST
are
people who have
[image:2.595.46.296.339.446.2]either (i) successfully completed education at the third
level in a S&T field of study or (ii) are not formally
qualified as above but employed in a S&T occupation
where the above qualifications are normally required.
Table 1 shows the different categories of HRST.
Table 1: Categories of HRST
HRSTO
(Occupation)
[Professionals
Technicians
Afønaærs
irti oner occupation;
Uner-ctoyed
imette
Total
HRSTE
(Education)
Third Level Education
iscEDíiscesaiscmE
HRST-core
HRST non-core
HRST urierrplcYai
HRST inactive
;
<
Third Leu«) Education
ISCS><5
HRST without trird level
education
TOT«.
Data is collected according to the guidelines set out in
the Canberra Manual.
1
The stock data, which originates
from the
Community labour Force
Survey (CLFS),
is
broken down by gender, age and occupation. The CLFS
has the advantage of being a rather harmonised data
source and may facilitate international comparability.
Data on education comes from the EU
publication
'Education across the EU' (Statistics and Indicators,
Theme 3, Population and Social Conditions). Education
respects the International Standard Classification of
Education (ISCED) and occupation follows the
International Standard Classification of Occupation
(iSCO).
2
The aim of this Statistics in Focus is to give a snapshot
of the recent trends in the stocks and flows of HRST
across the European Union. However, in presenting
these trends a few caveats should be emphasised.
Differences in the duration of degrees and national
education systems mean that some data need to be
interpreted with caution. The length of the time series
available also reduces the ability to detect anomalies in
the data. The usual questions related to sample surveys
obviously apply. The sample size in the CLFS does not
allow a detailed HRST analysis for Luxembourg.
Therefore, Luxembourg has been omitted from the
analysis.
1 "Manual on the measurement of Human Resources devoted to
Science & Technology - the Canberra Manual",
(DSTI/EAS/STP/NESTI (94)2), Group of National Experts on
Science and Technology Indicators, OECD, Paris 1995.
2 For the breakdown of occupations see International Standard
Classification of Occupations: 1SCO-88, international Labour
Office, Geneva, 1990.
Stock Indicators
From table 2, we can see that, according to the CLFS,
total HRST in the EU-15 was
roughiy
equivalent to 61.5
million persons. In 1997, of these, 21.7 million (12.9 per
cent of the labour force) had achieved a third level
education and were also working in a S&T occupation
(HRSTC). Over half of all those persons considered
HRST were male (55 per cent). However, when
measured as a proportion of the labour force, the higher
percentage can be noted for females.
Table 2: The stock of EU-HRST (J997, thousands)
1997
EU-15
Total
Male
Female
HRSTE
Excluding
HRSTC
HRSTO
Excluding
HRSTC
HRSTC Total HRST
Total
Labour
Force
HRSTC as %
of Labour
21320
12136
9184
18437
9758
8679
21748
11703
10046
61505
33597
27908
168213
96488
71724
12,9
12,1
14,0
Source: Eurostat
[image:2.595.313.570.617.758.2]Looking at HRST over time and as a proportion of the
labour force gives a better idea of the increasing
importance of HRST. Figure 2 shows that there has
been a general increase in the relative importance of
HRST over time. The lowest level can be observed in
Portugal, which is, moreover, the only EU country where
HRST as a proportion of the labour force has fallen
(20.6 per cent to 19.8 per cent). The Netherlands, on
the other hand, has retained the highest level of HRST
over the period 1994 to 1997.
Figure 2: HRST as a proportion of the labour force (1994, 1997)
Examination of HRSTE (those persons considered
HRST by their education) as a proportion of the labour
force over time reveals a slightly different picture
(Figure 3). Here it increased in every EU country except
Denmark where the level remained the same. Austria,
Italy and Portugal have the lowest levels. But,
considerable growth has been experienced in Ireland
(25.4 per cent to 29.6 per cent).
i
Ί
|
1 9
-1 i
\
[image:3.595.40.565.239.657.2].,
JUU..-
- 1
Figure 3: HRSTE as a proportion of the labour force (1994,1997)
For those that work in a S&T occupation HRSTO
-(Figure 4), it is noteworthy that, in a majority of
countries, the importance of S&T related occupations
has increased over the period 1994 to 1997. France and
Portugal are the only countries where there has been a
reduction. All the other EU member states, where
comparison is possible, have experienced moderate
increases. The highest level is again in the Netherlands
(32 per cent in 1997).
cent to 13.9 per cent and 9 per cent to 11.3 per cent,
respectively).
E m p l o y m e n t Patterns in H R S T
But in what sectors of employment has this growth
occurred? Figures 5 & 6 give a crude indication of
development in Professionals (ISCO 2) and Technicians
(ISCO 3).
Immediately visible is the general increase in almost all
of the countries observed. In the case of Professionals,
Portugal is the only exception. The largest expansion
can be seen in Ireland with an average annual growth
rate of close to 10 per cent. Spain has also undergone a
relatively fast development in Professionals, on average
7.6 per cent per year. Most of the countries have
experienced growth of under 5 per cent.
UK I r a — m m m
wjaa^»wxÍÍj,.ÍUHÍftmj>
Β ΛΙ age I SCO 2 - Professorais
Figure 5:
Average
annua/ growth
in persons employed in
professional occupations - ISCO 2 (¡994, 1997)
IRL H«B..-^<'W^~mÍ-'·:'^!
4% 6% S% 10%
O fil age 'SCO 3 · Tecínraans
Figure 4: HRSTO as a proportion of the labour force (1994, 1997)
Figure 6: Average annual growth in persons employed in technician
occupations - ISCO 3 (1994, 1997)
The number of HRSTC - those who have both third level
education and work in a S&T occupation - has also
increased in every country but Portugal between 1994
and 1997 (Figure 1, cover page). The highest rate can
be observed in Sweden, implying that people there are
more likely to work in a S&T occupation following third
level education than in other EU countries. Ireland and
Spain have experienced the strongest gains (11.3 per
eurostat
For Technicians, the trends do not display the same
ranking. Again, Spain has a high growth rate. And,
moreover, there is a general trend upwards. Beyond
that, Ireland has a much weaker growth rate for
Technicians than for Professionals. France, on the other
hand, has witnessed higher growth in Technician
related jobs than in Professionals. Portugal has also
experienced a contraction in the number of Technicians.
[image:3.595.37.563.486.651.2]Scientists & Engineers
Table 3: Scientists & Engineers in ¡997
1997
Β
DK
D
EL
E
F
IRL
l
c |L
NL
A
ρ
c)
FIN
S
UK
Total
Male
Female
Total
Male
Female
Total
Male
Female
Total
Male
Female
Total
Male
Female
Total
Male
Female
Total
Male
Female
Total
Male
Female
Total
Male
Female
Total
Male
Female
Total
Male
Ferriate
Total
Male
Female
Total
Male
Ferriate
Total
Male
Female
Total
Male
Female
ISCO
21
126.259
109,184
17,076
77.278
66.623
10.655
1,339,497
1,165,761
173.736
59,245
47,949
11,296
220,143
192,500
27,643
650,152
577.009
73,143
52.831
42.616
10.215
180.569
153,330
27,239
247,159
211,416
35.744
36.148
31.505
4,643
43,750
36,880
6.870
81,754
65,287
16,467
126.661
97,369
29,291
1,079,283
945,530
133,753
ISCO
21
(With third level
education)
115.083
99,727
15.356
62,679
53.664
9.015
1,132,842
992,381
140,461
59,028
47,807
11,221
212,017
136,015
26.003
463,622
404,940
58,682
39,362
31,922
7,439
180.569
153.330
27,239
180,798
154,110
26,688
35,177
30,535
4.643
43.750
36,880
6,870
61,671
49.570
12,101
97,779
74,060
23,719
741,318
653,010
88,308
ISCO
22 *'
173.200
49.633
123,567
35,807
17.403
18.403
444,486
276,643
167.842
72,690
46,868
25,822
313,413
124.211
189,202
342,087
206,080
136,007
59,032
12,182
46,850
358,506
237,989
120,517
128,791
57,651
71,140
42,977
26,310
16,668
39,496
22,687
16,809
92,640
15.190
77,450
83,661
26,744
56,917
788,679
213,209
575,470
ISCO
22 *'
(With third level
education)
142,660
47,893
94,767
35,807
17,403
18,403
401,617
251,591
150,026
72,690
46,868
25,822
310,258
121,892
188,367
325,244
196.238
129.006
45,333
10,590
34,743
358,506
237,989
120,517
108,925
52,736
56,189
41,976
25,703
16.Z74
39,496
22,687
16,809
87,393
14,064
73.329
78.187
26.050
52,137
741,059
194,058
547,001
Total S&E
(ISCO 21 &
ISCO 22)
299,459
158,816
140,643
113,085
84,027
29.058
1,783.983
1,442.405
341,578
131,935
94,817
37,118
533,556
3 i e . 7 t 1
216,845
992,239
783,089
209,150
111.863
54,798
57,065
539,075
391.319
147,756
375.951
269,067
106,884
79,125
57,815
21,310
83,246
59,567
23,679
174.393
80,476
93,917
210,321
124,113
86,209
1,867,963
1,158,740
709.223
Annual
average growth
rate 1994-97
b)2.34%
2.79%
1.85%
2.67%
4.08%
-1.02%
3.27%
3.25%
3.35%
1.20%
0.57%
2.86%
7.49%
4.65%
12.28%
1.85%
2.42%
-0.16%
6.68%
7.91%
5.55%
4.99%
4.12%
7.44%
3.33%
2.18%
6.48%
6.83%
9.81%
-0.18%
-4.88%
-2.24%
-10.45%
2.04%
2.73%
0.96%
Total S&E
(With third level
education)
257.743
147.620
110.123
98,485
71.067
27,418
1,534,459
1,243,972
290,487
131,718
94,675
37,043
522.276
307,906
214,369
788,866
601,178
187,688
84,695
42.512
42,182
539,075
391,319
147,756
289,723
206,846
82,877
77,154
56,237
20,917
83,246
59,567
23,679
149,064
63,634
85,430
175,966
100.110
75,856
1,482.377
847,068
635.309
Annual
average growth
r a t e l 994-97
b)2.90%
3.35%
2.31%
0.68%
1.81%
-2.03%
5.34%
5.18%
6.06%
2.25%
1.61%
3.98%
7.95%
4.94%
12.97%
2.01%
2.70%
-0.07%
11.67%
10.83%
12.54%
4.99%
4.12%
7.44%
3.33%
1.45%
8.71%
6.15%
8.60%
0.30%
-4.88%
-2.24%
-10.45%
2.28%
3.07%
1.26%
a) ISCO 22 includes Nursing and Midwifery professionals
b) Average annual growth rate for Austria is from 1995 - 1997
c) For Italy and Portugal, all Scientists and Engineers were classified as having a third level education
Table 3 shows the various levels of employment for
those working either as physical, mathematical and
engineering science professionals (ISCO 21) or as life
science and health professionals (ISCO 22). For most of
the
Member
States,
employment
in
physical,
mathematical and engineering science is characterised
more by males. The opposite is true for life science and
health professionals.
Furthermore, in a majority of cases, annual average
employment growth is higher for core S&E professionals
than
lor
those who may
or may not have
a third
levei
education. The exceptions to this trend are Denmark for
both males and females and the Netherlands and
Austria for males. In six of the Member States for which
data were available, the growth rate (1994-1997) in S&E
employment for those with a third level education is
higher for females than for males.
On the whole, growth displays the same
trends for both
males and females. In Denmark, France and Austria,
however, overall growth is accompanied by a rise in
male and a decline in female S&E employment. In
Austria, this is only true for those persons that may or
may not have a third level education.
Statistics in
focus
—
Theme 9 — 1/2000 ■
m
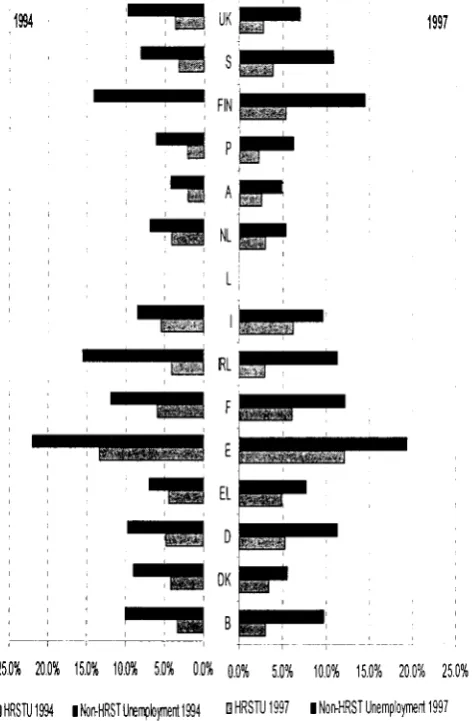
S&T Unemployment in the EU
An overview of the unemployment situation for persons
with a third level education is given in figure 7. It is
noticeable that, with the exception of Spain, France and
Italy, most countries have an HRST unemployment rate
(HRSTU) of between 3 and 5 per cent. In both 1994 and
1997, it is in Austria and Portugal that the lowest levels
are
evident.
Spain
has
the
highest
level
of
unemployment in both 1994 and 1997.
Compared to the unemployment rate for those persons
that do not have a third level education: two distinct
trends for all countries can be observed from the data.
Firstly,
HRST
unemployment
is
always
lower
(significantly
in
many
cases)
than
non-HRST
unemployment. Secondly, a rise in the unemployment
rate for non-HRST tends to be accompanied by a rise in
jobless HRST - and vice-versa - although relative
differences are not shown.
25.0% 20.0% 15.0% 10.0% 5.0% 0.0% 0.0%
5.0% 10.0% 15.0% 20.0% 25.0%
BHRSTU1994
■ rtorvHRST Unerrptoyment 1994
OHRSTU1997
ι Non-HRST Unemployment 1997
Figure 7: HRSTU versus Non-Hrst Unemployment
(25-59year olds, 1994, 1997)
In Greece the difference between the unemployment
rate for HRST and for non-HRST is relatively small (4.5
per cent as compared with 7.0 per cent in 1994 and 4.9
per cent compared with 7.7 per cent in 1997). In Ireland,
on the other hand the unemployment rate for non-HRST
in 1994 is nearly fourfold its HRST counterpart (15.6 per
cent against 4.2 per cent). And in 1997, it is again
Ireland that demonstrates the largest disparity (11.3 per
cent for non-HRST unemployment compared with 3.0
per cent for HRSTU).
Flow Indicators
In order to explain the differences in stock levels,
understanding the flows of HRST is crucial. HRST
stocks are supplied by two key flows: the inflows to
HRST from the education system and flows through
migration/mobility. Education flows can be ascertained
largely from existing data, whereas data on mobility or
migratory flows is less clear. For this reason, only
education is considered here.
F IRL I L NL
31994 H1995 D1996 Q1997
eurostat
[image:5.595.300.556.258.414.2]1997 data for Belgium refer to Flemish Community only
Figure 8: Participation in tertiary education as a percentage
of persons aged 20-29 (1994-1997)
There has been considerable growth in the higher
education systems of the EU. To put this into
perspective, figure 8 demonstrates the proportion of
young people participating in tertiary education as a
percentage of persons aged 20-29. This reveals that
there has been a general overall rise in participation
levels in tertiary education.
Participation rates do not, on their own, give a
comprehensive picture of flows into HRST. Rather they
serve to illustrate
potential
HRST inflows. These figures
should therefore be complemented by graduation rates
(table 4).
Firstly, lower graduation rates in certain EU countries
such as Austria and Italy can be partly explained by the
longer duration of tertiary studies. Therefore, to a
certain extent, comparability of education should be
made with caution.
Closer scrutiny of table 4 reveals rising overall
graduation rates. However, this trend is not uniform
across all Member States for which data is available.
Between the academic years 1993/94 and 1996/7,
overall graduation rates have fallen only in Italy, and
remained the same in Finland.
[image:5.595.45.282.316.677.2]The highest graduation rates for both males and
females as a proportion of the 25-29 year old population
are witnessed in France and Ireland.
Another noticeable feature is that graduation rates are,
except for Germany and Greece, higher for females
than they are for males over the whole time period.
Table 4: Graduation rates from higher education as a proportion oj
25-29year olds (1994-1997)
Β DK 0 E L E F IRL I L N L A Ρ FIN S UK 1994 8 1 6.2 4.3 4.1 5.8
' 2 . 2
4.8 5,5 2.7 6.5 10.2 6.8 1 0 5
Graduation (rom higher educalior Females 1995 6,1 4.9 4,8 7.2 13,7 4,3 6,0 2 9 7 4 9 4 6 4 11,2 1996 8,4 5.1 4.4 8,1 15,9 12.4 4.1 7,1 2.9 8.1 9,5 6.1 10,4 1997
5 6 " 9.1 5 4 "
3,9 9.6 14,6 13 7 " 4 1 "
7 1 "
3,4 9,2 10.2 6,9 11,1 1994 7,4 5.3 5,1 3,4 4.6 11,6 3.7 5,9 2.6 4.2 7,2 4 1
^J
Graduation from hKjher educalior
M a 1995 7.2 5,7 4,1 5.3 13.1 3,4 6,1 2.6 4,7 6,9 4,6 9,4 es 1996 7.3 5.7 3.9 6.0 11.8 12,6 3,2 6.7 2,7 4.6 6.9 4.5 9.5 1997
5 7 "
7 4 6 . 0 " 4.3 6,4 11,5 1 2 9 ·1
3 2 "
6 6 "
3,1 5.0 7,1 4.8 9,7 1994 7,7 5.7 4.7 3.8 5,2 11.9 4,2 5,7 2.6 5,4 8,7 5,4 10,1
Graduation Irom higher ec ucalior
Total 1995 7,7 5.3 4.5 6,2 13.4 3,9 6,1 2.7 6.1 8,1 5 5 10,3 1996 7.8 5,4 4.2 7.0 15,9 1 2 5 3,7 6,9 2.8 6.4 8,2 5,3 9.9 1997
5 4 "
8.2 5 7 "
4.1 7,9
15.1 13 3 " 3 7 "
6 8 "
3,3 7.1 8,7 5.8 10.4
a) Flemish community only
b) 1995Π 996 dala
c) Includes studente νΛιο graduated a second time at Bie same ISCED level (approx. 4 0) Excludes a number of students at ISCED 5 who r e c e l é e professional qualifications from various professíonnaí bodies (accourtracy, marketing and seaelartal)
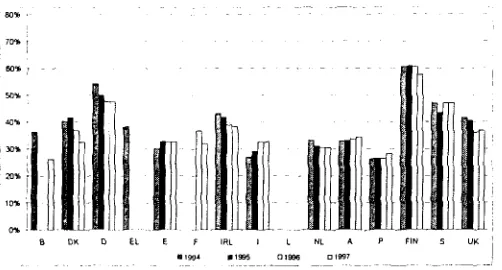
Science and Engineering
Graduates of science and engineering programmes
may often become a key component in a country's
technological and economic performance.
1997 data for Belgium refer to Flemish Community only
Figure 9: Proportion of graduates with S&E degrees (1994-1997)
Figure 9 shows the recent trends in the proportion of
science
and
engineering
graduates
across
the
European Union.
3
Immediately visible is that there is a downward bias:
3
This definition includes the following disciplines: Natural science,
Mathematics, Computer science, Medical science, Engineering and
Architecture, and can be found in the Eurostat publication
Education
at a Glance.
discounting Belgium for which '97 data refer to the
Flemish Community only, there has been a reduction in
8 of the 12 countries for which a time series is available,
with particularly marked declines in Denmark, Germany
and the UK. Spain, Italy and Austria, on the other hand,
have witnessed marginal increases.
Finland has by far the highest proportion of graduates
obtaining degrees in science and engineering related
subjects (60 per cent in 1996). Furthermore, over the
period of analysis, very little change has occurred.
Germany and Sweden also have a comparatively high
proportion of science and engineering graduates (48
and
47
per cent in 1997, respectively).
Conclusions and Future Work
There has been a general rise in the stocks of HRST
across the European Union. This is partly a result of
increases in the number of professional and technician
level jobs, and partly a result of a flourishing number of
graduates.
Despite general improvements in the measurement of
HRST, still some caveats remain. For example, data
availability
makes
it difficult
to
present
EU-15
aggregated information for some indicators. But, as the
time series grows longer, it becomes easier to identify,
and consequently iron out, any queries.
As with any sample survey, results are subject to
sampling and other errors. Sample size limitations of the
CLFS also imply that the level of disaggregation is
sometimes restricted. However, the nature of the CLFS
does mean that the results are rather harmonised,
improving international comparability.
In the near future, a field of study variable will be
introduced to the CLFS as an additional,
ad hoc
question. This will allow a far more detailed analysis of
the types of educational backgrounds across the
different Member States of the European Union.
Another improvement may come about with the
collection of data using the revised version of ISCED,
allowing more emphasis on doctoral level personnel.
Extending the data series beyond the EU-15 Member
States, for example to include both the accession
countries and the other EEA countries, could prove a
valuable exercise also.
Some further recent and related research has
concentrated on developing indicators on the mobility of
these
highly
qualified
persons.
Hitherto,
initial
developments in the measurement of domestic mobility
have been achieved, but not for international mobility,
which remains more problematic. These will be further
developed in the near future.
Statistics in focus
— Theme 9 — 1/2000 ·
m
[image:6.595.50.301.435.570.2]> ESSENTIAL INFORMATION - METHODOLOGICAL NOTES
NOTES/ABBREVIATIONS
HRST
Human Resources in Science and Technology
HRSTE
Human Resources in Science and Technology Education
HRSTO
Human Resources in Science and Technology Occupation
HRSTC
Human Resources in Science and Technology Core
HRSTI
Human Resources in Science and Technology Inactive
HRSTU
Human Resources in Science and Technology Unemployed
HRSTN
Human Resources in Science and Technology employed in a non S&T occupation
HRSTW
Human Resources in Science and Technology without third level education
CLFS
Community Labour Force Survey
ISCED
International Standard Classification of Education
ISCO
International Standard Classification of Occupation
HUMAN RESOURCES IN SCIENCE AND TECHNOLOGY (HRST)
HRST are people who fulfil one or other of the following conditions:
■
successfully completed education at the third level in an S&T field of study
■
not formally qualified as above but employed in a S&T occupation where the above qualifications are normally required.
T H E INTERNATIONAL STANDARD CLASSIFICATION OF EDUCATION (ISCED)
Designed to compile and present internationally comparable education indicators, statistics on education at the tertiary level are classified in three
categories: ISCED 5, 6, and 7 (1976 version):
ISCED level 5
■
education at the third level, first stage, of the type that leads to an award not equivalent to a first university
degree
ISCED level 6
■
education at the third level, first stage, of the type that leads to a first university degree or equivalent
ISCED level 7
■
education at the third level, first stage, of the type that leads to a postgraduate university degree or
equivalent
T H E INTERNATIONAL STANDARD CLASSIFICATION OF OCCUPATIONS (ISCO)
ISCO 1 (legislators, senior officials
■
occupations whose main tasks consist of... planning, directing and co-ordinating the policies and activities of
and managers)
enterprises and organisations, or departments.
ISCO 2 (professionals)
■
occupations whose main tasks require a high level of professional knowledge and experience in the fields of
physical and life sciences, or social sciences and humanities.
ISCO 21
■
Physical, mathematical and engineering science professionals
ISCO 22
>
Life science and health professionals
ISCO 3 (technicians and associate
■
occupations whose main tasks require technical knowledge and experience in one or more fields of physical
professionals)
and life sciences, or social sciences and humanities.
CANBERRA MANUAL
Prepared jointly by the OECD and the European Commission / Eurostat, this manual is intended to provide guidelines for the measurement of Human
Resources devoted to Science and Technology (HRST) and the analysis of such data. The work was carried out in response to policy needs and priority
issues identified by these and other organisations.
Further information:
Databases
New Cronos: T h e m e 9
Domain: HRST
To obtain information or to order publications, databases and special sets of data, please contact the Data S h o p network:
B E L G I Q U E / B E L G I Ë D A N M A R K D E U T S C H L A N D E S P A N A F R A N C E I T A L I A - R o m a Eurostat Data Shop
Bnjxelles/B russel Planlstat Belgique 124 Rue du Commerce Handelsstraat 124
B-1000 BRUXELLES/BRUSSEL
Tel. (32-2) 234 67 50
Fax (32-2) 234 67 51 E-Mail: datashop@planistatbe
I T A L I A - M i l a n o ISTAT
Ufficio Regionale per la Lombardia Eurostat Data Shop
Via Fieno 3 1-20123 MILANO
Tel. (39-02) 8061 32460
Fax (39-02) 806t 32304 E-mail: mileuro@tin.it
DANMARKS STATISTIK Bibliotek og Information Eurostat Data Shop Sejrøgade 11 DK-2100 KØBENHAVN 0 Tel. (45-39) 17 30 30 Fax (45-39) 17 30 03 E-Mail: bib@dstdk
STATISTISCHES BUNDESAMT Eurostat Data Shop Berlin Otto-Braun-Strafie 70-72 D-10178 8ERUN Tel. (49-30) 23 24 64 27/28 Fax (49-30) 23 24 64 30 E-Mail:
datashop@staostik-bund.de
INE Eurostat Data Shop Paseo de la Castellana, 183 Oficina 0O9
Entrada por Estébanez Calderón E-28046 MADRID
Tel. (34-91) 583 91 67 Fax (34-91) 579 71 20 E-Mail: datashop.eurostat@ine.es
LUXEMBOURG
NEDERLAND
NORGE
INSEE Info Service Eurostat Data Shop 195. rue de Bercy Tour Gamma A F-75582 PARIS CEDEX 12 Tel. (33-1)5317 88 44 Fax (33-1) 53 17 88 22 E-Mail: datashop@insee.fr
P O R T U G A L
ISTAT
Centro di Informazione Statistica Sede di Roma, Eurostat Data Shop Via Cesare Balbo, 11 a 1-00184 ROMA Tel. (39-06) 46 73 31 02/06 Fax (39-06) 46 73 31 01/07 E-Mail: dipdiff@istat.it
S C H W E I Z / S U I S S E / S V I Z Z E R A Eurostat Data Shop Luxembourg
BP 453
L-2014 LUXEMBOURG 4. rue A. Weicker L-2721 LUXEMBOURG
Tel.(352)43 35 22 51
Fax (352) 43 35 22 221 E-Mail: dslux@eurostaLdatashop.lu
STATISTICS NETHERLANDS Eurostat Data Shop-Voortourg pò box 4000
2270 JM VOORBURG Nederland
Tel. (31-70)337 49 00
Fax (31-70) 337 59 84 E-Mail: datashop@cbs.nl
Statistics Norway Library and Information Centre Eurostat Data Shop Kongens gate 6 P. b. 8131, dep. N-0033 OSLO Tel. (47-22)86 46 43 Fax (47-22) 86 45 04 E-Mail: datashop@ssb.no
Eurostat Data Shop Lisboa INEJServiço de Difusão Av. António José de Almeida, 2 P-1000-043 LISBOA Tel. (351-21)842 6100 Fax (351-21)842 63 64 E-Mail: data.shop@ine.pt
Statistisches Amt des Kantons Zürich, Eurostat Data Shop Bleicherweg 5
CH-8090 Zürich Tel. (41-1)2251212 Fax (41-1) 225 12 99 E-Mail: datashop@zh.ch Internetadresse: http://www.zh.ch/stalistik
S U O I M I / F I N L A N D S V E R I G E U N I T E D K I N G D O M U N I T E D K I N G D O M U N I T E D S T A T E S O F A M E R I C A Eurostat Data Shop Helsinki
Tilastokirjasto Posiosoile PL 2B
Käyntiosoite: Työpajakatu 13 B, 2 krs FIN-00022 Tilastokeskus
Tel. (358-9) 17 34 22 21
Fax (358-9) 17 34 22 79
S-postj datashcp Ulastokesku5@tllas!ol<eskus fi Internetadresse'
http/rwww tilastokeskus MkAk'datashop html
STATISTICS SWEDEN Information service Eurostat Data Shop Karlavägen 100-Box 24 300 S-104 51 STOCKHOLM Tel. (46-8) 50 69 48 01 Fax (46-8) 50 69 48 99 E-Mail: infoservice@scb se URL: http://www.scb.se/info/datashop/ eudatashop.asp
Eurostat Data Shop Enquiries & advice and publications
Office for National Statistics Customers & Electronic Services Unit 1 Drummond Gate - B1/05 UK-LONDON SW1V 2QQ Tel. (44-171) 533 56 76 Fax (44-1633) 812 762 E-Mail: eurostatdatashop@ons.gov.uk
Eurostat Data Shop Electronic Data Extractions, Enquiries & advice - R.CADE Unit ILMountjoy Research Centre University of Durham UK - DURHAM DH1 3SW Tel: (44-191) 374 7350 Fax: (44-191) 384 4971 E-Mail: r-cade(5)dur.ac uk URL: http://www-rcade.dur.ac.uk
HAVER ANALYTICS Eurostat Data Shop 60 East 42nd Street Suite 3310
USA-NEWYORK, NY 10165 Tel. (1-212)986 93 00 Fax (1-212) 986 58 57 E-Mail: eurodata@haver.com
Media Support Eurostat (for professional journalists only).
Bech Building Office A3/48 · L-2923 Luxembourg ■ Tel. (352) 4301 33408 · Fax (352) 4301 32649 ■ e-mail: media.support@cec.eu.int
For information on methodology
Ibrahim Laafia / Alex Stimpson, Eurostat/A4, L-2920 Luxembourg, Tel. (352) 4301 34462, Fax (352) 4301-34149,
E-mail: ibrahim.laafia@cec.eu.int
O R I G I N A L : English
Please visit our web site at
www.europa.eu.int/comm/eurostat/
for further information!
A list of worldwide sales outlets is available at the
Office for Official Publications of the European Communities.
2 rue Mercier - L-2985 LuxembourgTel. (352) 2929 42118 Fax (352) 2529 42709 Internet Address http://eur-op.eu.intrfi7general/s-ad.htm e-mail: info.info@cec.eu.int
BELGIQUEÆELGIÉ - DANMARK - DEUTSCHLAND - GREECE/ELLADA - ESPANA - FRANCE - IRELAND - ITALIA - LUXEMBOURG - NEDERLAND - ÖSTERREICH PORTUGAL - SUOMI/FINLAND - SVERIGE - UNITED KINGDOM - ISLAND - NORGE - SCHWEIZ/SUISSE/SVIZZERA - BALGARIJA - C E S K A REPUBLIKA - CYPRUS EESTI - HRVATSKA - MAGYARORSZAG - MALTA - POLSKA - ROMANIA - RUSSIA - SLOVAKIA - SLOVENIA - TÜRKIYE - AUSTRALIA - CANADA - EGYPT - INDIA ISRAËL - JAPAN - MALAYSIA - P H I L I P P I N E S - SOUTH KOREA - THAILAND - UNITED STATES OF AMERICA