EVALUATING THE IMPACT OF ELIGIBILITY FOR FREE CARE ON THE
USE OF GP SERVICES IN IRELAND: A DIFFERENCE-IN-DIFFERENCE
MATCHING APPROACH
Anne Nolan
Working Paper No. 25
Research Programme on “Health Services, Health Inequalities and Health and Social Gain”
This programme is supported by the Health Research Board, and is being carried out by researchers at the Economic and Social Research Institute (ESRI), University College
Dublin and the University of Ulster.
•
Working Papers are not for publication and should not be quoted without the prior permission of the author(s)
•
ABSTRACT
In Ireland, approximately 30 per cent of the population (“medical card patients”) are entitled to free GP care while the remaining 70 per cent (“private patients”) must pay the full cost of each visit. While previous research has analysed the effect of this system on GP visiting patterns using regression methods, to date, no attempt has been made to apply techniques from the treatment evaluation literature to this issue. Treatment evaluation techniques are commonly employed when observations are not randomly assigned to treatment and control groups; this is certainly the case here, as the primary criterion for medical card eligibility is an income below a specified income threshold (and individuals may also be granted medical cards for other reasons such as chronic ill-health). In this paper, we extend previous Irish research, which has analysed the effect of medical card eligibility on GP visiting using regression methods, to consider the use of difference-in-difference matching methods, which allow us to control for non-random selection into treatment and control groups, as well as unobserved differences in characteristics between individuals in both groups. The results are largely consistent with earlier results using pooled cross-sectional and panel data, and confirm that medical card eligibility exerts a significant effect on GP visiting, even after controlling for observed and unobserved differences in characteristics between medical card and private patients.
1 INTRODUCTION
In Ireland, approximately 30 per cent of the population (medical card patients) are entitled to free GP care, while the remaining 70 per cent (private patients) must pay the full cost. Eligibility for a medical card is primarily decided on the basis of an income means test, but individuals may also be granted a medical card on the basis of age (since July 2001, all over 70s are automatically entitled to a medical card), particular health needs or participation in certain
sponsored employment and training schemes. Previous research in Ireland using regression methods has confirmed that even after controlling for differences in socio-economic and health status characteristics between medical card and private patients, medical card patients have significantly higher GP visiting rates than private patients (see Tussing, 1983 and 1985, Nolan, 1991 and 1993, Madden et al., 2005, Nolan, 2006 and Nolan and Nolan, 2006). The purpose of this paper is to extend previous research on the effect of medical card eligibility on GP visiting by applying techniques from the treatment evaluation literature to this issue. A further extension is afforded by the use of longitudinal data, which allows us to follow the same individuals through time (and thereby compare those who change their medical card status over the period with those who do not).
example, Dehejia and Wahba, 1999, Heckman et al., 1999, Conniffe et al., 2000, Bryson et al., 2002 and Lechner and Vazquez-Alvarez, 2003).
The standard means of isolating the independent effect of treatment is to control for observable differences between treated and control observations using regression methods. However, the imposition of functional form assumptions, as well as the possibility of insufficient common support (i.e., for any set of values of the independent variables, there may be insufficient numbers of both treated and control observations) means that such methods are not without problems (see LaLonde, 1986). Alternative solutions to the sample selection problem such as the Heckman sample selection estimator or the use of instrumental variables estimation rely heavily on the identification of suitable instruments, i.e., variables that affect the probability of receiving the treatment, but not the subsequent outcome of interest. In our case, it is difficult to identify a factor that would be correlated with receipt of a medical card, but unrelated to the use of GP services. For this reason, we concentrate in this paper on the application of matching methods to the evaluation of the effect of medical card status on GP visiting patterns.
By first differencing our outcome measure, we also control for time-invariant unobservable differences between treatment and control observations.
Section 2 provides more detail on medical card eligibility in Ireland, and previous research in the area. Section 3 describes the methodology employed, while Section 4 introduces the data set and explains how the treatment and control groups are constructed. Section 5 discusses empirical results and Section 6 summarises and concludes.
2 CONTEXT AND PREVIOUS RESEARCH
While the majority of those who are granted a medical card qualify on the basis on an income means test, individuals may also qualify on the basis of age, particular health needs and participation in approved Government training and employment schemes. The income thresholds for a medical card are set nationally and updated annually in line with inflation. In 2001 (the latest period for which we have data), the weekly income thresholds for a medical card were €126.97 for a single person, €183.47 for a married couple and €229.19 for a married couple with two children aged 16 years or younger. The limits increase for those aged 66 years and over (e.g. for a married couple the limit increases to €205.69).1 From 1 July 2001, all individuals aged 70 years and over are also entitled to a medical card, regardless of income. In special circumstances (e.g. those who contracted Hepatitis C directly or indirectly from the use of contaminated blood products administered by the state), an individual who is otherwise ineligible on the basis of income or age may be granted a medical card. Finally, individuals who previously held a medical card but who participate in various Government approved training and employment schemes (designed to encourage the long-term employed and economically inactive to enter into employment) are allowed to retain their medical card for a period following their entry onto these schemes (the maximum period is four years). Individuals apply to their local Health Service
1
Executive Area for a medical card. Medical card patients receive all public health services free of charge, including GP consultations and prescribed medicines. The remainder of the population must pay in full for each GP consultation, and for all prescribed medicines up to a monthly limit (€53 in 2001).
The proportion of the population with a medical card has fallen consistently over the 1990s, as a result of rising employment and average earnings. For the period under review in this paper (1995-2001), the proportion of the population with a medical card fell from 35.5 per cent to 31.2 per cent (General Medical Services Payments Board, various issues). However, it is unclear what proportion of those with a medical card qualify for reasons other than income or age (see Comhairle, 2004).2 Much recent discussion has focussed on this fall in the numbers granted a medical card, and the failure of the income guidelines to rise in line with average earnings. In part in response to these concerns, the income thresholds for a medical card were raised substantially in October 2005, and a new “GP only” medical card introduced. The “GP only” medical card covers the cost of GP consultations only (i.e., not the associated prescription costs) and the income thresholds are now 50 per cent higher than those for the standard medical card. For this paper however, we are concerned only with the effect of eligibility for the standard medical card on GP visiting patterns.
Previous research in Ireland has confirmed that there are significantly higher GP visiting rates among medical card patients, even after controlling for a variety of individual and household socio-economic and health status characteristics (see Tussing, 1983 and 1985, Nolan, 1991 and 1993, Madden et al., 2005, Nolan, 2006 and Nolan and Nolan, 2006). Using the same data-set as we employ here, the average number of GP visits per annum for medical card and private patients (averaged over the period 1995-2001) was 6.5 and 2.4 respectively, an unadjusted difference of
2
4.1 extra GP visits per annum on the part of medical card patients. Of course, medical card patients differ significantly from private patients in terms of many characteristics, most notably income and health status. Using various regression methods and the same data source that we use in this paper, the estimates of the effect of medical card eligibility on GP visiting range from 1.8 extra GP visits per annum using pooled cross-section data from 1995-2001, to 1.5 extra GP visits per annum using pooled cross-section data from 19873, 1995 and 2001 (Madden et al., 2005). Using longitudinal data, which distinguishes between current and permanent medical card eligibility and allows us to control for observed as well as unobserved variation in characteristics across the population, the effects are 0.3 and 0.6 extra GP visits per annum for current and permanent medical card eligibility respectively (Nolan, 2006). The difference in financial incentives between medical card patients, who face only the time and travel costs of GP visits, and private patients, who must also pay for the consultation out of pocket, clearly contributes to these results.4
3 PROPENSITY SCORE MATCHING
In this paper, we use a propensity score matching approach to estimate the effect of medical card eligibility on GP visiting. In the absence of experimental data, the essential problem is one of sample selection; individuals who receive the treatment may be substantially different to those not receiving the treatment and thus standard regression estimation methods may produce biased estimates of the effect of the treatment on the outcome of interest. By matching treatment and control observations that are similar in terms of observed characteristics, the propensity score matching method produces unbiased estimates of the effect of the treatment (in our case, medical card status) on the outcome of interest (the number of GP visits per annum). However, standard
3
The 1987 Survey of Income Distribution, Poverty and Usage of State Services was conducted in a similar manner and contains similar information to that contained in the later 1995-2001 Living in Ireland Surveys (see also Section 4).
4
propensity score approaches cannot deal with the possibility that there may also be certain unobserved differences in characteristics between treatment and control observations (e.g., time preference rates, attitudes towards medical care, etc.). We therefore extend the standard propensity score approach to consider a difference-in-difference propensity score estimator, which takes first differences of the outcomes for the treated and control observations and thereby removes any variation in time-invariant unobserved characteristics between treatment and control observations. This assumes that treatment and control groups are affected in the same way by the same macro shocks between treatment and control periods, and that any unobservable differences in characteristics between treatment and control groups are constant over time and thus eliminated when we take first differences of the outcomes. This approach was first developed by Heckman et al., 1997 in an application analysing the labour market outcomes of participants in a training programme for disadvantaged workers and subsequently applied in a number of different contexts (see Blundell and Costas Dias, 2000, Lechner and Vazquez-Alvarez, 2003, Garcia Gomez and Lopez Nicolas, 2005, Görg and Strobl, 2005, Trujillo et al., 2005 and Aassve et al., 2006).
Assume that each individual i has two potential outcomes, (treatment, i.e., medical card) and
(control, i.e., private). The average effect of the treatment is given by . However,
as we cannot observe and simultaneously for the same individual, we rely instead on the
average treatment effect on the treated (ATET):
1 i
Y
0 i
Y E
(
Yi1−Yi0)
)
0 iY Yi1
(
Y |D 1)
E(
Y |D 1E i1 i = − i0 i = (1)
where is the dichotomous indicator of treatment, with 1 indicating that individual receives
the treatment, and 0 otherwise. Of course, we need to identify the second part of expression (1). If we assume conditional independence between treatment and outcomes, i.e., given a set of
observable characteristics , the outcomes of the non-treated group are what the treated
i
D i
i
outcomes would have been had they not been treated (selection occurs only on observable characteristics), then the following also holds:
(
Y |X ,D 1) (
EY |X ,D 0)
0E i0 i i = − i0 i i = = (2)
and an unbiased estimate of the ATET can be obtained from:
(
Y |X ,D 1) (
EY |X ,D 0)
E i1 i i = − i0 i i = (3)
Due to the practical difficulties involved in matching observations when there are a large number of covariates, Rosenbaum and Rubin, 1983 showed that summarising the observed characteristics of each observation into a single index (the propensity score, i.e., the predicted probability of participation in the treatment) makes matching feasible (Becker and Ichino, 2002). We therefore first estimate the probability of receiving the treatment, conditional on a vector of pre-treatment characteristics X :
(
D 1)
F(
XP i = =
)
(4)where is usually the cumulative standard normal distribution function (i.e., a probit model).
Propensity score matching entails modelling the probability of participation, calculating the predicted probability of participation for each individual (the propensity score) and matching individuals with similar propensity scores.
()
. Fbetween the treated and control observations is computed, and averaged over all observations to gain an estimate of the average treatment effect. However, a disadvantage of the nearest neighbour method is that while some matches may be poor (i.e., dissimilar propensity scores), they still contribute to the calculation of the average treatment effect. A variant of nearest neighbour matching is calliper matching, whereby a control observation with a propensity score falling within a specified range of the propensity score of a treated observation is considered a match. Hence, in moving from the nearest neighbour to the calliper method the quality of the matches is improved, but at a cost of fewer observations (Bryson et al., 2002). Nearest neighbour and calliper matching can be extended to allow for multiple matches for each treated observation, thus considering matches of a slightly poorer quality. Radius matching extends the calliper matching technique to consider all possible matches (i.e., not just nearest neighbour matches) within the specified range of the propensity score. The smaller the dimension of the radius, the stronger the possibility that some treated observations will not be treated but the better is the quality of the matches. With kernel matching, treated observations are matched with a weighted average of all controls with weights that are inversely proportional to the distance between propensity scores of treated and controls. This means that exact matches get a large weight, and poorer matches a smaller weight (Becker and Ichino, 2002).
neighbour method, we implement one-to-one matching (with and without calliper), and we also allow for multiple matches (again, with and without calliper). In all cases, we impose the common support condition, as this may improve the quality of the matches used to estimate the average treatment effect (Becker and Ichino, 2002), although in practice very few observations do not satisfy this condition. We also match with replacement, meaning that a control observation can be a match for more than one treated unit. Standard errors are obtained by bootstrapping, with 50 iterations found to produce stable results. The models are all estimated using the PSMATCH2 command in Stata Version 9.0
4 DATA
We use data from the Living in Ireland Survey, which was carried out by the Economic and Social Research Institute (ESRI) and constitutes the Irish component of the European Community Household Panel (ECHP). The ECHP began in 1994 and ended in 2001. It involved an annual survey of a representative sample of private households and individuals aged 16 years and over in each EU member state, based on standardised individual and household questionnaires. In addition to information on a variety of individual socio-economic characteristics, the individual questionnaires also contain information on health services utilisation in the previous year (GP, specialist, dentist and optician visits as well as number of nights in hospital) and measures of the extent and nature of physical and psychological health problems. As the number of GP visits is not separately identified from the number of visits to medical specialists, dentists and opticians in 1994, we confine our analysis to the years 1995 to 2001 inclusive.
take a longer perspective than the standard two time periods, and construct treatment and control groups based on four years of data5, as illustrated in Tables 1 and 2. Treatment occurs sometime between t=2 and t=3. As we have at most seven years of data (1995-2001 inclusive), this means that we have four sequences of time periods (1995-1998, 1996-1999, 1997-2000, 1998-2001). We consider two sets of treatment and control groups:
• those who gain a medical card over the period, in comparison with those who remain without
a medical card over the period (i.e., PPMM vs. PPPP, where P refers to private patient and M refers to medical card patient)
• those who lose a medical card over the period, in comparison with those who remain with a
medical card over the period (i.e., MMPP vs. MMMM)
In both cases, the outcome variable is the change in GP visits between t=4 and t=2 (as the former refers to GP visiting in the period between t=3 and t=4, and the latter refers to GP visiting in the period between t=1 and t=2). As the number of treatment observations for each sequence of years is small, and the estimated results are largely insignificant6, we pool the four time periods and base our discussion of empirical results on these estimates (see Section 5).
[insert Tables 1 and 2 here]
We delete observations for which information on variables of interest are missing, as well as observations where GP visits in excess of 52 per annum were recorded.7 As we construct our treatment and control groups using four consecutive years of data, this necessarily reduces the sample sizes for estimation. The last three rows of Tables 4 and 5 illustrate the sample sizes for each matching procedure. As expected, the control groups are considerably larger than the
5
See Lechner and Vazquez-Alvarez (2003) for a similar construction of treatment and control groups in the context of quantifying the effect of disability on labour market outcomes.
6
Results are available on request from the author. 7
treatment groups, and the treatment groups for the case of losing a medical card (i.e., MMPP) are larger than those for gaining a medical card (i.e., PPMM), consistent with trends in medical card eligibility at the aggregate level over the period (see also Section 2).
We match observations on the basis of their estimated propensity score (see Section 3). The propensity score is calculated on the basis of pre-treatment characteristics, i.e., measured at t=1. The characteristics used in the calculation of the propensity score correspond to the demographic/socio-economic characteristics of the individual, as well as their observed health status. Age is represented by a categorical variable with six indicators of 10-year groups (age 16-24, age 25-34, age 35-44, age 45-54, age 55-64, age 65+). Gender is represented by a dummy
variable (female). Household location is summarised by a dummy variable (rural), which classifies individuals based on the location of their household (rural households are those that reside in open countryside or a village with 200-1,499 inhabitants while urban households are those that reside in towns with 1,500 or more inhabitants or in the major cities of Dublin, Cork, Galway, Waterford or Limerick). A four-category variable summarises the highest level of education obtained by the individual: primary level education (the reference category), lower second level (lower secondary), upper second level (upper secondary) and third level (third level). All individuals are classified into three mutually exclusive employment status groups,
from “any chronic, physical or mental health problem, illness or disability” is included. Scores from the General Health Questionnaire (GHQ) are used to construct a dichotomous variable indicating psychological health status (stress). The GHQ contains twelve questions relating to psychological health status. For the six positive statements (e.g. “have you recently been able to concentrate on what you’re doing?”), a person scores one if they answer “less than usual” or “much less than usual” while for the six negative statements (e.g. “have you recently lost much sleep over worry?”), a person scores one if they answer “more than usual” or “much more than usual”. These scores are added up and anyone scoring above the conventional threshold of two is considered to be in psychological distress (see also Nolan, 1991).
5 EMPIRICAL RESULTS
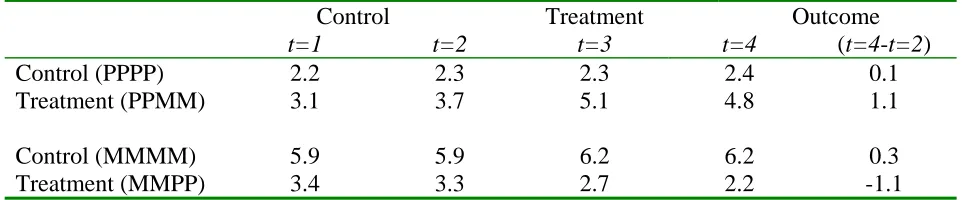
Before discussing estimation results, Table 3 presents the average number of GP visits per annum for both transitions that we consider (i.e., gaining or losing a medical card). Using the pooled data, the statistics indicate that on average, the change in GP visiting is greater for treatment observations with little change in GP visiting patterns among control observations. In addition, the changes in annual GP visiting rates among treatment groups are in the direction expected, and of similar magnitudes. The propensity score method refines this comparison by only comparing outcomes for treatment and control observations that have similar propensity scores, using various proximity criteria (nearest neighbour, radius etc.). This ensures that we are comparing outcomes for observations that are similar in every observable respect expect their exposure to the treatment.
[insert Table 3 here]
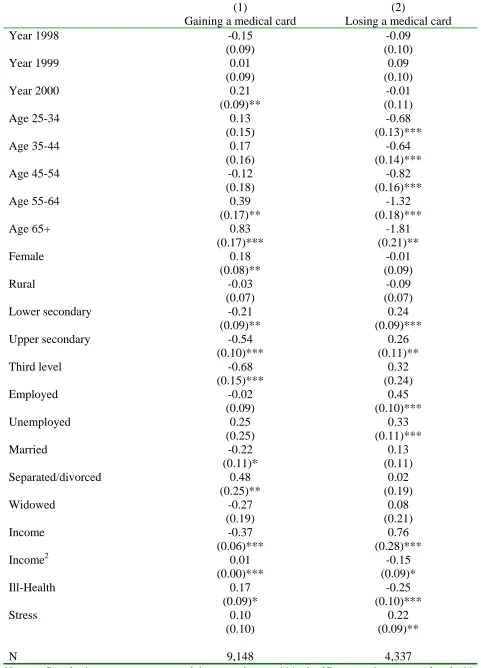
calculate the propensity score, suggest that participation in the treatment (i.e., gaining a medical card) is significantly associated with a variety of pre-treatment characteristics including age, education level, labour force status, marital status, household equivalised income and health status. As the number of treatment observations for each individual sequence of years is small, we rely on the estimates from the pooled model (see column (1) in Table 4).8 The balancing property9 is not satisfied for the radius matching method so we concentrate on the estimates from the nearest neighbour and kernel matching methods.
[insert Tables 4 and 5 here]
The nearest neighbour and kernel estimates of the ATET range from 0.9 to 1.3 extra GP visits per annum, and all estimates of the ATET are significant. As the pre-treatment average number of GP visits per annum for treated observations was approximately 3.3 GP visits (see Table 3), this means that the effect of gaining a medical card is to increase the annual number of GP visits by between approximately 27 per cent and 39 per cent per annum. While there are no clear criteria for choosing one method over another (see also Bryson et al., 2002), it is clear that the different methods involve trade-offs between the quality and quantity of the matches. For example, when we match within a defined calliper, the estimate from the nearest neighbour methods become more significant. Even when we increase the number of possible matches (i.e., increase k), the calliper method produces very similar results (ranging from 1.1 extra GP visits per annum to 1.3 extra GP visits per annum). The kernel estimate is the same as that for the one-to-one nearest neighbour estimate within calliper, and this is consistent with the fact that all possible matches are considered but are weighted in accordance with the difference in propensity scores (i.e., exact
8
Separate estimates for each of the four sequences are available on request from the author. 9
matches are given a large weight, and poor matches a small weight). In effect, by increasing k and matching within calliper or by using the kernel method, we can consider a wider range of possible matches, yet control the quality of those matches. For this reason, we regard the estimates of the ATET from the nearest neighbour within calliper and kernel methods as most accurate.
For those losing a medical card (i.e., MMPP vs. MMMM), we follow the same procedure in estimating the ATET. The estimation results from the binary probit model of participation in treatment are presented in column (2) of Table 4 and illustrate that losing a medical card is negatively related to age, rural location and ill-health but positively related to higher levels of education, being in the labour force and household income. Matching estimation results are presented in column (2) of Table 5. Once again, the balancing property is not satisfied when using the radius matching method, so we focus on the results using the nearest neighbour and kernel matching methods. The results, all of which are significant, range from 1.1 fewer GP visits per annum to 1.6 fewer GP visits per annum. As the pre-treatment average number of GP visits per annum for treated observations was approximately 3.3 GP visits per annum (see Table 3), this means that the effect of losing a medical card is to reduce the average number of annual GP visits by approximately 33-49 per cent.
In terms of policy implications, the crucial question is not whether charges deter visiting (as all the available evidence, including our own, shows that they do), but rather whether charges deter necessary, as well as unnecessary, GP visits. Research from the RAND Health Insurance Experiment suggested that increasing levels of charges deter necessary as well as unnecessary consultations with primary care doctors, but perhaps paradoxically, there was little impact in terms of health status (Keeler, 1992). Unfortunately, we do not have any information on the “right” or most appropriate level of GP visiting, from either a medical, social or economic cost-effectiveness point of view. Information from two recent population surveys provides conflicting evidence on the extent to which individuals forego self-perceived “necessary” health consultations due to cost. Data from the EU-Statistics on Income and Living Conditions in 2004 illustrate that only 1.1 per cent of the population reported that, in the previous year, there was a time when they needed a medical examination or treatment for a health problem but did not receive it due to cost (with a slightly higher, but still very low, 1.6 per cent of private patients foregoing a health consultation due to cost). This would suggest that despite much commentary that has highlighted the significant financial burden that GP charges place on private patients, particularly private patients on low incomes, charges in Ireland do not appear to deter private patients from seeking self-perceived necessary health care. On the other hand, focussing specifically on GP consultations, O’Reilly et al., 2006 found that 18.9 per cent of the population has medical problem in the previous year but had not consulted their GP because of cost. When the population were divided on the basis of eligibility for free GP care, only 4.4 per cent of medical card patients were deterred from visiting in the previous year due to cost, in comparison with 26.3 per cent of private patients.10
10
So, are medical card patients, too some extent, visiting their GP unnecessarily, or private patients, to some extent, foregoing necessary GP visits, or some combination of both? While the above survey evidence provides us with some (conflicting) answers to the second question, it does not provide any clarity on the first. Indeed, it is difficult to assess the necessity or otherwise of a GP consultation, from either a medical, economic or social point of view. It may be the case that GP visits fulfil an important psychological function, in terms of reassurance and advice, which are notoriously difficult concepts to quantify. What is clear though, is that there is a significant difference in levels of GP visiting between medical card and private patients, and the magnitude of the difference is remarkably similar across different estimation methods and data sources.
6 SUMMARY AND CONCLUSIONS
A key concern in the literature on the impact of charging for health services utilisation is the extent to which charges reduce “necessary” as well as “unnecessary” consultations, and how this subsequently impacts of the use of more costly secondary care services and health status. While our results indicate that losing a medical card prompts an individual to decrease significantly their annual number of GP visits, it is unclear whether this includes, to some extent, consultations that are medically “necessary”. Additional survey data on the extent to which private patients forgo self-perceived “necessary” GP consultations due to cost produces ambiguous results. On the other side, we cannot say whether individuals who gain a medical card and increase significantly their annual number of GP visits are, to some extent, visiting “unnecessarily”. Indeed, it is difficult to quantify the necessity or otherwise of a consultation that primarily takes the form of reassurance and advice, rather than what we would typically regard as medical treatment. With the data available to use, all we can say is that there is a significant difference in levels of GP visiting between medical card and private patients, and the magnitude of the difference is remarkably similar across different estimation methods. Ideally, we would like to assess the impact of eligibility for free GP care on subsequent use of (more costly) secondary care services and health status, although this would require more detailed longitudinal data than are currently available in Ireland.
TABLES
Table 1 Treatment and Control Groups (Gaining a Medical Card)
Control Treatment
t=1 t=2 t=3 t=4
Control (PPPP) Private Private Private Private
Table 2 Treatment and Control Groups (Losing a Medical Card)
Control Treatment
t=1 t=2 t=3 t=4 Control (MMMM) Medical card Medical card Medical card Medical card
Treatment (MMPP) Medical card Medical card Private Private Note: The outcome variable is the change in GP visiting measured at t=4 and t=2.
Table 3 Average number of GP visits (Pooled Cross-Section)
Control Treatment Outcome
t=1 t=2 t=3 t=4 (t=4-t=2)
Control (PPPP) 2.2 2.3 2.3 2.4 0.1
Treatment (PPMM) 3.1 3.7 5.1 4.8 1.1
Control (MMMM) 5.9 5.9 6.2 6.2 0.3
Treatment (MMPP) 3.4 3.3 2.7 2.2 -1.1
[image:20.595.60.541.246.346.2]Table 4 Probit estimates of the probability of treatment (used in the calculation of the propensity scores)
(1) Gaining a medical card
(2)
Losing a medical card
Year 1998 -0.15
(0.09)
-0.09 (0.10)
Year 1999 0.01
(0.09)
0.09 (0.10)
Year 2000 0.21
(0.09)**
-0.01 (0.11)
Age 25-34 0.13
(0.15)
-0.68 (0.13)***
Age 35-44 0.17
(0.16)
-0.64 (0.14)***
Age 45-54 -0.12
(0.18)
-0.82 (0.16)***
Age 55-64 0.39
(0.17)**
-1.32 (0.18)***
Age 65+ 0.83
(0.17)*** -1.81 (0.21)** Female 0.18 (0.08)** -0.01 (0.09) Rural -0.03 (0.07) -0.09 (0.07)
Lower secondary -0.21
(0.09)**
0.24 (0.09)***
Upper secondary -0.54
(0.10)***
0.26 (0.11)**
Third level -0.68
(0.15)*** 0.32 (0.24) Employed -0.02 (0.09) 0.45 (0.10)*** Unemployed 0.25 (0.25) 0.33 (0.11)*** Married -0.22 (0.11)* 0.13 (0.11) Separated/divorced 0.48 (0.25)** 0.02 (0.19) Widowed -0.27 (0.19) 0.08 (0.21) Income -0.37 (0.06)*** 0.76 (0.28)***
Income2 0.01
(0.00)*** -0.15 (0.09)* Ill-Health 0.17 (0.09)* -0.25 (0.10)*** Stress 0.10 (0.10) 0.22 (0.09)**
N 9,148 4,337
Table 5 Difference-in-difference average treatment effects
(1)
Gaining a medical card
(2)
Losing a medical card
[image:23.595.61.792.85.451.2]Nearest neighbour (k=1) 1.3
(0.7)*
-1.6 (0.8)**
Nearest neighbour (k=5) 0.9
(0.5)*
-1.1 (0.5)**
Nearest neighbour (k=10) 0.9
(0.5)*
-1.1 (0.5)**
Nearest neighbour (k=20) 0.9
(0.5)*
-1.1 (0.5)**
Nearest neighbour (k=1, δ =0.001) 1.3
(0.8)*
-1.6 (0.9)*
Nearest neighbour (k=5, δ =0.001) 1.1
(0.5)**
-1.3 (0.6)**
Nearest neighbour (k=10, δ =0.001) 1.1
(0.5)**
-1.2 (0.6)**
Nearest neighbour (k=20, δ =0.001) 1.2
(0.5)**
-1.2 (0.5)**
Radius 1.0
(0.4)**
-1.4 (0.4)***
Kernel 1.3
(0.7)*
-1.6 (0.8)**
N 9,148 4,337
N Control 8,964 4,102
N Treatment 184 235
Notes: *** significant at 1 per cent level; ** significant at 5 per cent level; * significant at 10 per cent level. k refers to the number of nearest neighbour matches involved.
δ refers to the size of the calliper (the default is no restriction). All matching is with replacement and on the common support.
BIBLIOGRAPHY
Aassve, A., Betti, G., Mazzuco, S. and Mencarini, L. (2006). Marital Disruption and Economic Well-Being: A Comparative Analysis. ISER Working Paper 2006-07. Essex: Institute for Social
and Economic Research.
Becker, S. and Ichino, A. (2002). Estimation of Average Treatment Effects Based on Propensity Scores. The Stata Journal, 2 (4), 358-377.
Blundell, R. and Costas Dias, M. (2000). Evaluation Methods for Non-Experimental Data. Fiscal Studies, 21 (4), 427-468.
Bryson, A., Dorsett, R. and Purdon, S. (2002). The Use of Propensity Score Matching in the Evaluation of Active Labour Market Policies. Working Paper No. 4, Department for Work and
Pensions, UK.
Central Statistics Office (2005). Industrial Earnings and Hours Worked. Central Statistics Office: Dublin.
Comhairle (2004). The Medical Card: Affording Health on a Low Income. Social Policy Report, Comhairle: Dublin.
Conniffe, D., Gash, V. and O’Connell, P. (2000). Evaluating State Programmes: “Natural Experiments” and Propensity Score. Economic and Social Review, 31 (4), 283-308.
Dehejia, R. and Wahba, S. (1999). Causal Effects in Nonexperimental Studies: Re-evaluating the Evaluation of Training Programs. Journal of the American Statistical Association, 94 (448), 1053-1062.
General Medical Services Payments Board11 (1995-2002). Report for the year ended 31st December. General Medical Services Payments Board: Dublin.
Görg, H. and Strobl, E. (2005). Do Government Subsidies Stimulate Training Expenditure? Microeconometric Evidence from Plant Level Data. IZA Discussion Paper No. 1606, Institute for
the Study of Labour: Bonn.
Heckman, J., Ichimura, H. and Todd, P. (1997). Matching as an Econometric Evaluation Estimator: Evidence from Evaluating a Training Programme. The Review of Economic Studies, 64 (4), 605-654.
Keeler, E. (1992). Effects of Cost Sharing on Use of Medical Services and Health. Santa Monica: RAND Corporation.
LaLonde, R. (1986). Evaluating the Econometric Evaluations of Training Programs with Experimental Data. The American Economic Review, 76 (4), 604-620.
Lechner, M. and Vazquez-Alvarez, R. (2003). The Effect of Disability on Labour Market Outcomes in Germany: Evidence from Matching. Discussion Paper No. 2003-20. St. Gallen: Department of Economics, University of St. Gallen.
Madden, D., Nolan, A. and Nolan, B. (2005). GP Reimbursement and Visiting Behaviour in Ireland. Health Economics, 14 (10), 1047-1060.
National General Practice Information Technology Group (2001). Survey on Certain Aspects of
Nolan, A. (2006). A Dynamic Analysis of GP Visiting in Ireland: 1995-2001. Health Economics, forthcoming.
Nolan, A. and Nolan, B. (2006). Eligibility for Free GP Care, Need and GP Visiting in Ireland. European Journal of Health Economics, forthcoming.
11
Nolan B. (1991). The Utilisation and Financing of Health Services in Ireland. General Research Series Paper No. 155. Economic and Social Research Institute: Dublin.
Nolan B. (1993). Economic Incentives, Health Status and Health Services Utilisation. Journal of Health Economics, 12, 151-169.
Oireachtas Debates (2004). Dail Debate Vol. 594 No. 2 (2 December 2004). Available from:
http://debates.oireachtas.ie/T
O’Reilly, D., O’Dowd, T., Thompson, K., Murphy, A., O’Neill, C., Shryane, E., Steele, K., Bury, G., Gilliland, A. and Kelly, A. (2006). Consultation charges in Ireland deter a large proportion of patients from seeing the GP: results of a cross-sectional survey. mimeo, Department of Epidemiology and Community Health, Queen’s University Belfast.
Rosenbaum, P. and Rubin, D. (1983). The Central Role of the Propensity Score in Observational Studies for Causal Effects. Biometrika, 70 (1), 41-55.
Trujillo, A., Portillo, J. and Vernon, J. (2005). The Impact of Subsidized Health Insurance for the Poor: Evaluating the Colombian Experience using Propensity Score Matching. International Journal of Health Care Finance and Economics, 5, 211-239.
Tussing A. (1983). Physician-Induced Demand for Medical Care: Irish General Practitioners. The Economic and Social Review, 14 (3), 225-247.