THE SOLUBILIZATION OF WOOL
AND SEPARATION OF SOLUBLE WOOL
INTO PROTEIN CLASSES
This thesis was presented in part fulfilment of the requirements for the degree
of Master of Science in Chemistry at Massey University
Adrian Clifford Juli
p. 3 para 3. line. 3 principally
p. 5 last line ---1992) .. only need one full-stop p. 10 para 4, line I. led not lead
p. 11 Scheme 1.3 - oxjdation line 3, loss not lose
p. 12 para 2 line 4 This large equilibrium is the --- > This large equilibrium constant is the----line 7 ----specificity to for rusulfide---> ----specificity for
rusulfide---p. 13 Eqn I. 7 inverted A should be
-=-p. 17 para 3. line 9 trypsinp. 20 top line should read as an insert following on from p.19. 11
Glycerol was added to the protein solution, a thin sheet was spread on po~vrhene and heated at 8(J°C and peeled ofl Films achieved by Yamauchi et al. using this method were applied to mice subcutaneous(v, no scarring or abnormalities were observed in the mice. 11
p. 33 para 2 line 7 silanate
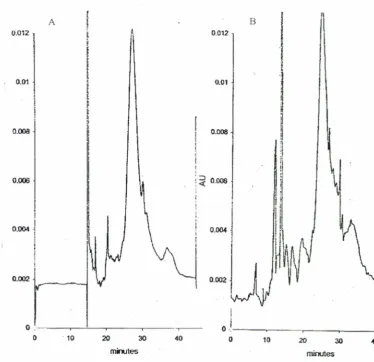
p. 37 Figure 3.1.6 legend change "the Biuret reaction" to "reduction ofCu21·· p .43 Fig 3.3 la A is the graph on the left
I b graphs labeled wrong way round p. 65 last para, line 3 asparagine
p. 76 line 2 remove full stop
p. 83 line 4 remove superscript minus sign
p. 98 Tris is tris(hydrox-ymethyl)aminomethane. not ----ethane p. 103 graphs - sec correction to Figure 5.3.4b below
p. 104 para 3 line IO kept away not kept in away p. 105 para 4 line 3 until not till
p. l06 para 2 line 3 foam not faom p. 123 bottom com1>aring not caomparing
Separation Ratio vs Concentration .:;
I
-
~ 'I
~ ' .S .,I
~ ;;-:r.l
(I p .:; ]ll I'- 211 ('()nccntrat 10n. mµ/ml,-Figure 5.3.4b Degree of separation ratio achieved with concentration change 2·~
ABSTRACT
The processing of natural products into new added value products is of importance to New Zealanders and the economy of their country. Chemical processing of wool into potential new products would be greatly assisted by separation of wool proteins into protein classes. A preliminary study of solubilizing wool protein by reduction and oxidative sulfitolysis of the cystine disulfide linkages was carried out. Oxidative sulfitolysis was used to obtain stable soluble wool protein for further investigation. Assays were developed for analysis of the effectiveness of chemical processing of the wool. To separate dissoluted wool proteins from dissolution reagents ultrafiltration was used to obtain desalted soluble wool protein. Data are reported on foam fractionation conditions of pH, concentration, sparging gas and desalting.
Wool was reduced and solubilized usmg sodium sulfide. The soluble product was processed under nitrogen and proved unstable in air. Thin films were produced from desalted reduced wool protein solutions by auto oxidation on exposure to air. Sulfonation of wool cystine to S-sulfokerateine proteins routinely achieved stable soluble product of 60 % yield. Films were prepared from the desalted soluble sulfonated wool protein. The most efficient solubilization was achieved by reduction with sulfide ion, with 70+ % yields from a low wool to liquor ratio of 1 : 10. The lack of stable soluble product hampered down stream processing and oxidative sulfitolysis was chosen for further investigation in this study.
able to be applied to all the protein solutions analyzed. Excellent correlation was achieved between gel permeation and protein dry mass analysis.
Separation to enable identification of protein classes in the processed material was attempted using capillary electrophoresis and capillary gel electrophoresis. Preliminary investigations established suitable capillary electrophoresis conditions for further study of wool protein. Gel permeation using Sephadex G-75 and Superdex 75 did not yield separation of protein to a standard comparable to that achieved by 1D SDS-PAGE.
Proteins are surface active and therefore represent natural self-foaming agents. Foam fractionation was examined with dissoluted and desalted wool protein. Optimum foam fractionation conditions were established at pH 7.8 - 8.2 and protein 1-3 mg/mL concentration. Protein was precipitated from desalted soluble wool protein using foam fractionation and represents a potential method for separation of wool proteins from solution.
ACKNOWLEDGEMENTS
First I would like to thank my supervisors Associate Professor David R. K. Harding and Dr. W. B. Bryson for their advice, enthusiastic encouragement and patience during the course of this work. l would also like to thank Rekha Parshot for helping me find my way around the laboratory, her never-ending patience and sunny nature. Dick Poll is thanked for his advice, assistance and interest in the operation of the Capillary Electrophoresis and HPLC instruments. Kate Palmano and Slavica Pavlinic are thanked for sharing their knowledge, encouragement and those essential talks over Monday coffee, they have been much appreciated. The Separation Science Group is thanked for the cooperative and friendly manner in which we worked around each other, and in particular Darren Engelbretson for his humour and sage advice.
I wish to also thank Leanne Flanagan and Dr. Robert Kelly of WRONZ for their assistance and the running of 1 D SDS-gels.
To Giovanna, 'G" my thanks, for helping me to get started again. Thanks are also expressed to the colleagues in the 'other' chemistry laboratory, who accepted my extravagances, and to all the academic staff of Chemistry and Biochemistry disciplines who were always ready to give advice and showed a real interest in my study.
To Dave and Jan Harding who accepted me into their home and helped make my overnight stays in Palmerston North so pleasant, my heartfelt thanks.
I wish to thank the Wool Research Organization of New Zealand, and the New Zealand Foundation for Science and Research and Technology for the partial funding towards this MSc study.
TABLE OF CONTENTS
Abstract ... 11
Acknowledgements ... iv
Table of Contents ... v
List of Figures ... ix
List of Tables and Schemes ... x
List of Abbreviations ... xii
CHAPTER ONE INTRODUCTION 1 1.1 Characteristics of Wool... ... 2
1.2 Analysis ... 4
1.2.1 Analysis by Capillary Electrophoresis ... 4
1.2.2 Analysis by Capillary Gel Electrophoresis ... 5
1.2.3 Urea Assay ... 7
1.2.4 Salt Content Analysis ... 7
1.2.5 Total Protein Analysis ... 7
1.2.6 Gel Permeation Chromatography ... 8
1.3 Solubilization ofWool Protein ... 9
1.3.1 Extraction of Soluble Wool Protein ... 9
1.3.2 Denaturing Reagent Reaction with Wool.. ... 13
1.3.3 Physical Disruption ofWool ... 14
1.4 Separation of Wool Proteins ... 14
1.4.1 Protein Separation by Foam Fractionation - Introduction ... 16
1.5 Production of Films and Reconstituted Fibre ... 19
CHAPTER TWO MATERIALS AND METHODS 21 2.1 Reagents and Equipment ... 21
2.2 Routine Operations ... 22
2.3 Ultraviolet/Visible Spectrophotometry ... ... 23
2.4 Dissolution of Wool. ... 23
2.6 Flame Emission ... 26
2. 7 Conductivity ... 27
2.8 Surface Tension ... 27
2.9 Urea Assay ... 27
2.10 Bicinchoninic Acid Assay (BCA) ... 28
2.11 Biuret Assay (BT) ... 29
2.12 Synthesis of Sodium Tetrathionate ... 29
2.13 Ultra-filtration ... 30
2.14 Gel Permeation Chromatography ... 30
2.15 Foam Fractionation ... 31
CHAPTER THREE ANALYSIS 32 3.1 Introduction ... 32
3. 1.1 Capillary Electrophoresis ... 3 2 3 .1.2 Capillary Gel Electrophoresis ... 34
3.1.3 Buffers for Capillary Electrophoresis and Capillary Gel Electrophoresis34 3.1.4 Urea Analysis ... 36
3.1.5 Flame Emission... . .. ... ... 36
3.1.6 Bicinchoninic Acid Assay (BCA) ... 36
3.1. 7 Biuret Assay (BT) ... 37
3.1.8 Gel Permeation Chromatography ... 38
3. 2 Experimental ... 3 9 3 .2.1 Capillary Electrophoresis and Capillary Gel Electrophoresis ... 39
3.2.2 Urea ... 40
3.2.3 Flame Emission ... 40
3.2.4 BCA ... 40
3.2.5 Biuret ... 41
3.2.6 Gel Permeation Chromatography ... 41
3.3 Results and Discussion ... 42
3 .3 .1 Capillary Electrophoresis ... 42
3. 3. 2 Capillary Gel Electrophoresis ... 4 7 3.3.3 Urea ... 49
3.3.5 BCA. ... 53
3.3.6 Biuret ... 56
3 .3. 7 Gel Permeation Chromatography ... 59
3 .4 Conclusions ... 67
CHAPTER FOUR EXTRACTION OF KERA TIN 4.1 Wool Dissolution - Introduction ... 69
4 .1.1 Reduced Wool Protein by Sulfide (S2+) and Hydrogen Sulfide (HS) .... 69
4.1.2 Reduced Wool Protein by Thioglycollate ... 70
4.1.3 Sulfitolysis and Oxidative Sulfitolysis ... 70
4.1 .4 Tetrathionate Synthesis ... 71
4.1.5 Wool Treatment Prior to Maceration ... 72
4.1.6 Urea, Cyanate and Wool Damage ... 72
4.2 Experimental ... 73
4.3 Results and Discussion ... 73
4.3.1 Sulfide Reduction ... 73
4.3.2 Thioglycollate Reduction ... 74
4.3.3 Reduced Wool Protein by 1,4-dithiothreitol (DTT) ... 75
4.3.4 Sulfitolysis by Copper Ammonium and Sulfite Ion ... 75
4.3.5 Oxidative Sulfitolysis using Tetrathionate Ion ... 75
4.3.6 Tetrathionate Synthesis ... 76
4.3.7 Water Content of Wool ... 78
4.3.8 Pre-maceration Treatment of Wool. ... 78
4.3.9 Urea, Cyanate and Wool Damage ... 81
4 .3 .10 Cost Analysis of Solubilization Reagents ... 81
4. 4 Conclusions ... 82
CHAPTER FIVE FOAM OR BUBBLE SEPARATION TECHNIQUES 85 5.1 Introduction ... 85
5.1.1 Protein Foam Fractionation ... 85
51.2 Factors Influencing Foam Fractionation ... 88
5.1.4 Foam Fractionation on an Industrial Scale ... 93
5.2 Experimental ... 94
5.2.1 Operation of the Foam column ... 94
5.2.2 pH Controlled Foam Studies ... 95
5.2.3 Refoaming ... 96
5 .2.4 Total Protein Analysis ... 96
5.2.5 Desalting by Ultrafiltration ... 96
5.3 Results and Discussion ... 96
5.3.1 5.3.2 5.3.3 5.3.4 5.3.5 5.3.6 5.3.7 5.3.8 5.3.9 5.3.10 5.3.11 Stability of Stored Soluble Wool Protein ... 96
pH Controlled Studies ... 97
Air Compared to Nitrogen for Sparging ... 99
Foam Enrichment with Dilution ... 100
Urea Concentration of Foam Fractions ... 104
Sodium Ion Concentration ... 105
Re-foaming ... 105
Surface Tension and Foam Fractionation ... 109
Time Taken for Foaming ... 111
Desalting Wool Protein Solutions ... 113
Foaming Desalted Wool Proteins ... 117
5.4 Conclusion ... 121
CHAPTER SIX CONCLUSIONS AND FUTURE WORK 123 6.1 Conclusions ... 123
6.2 Future Work ... 127
LIST OF FIGURES
Figure 1.1 Schematic representation of a wool fibre 2
Figure 1.2.2 Interaction of PEO with Silano I on capillary walls 6 Figure 1.4.1 Surface tension-concentration for catalase 18
Figure 3.1.6 Cu -complex formed with BCA 37
Figure 3.1.7 Biuret Complexation of Cu 37
Figure 3.3. la Buffer pH differences with CE of wool protein dissolution 43 Figure 3.3. lb Absorption of dissoluted wool at 200 nm and 280 nm 43
Figure 3.1.3c Different buffers 45
Figure 3.3. ld Separation by CE of wool protein classes 46 Figure 3.3.2 Buffer effect on CGE using 5% PEG as replaceable gel 48
Figure 3.3.3 Standard curve for TDMU absorbance with urea concentration 50 Figure 3.3.5 Absorbance of BCA complex against concentration 55 Figure 3.3.6a BT assay standard reference graph for BSA against
concentration 56
Figure 3.3.6b BSA compared to HSA 59
Figure 3.3.7a Sephadex G-75 of dissoluted wool protein 61 Figure 3.3.7b GPC of dissoluted wool using Sephadex G-15 63
Figure 3.3.7c GPC of wool protein solutions showing low absorbance
and peak tailing 66
Figure 4.3.8 Protein concentration change with time during solubilization 80
Figure 5.1.1 Idealized bubble cross-sectional view 86
Figure 5.3.4a Variation of enrichment ratio with concentration change 101 Figure 5.3.4b Degree of separation ratio achieved with concentration change 103
Figure 5.3.4c Percentage recovery achieved with concentration change 103 Figure 5.3.8 Surface tension against pH for soluble wool protein 110
Figure 5.3.9 Time against the volume of bulk liquid 112
Figure 5.3.1 0a Arrangement of VivaFlow 50 cross-flow filter 114
Figure 5.3. lOb Protein and salt concentrations in retentate and filtrate during
ultrafiltration 115
LIST OF TABLES AND SCHEMES
Table 1.1 Wool protein classes, amounts, sulfur contents and molecular
..,
masses .)
Scheme 1.3 Methods of solubilizing wool 11
Scheme 1.4a Wool separation 15
Scheme 1.4b Wool separation 15
Table 3.3.3 Known urea concentration compared against measured urea
concentration based on TDMU assay 52
Table 3.3.4a Comparison of two assays 52
Table 3.3.4b Conductivity and flame emission comparability 53
Table 3.3.5a Comparison of total protein by BCA, BT and GPC 54
Table 3.3.5b BCA assay of dissolution mixes, 2 and 4 55
Table 3.3.6a Possible interference from reagents in the dissolution mixture 57
Table 3.3.6b Comparison of BT and GPC assays of total protein 58
Table 3.3.7a Absorptivity for wool dissolution reagents at 214 nm 62
Table 3.3.7b Elution times for protein samples 62
Table 3.3.7c Elution times for the reagent ions and peaks using G-15 64
Table 3.3.7d GPC elution times for the first peak of wool dissolution extracts 65
Table 3.3.7e Protein mass to peak area measured using Sephadex G-15 GPC 65
Table 3.3.7f Total protein assayed by GPC and by BT 66
Table 4.3.7 Percentage of moisture in air dry wool 78
Scheme 4.3.8 Treatment of wool prior to oxidative sulfitolysis 79
Table 4.3.8 Percentage dissolution of freeze/thaw regime 80
Table 4.3.10 Comparison of wool to liquor, wool to reagent, reagent
cost per gram of wool 82
Table 5.3.2 Foaming and pH Change 97
Table 5.3.3 Comparison of Er, Sr and RP using Air and Nitrogen 99
Table 5.3.7a Protein changes on re-foaming 106
Table 5.3.7b Conductivity of foamed and re-foamed solutions 107
Table 5.3.7c Sodium content of re-foamed wool protein solutions 107
Table 5.3.7d Comparison of GPC and BT assays of re-foaming experiment 109
Table
Table
5. 3. 10 Salt reduction over time by cross-flow filtration
5 .3 .11 Protein concentration of desalted foamed solutions
116
2-AE AA
AcCN
AUBCA
BTBSA
BMEBV
CA
CE
CGE
CHY
DX DTT DW EEA
EG
µeo µepEr
FE FFGPC
HOAc
HGTP
HPho HPhi HPLCHSP
IFP i/a ID E MW MWCOOSP
PAGE PEG:e
.
Rp RPSDS
spargmg Sr-S-S-ABBREVIATIONS AND TERMS
2-aminoethanol amino acid acetonitrile absorbance units bicinchoninic acid biuret
bovine serum albumin P-mercaptoethanol bee venom
carbonic anhydrase capillary electrophoresis capillary gel electrophoresis chromatography
dextran dithiothreitol
dissolved wool/dissoluted wool absorptivity
egg albumin ethylene glycol electroosmotic flow electrophoretic mobility
enrichment ratio of foamed samples flame emission
foamed wool dissolution fraction gel permeation chromatography acetic acid
high glycine-tyrosine proteins hydrophobic
hydrophilic
high performance liquid chromatography high sulfur protein
intermediate filament protein interactions
internal diameter molar absorptivity molecular weight
molecular weight cut-off oxidative sulfitolysis proteins polyacrylamide gel electrophoresis polyethylene glycol
protein
percentage recovery of foamed samples reduced protein
sodium dodecyl sulfate
bubbling of a gas through porous sintered glass, ceramic or stainless steel
TDMU TGA TGi Tris
TIN
UHSP UV UVNisw
W-S -W-SS03 -W-SS-Wthiosemicarbazide-diacetylmonoxime-urea complex thioglycollic acid
thioglycollate ion
tris(hydroymethyl-aminoethane) tetrathionate
ultra-high sulphur protein ultraviolet
ultraviolet-visible wool
anion of cysteine sulfhydryl in wool S-sulphokerateine
CHAPTER
ONE
Introduction
New Zealand has a highly efficient wool fibre production from its agrarian sector. The
annual production for the last five years has averaged 203,000 tonnes of wool. The total
value of wool exports for New Zealand was $1,207.3M in 1999 with an average of 443
cents/kg for cleaned wool (NZ Yearbook, 1998). A small proportion, less than 10% of the wool production is processed in New Zealand. New Zealand wool is predominantly crossbred medium-coarse 28-46 micron wool. These fibres make good hard wearing
carpet wool, but the fibre value is low and the economic return poor. Man-made fibres have made a steady inroad into the textile trade and seen the decline of wool to less than 5% of the world market. There is a need to develop new products and new markets for wool products. Processing of wool opens up opportunities for the development of completely new products as well as enhancement of traditional products. Traditional markets are well supplied with wool and new products that can compete on new markets
are required.
This study is a preliminary investigation of soluble wool chemistries and of the possible routes for separation of wool proteins in solution. Solubilization is the first step followed
by separation of the protein components. Solubilization of wool using sodium sulfide produces reduced soluble wool that is unstable when exposed to air and is difficult to handle in larger than gram quantities. Sulfonated wool protein is stable when exposed to air, however the yields have been lower than that obtained from reduced wool protein and
involve larger liquid volumes and more expensive reagents. Retaining the wool protein in a soluble form involves examining known and new methods of separation. Previous
separation has focussed on precipitating the wool protein once extracted from the wool fibre. Precipitation can lead to a material that is difficult to redissolve, hence separation of wool proteins in the soluble form is a desired outcome of this study. An additional objective was to provide an insight into development of processes suitable for industrial
1.1 Characteristics of Wool
Wool is dead tissue of epithelial origin. Wool fibre exhibits a cellular structure comprising a central cortex region surrounded by a sheath of flattened cuticle cells as shown in Figure
1.1 (Parry and Steinert, 1995: Dowling and Sparrow, 1991).
Low-sulphur protein chains associated into coiled-coil ropes
[image:16.565.92.358.178.516.2]Cortical ce11----i
Figure 1.1 Schematic representation of a wool fibre
From Dowling and Sparrow (1991).
The cortex is composed of spindle-shaped cells aligned along the fibre, which enclose
filaments of coiled-coils of protein chains. It is estimated that there are over 100 wool
proteins in a fibre. The protein chains are highly crosslinked by the disulfide bonds of
cystine conferring insolubility in water. Alkaline hydrolysis gives solubility 65-80 %
compared to hydrolysis by HCl 6M, 60°C, 2.5 h resulting in 50 % solubility. Wool has a
high cysteine content, the most common amino acid in wool at 11 mol %. Most cysteine in
wool exists as the disulfide bonded cystine, forming intra-molecular and inter-molecular
disulfide crosslinks giving strength, stability and relative insolubility characteristics to wool
-NH
HN-I I
CH-CH2-S-S-CH2-CH
I I
-CO
OC-Cystine
-NH
I
CH-CHr S-H I
-CO
Cysteine
The composition of wool varies with diet, time of year, breed of sheep and the part of the
sheep where the wool is produced. Wool protein can be divided into four main classes of
protein based on the percentage of key amino acids, Table 1 . 1.
Protein class Mass% Sulfur content Molecular
% mass, kD
Low sulfur 58 1.5 - 2 45 - 60
High sulfur 18 4-6 I I -28
Ultra high sulfur 8 8 28 - 37
High Gly-Tyr 6 0.5 - 2 9 - 13
Table 1.1 Wool protein classes, amounts, sulfur contents and molecular masses Approximate amounts of wool classes. sulfur content and range of molecular masses found in Merino wool. From Maclaren and Milligan, 1981.
The pl of wool proteins is spread across the range 4-7. 5, with all wool classes showing a
range of pl. The low sulfur wool proteins have some a-helix character, this is not apparent
in the other wool classes. A high proportion of the sulfur residues are reported to lie in the
terminal regions of the protein molecules (Parry and Steinert, 1995, Yamauchi et al. 1996).
Aligned proteins enable cystine linkage to give added strength to the wool fibres.
Within the wool fibre the low sulfur, intermediate fiiament proteins (IFP) are found
predominantly in the microfibrils, whereas the high sulfur proteins (HSP) are found
pricipally in the matrix along with the high glycine-tyrosine proteins (HGTP). Washed
wool is 85-90 % a-keratin protein. Extraction of soluble wool protein usually occurs from
1.2 Analysis
Determination of the changes occuning during the solubilization process and separation
methods is essential. Wool has specific characteristics that limit the range of possible analyses that can be applied to it when determining the total protein and changes m
salt/reagent content. Untreated wool is insoluble in water, remaining soluble only m
solutions above pH 8 in the absence of chaotropic agents, the presence of the chaotropic agents interfering in subsequent wool analysis. Investigation of possible assay methods was
an important precursor to further study of separation methods applied to soluble wool
protein.
1.2.1 Analysis by Capillary Electrophoresis
Capillary electrophoresis is a highly efficient and sensitive analytical technique that is able
to separate positive, neutral and negative species. Extremely small, µL quantities are required. Separation of species in CE is based on differences in electrophoretic mobilities
µep , that is the different velocities of the migrating species. The µep relates to the solute size and charge of the protein at a given pH. Proteins will change in charge with changes in the pH. If the pl of the proteins differ then separation is possible, Equation 1.1.
µ,p Eqn 1.1
6nrir
q = sum of charge on protein surface, ri = viscosity of the running buffer, r = radius of molecule
If the surface charge on protein changes with pH then the value of ~P will change and
separation can be accomplished. A high potential difference, (12-20 kV), creates an
electroosmotic flow ~ 0 such that all species, positive, neutral and negative are earned through the capillary tube in one direction.
Two processes can act against separation of different proteins, a lack of difference in the charge to size ratio of the proteins and interaction of the proteins with the walls of the
A number of studies have reported good separations of proteins using CE (Chen, 1991,
Tehrani et al., 1991, Maa et al., 1991, Baker, 1995, Bushey and Jorgenson, 1989, Lauer
and McManigill, 1986, Dolnik, 1995). This encouraged study using CE with fused silica,
anticipating that this would provide a useful technique for quick analysis of proteins and for
delivery of protein class information.
1.2.2 Analysis by Capillary Gel Electrophoresis
Wool proteins can be separated into their protein classes by molecular mass using 1-D
SDS-P AGE slab gel plates (Maclaren and Milligan, 1981 ). This can be time consuming and provide results that do not always lead to a clear interpretation. CGE is the same
sieving process as slab gels, performed in a capillary tube. CGE can achieve very high resolution separation in < 30 min for a 100 cm capillary with theoretical plates as high as 30 million (Li, 1992). Where solutes are similar in their charge to size ratio, CGE separates
these effectively on the basis of size, a situation believed to exist for wool proteins.
To perform CGE the capillary is filled with a gel, polyacrylarnide (PAG) or linear polyacrylarnide gel (LP AG) being the favoured choices. Dextran, polyethylene glycol
(PEG), polyethyleneoxide (PEO) and agarose have also being used as gels. The gels have pores that act as sieves retarding higher MW protein molecules more than lower MW
protein molecules. A graph of increasing molecular size with time is produced that can be
related to known MW markers. Treatment of the capillary wall is necessary to dramatically
diminish electroosmostic flow and prevent extrusion of the gel. Zhu et al. ( 1989) reported
that the technique of using gel filled capillaries is inconvenient and does not yield reproducible results.
LP AG was cited in Literature as providing improved separation of protein by lowering
wall-protein interaction and a cross-linked gel for separation by molecular size (Hjerten, 1985; Manabe et al. 1998; Wu and Regnier, 1992; Cohen and Karger, 1987). Size separation
occurs because of the movement of the solute through the 'dynamic pores' of the linear strands of LP AG (Baker, 1995). However the LP AG exhibits absorption in the 200-220 nm
wavelength, effectively eliminating it as an option for CGE of wool protein when UV of
the use of lower pH values to protect the LP AG from degradation effects. Again lower pH
is undesirable when dealing with wool proteins creating a problem if LP AG is to be used
for soluble wool protein separation.
Solutions of linear, UV transparent polymers offer an alternative to gels bonded to the
capillary wall. PEG, dextran and agarose are polymer networks that can easily be
introduced with the buffer and provide more reproducible results than those obtained using
gel filled capillaries as in Figure 1.2.2 (Zhu et al. 1989, 1990; Iki and Yeung, 1996; Takagi
and Karim, 1995; Guttman et al. 1993). The sieving effect of the polymer network is the
[image:20.546.95.423.336.433.2]result of polymer-polymer and polymer-solvent interactions (Guttman et al. 1993).
Figure 1.2.2 Interaction of PEO with silanol on capillary walls
From llci et al. (1995)
Adsorption of PEO to silica was postulated by Iki and Yeung (1996), as preventing
dissociation of silanol groups when using higher pH. The coating of the silica decreases the
µco, producing improved separation. It was hypothesized that the PEG would coat the
capillary and provide a sieving medium for the protein. Dextran can be used as a
replaceable gel for CGE (Takagi and Karim, 1995; Ganzler et al. 1992). Iki and Yeung
( 1996) reported good separations using polyethylene oxide as a capillary coating. The
application of CE and CGE to wool proteins was to ascertain their suitability as quick
analysis systems that would give information on solubilizations and separations of wool
1.2.3 Urea Assay
Wool was solubilized with the aid of large amounts of urea (8M). The distribution of the
urea in separation techniques was of interest in this study. Assays have been developed for
measuring urea produced as a result of enzyme activity (Mellerup, 1967). The urease assay
is very specific to urea, however measurement is of the ammonia produced rather than
direct measurement of urea. The thiosernicarbazide-diacetylmonoxime (TDM) assay is a
direct measurement of urea. It was designed for analysis of rnicromol amounts of urea by
formation of a coloured complex. Arginase action on arginine produces quantitative
amounts of urea (Mellerup, 1967; Geyer and Dabich, 1971). The Geyer and Dabich
method was used in a form modified by Patchett (1988), for the assay of arginase activity
on argmme.
1.2.4 Salt Content Analysis
The concentration of sodium ions provides information about changes in the ionic content
of the solutions being studied. Conductivity of solutions provides information regarding
the total ion content of the soluble protein solutions, however more information relating to
the concentration and partition of ions in any process undertaken would be helpful. The
Corning Flame Photometer is able to detect potassium and sodium ions using a low
temperature flame. The sodium ion was the only alkali ion present in reagents used to
achieve soluble wool protein and can be measured to 1. 0 ppm with confidence. The
sodium ion concentration could provide information about specific ion changes that were
occurring during separation techniques.
1.2.5 Total Protein Analysis
Numerous methods exist for the estimation of protein concentration by chemical assay.
The choice of the particular assay is mainly dependant on the following criteria: the amount
of protein available, the presence of chemicals that may interfere, ease and reliability of the
The BCA is a sensitive, stable and quick assay. The BCA is an assay for total protein in the
0 .1-100 µg protein range. It is widely used and has less interference than the Lowry assay
(Sapan et al. 1999). Protein reduction of alkaline Cu2+ to Cu+ is dependent on the
concentration of protein. The peptide bond reduces the Cu2+ -complex intermediate to the
purple Cu(BCA)23-complex (Braun et al. 1989). Cu 2
- is reduced by a number of reactants
found in protein solutions, particularly tyrosine, tryptophan, cystine and cysteine. Reaction
with the side chains of the four reactive am.ino acids is not temperature dependent and
increased temperature development of the BCA ensures that the response being measured
is predom.inantly the peptide bond reaction rather than the above am.inc acids reducing
copper (Weichelman et al. 1988).
The biuret assay is not as sensitive as the BCA, but is more robust, showing fewer
mis-readings from chemical interference. The simple assay technique and the suitable range of
BT assay made it an assay worth investigating for total wool protein. The BT assay has
lower sensitivity 20-100 µg/rnL compared to the BCA, Lowry and Comassie-Blue assays
of 100 - 1 ug/rnL (Jenzano et al. I 986; Sapan et al. 1999; Holme and Peck, 1993). Wool protein solutions were in the range of 0.1-20 mg/rnL. Gomall et al. (1948) recommended
an amendment using tartrate stabilised reagent to get a reliable assay. The assay is
non-specific and applies to all proteins, with little difference being shown between proteins
(Holme and Peck, 1993; Sapan et al. 1999; Harris and Angal, 1989).
1.2.6 Gel Permeation Chromatography
To assay the total protein in solution, the concentration changes in reagent chem.icals and
the changes in concentration of salts in the processes investigated presented specific
problems. Keratin is particularly insoluble compared to most other proteins studied. Most
assays have been devised around the characteristics of proteins such as bovine serum
albumin carbonic anhydrase as essentially soluble proteins present in small quantities. In
assessing the changes in the wool protein solutions specific problems must be overcome.
Most of the wool protein solutions were in reducing environments, the solutions were
frequently pH > 8 and chem.icals that show UV interference were often present. In addition
many samples needed to be assayed and this precludes some methods that are time and
Short column GPC provides separation of large molecular weight molecules (keratin
proteins and peptides MW > 5,000D) from smaller, reagent molecules (MW < 500).
Pharmacia lists Sephadex G-15 as having a MWCO > l 500D, and it is often used as
desalting medium. In addition a G-15 column coupled with UV detection can be used to
determine the total protein by separation of protein from the reaction mix (Hayakawa,
1997; Bollag et al. 1996). The molecular weight range for wool protein has been reported
as 9,000 to 60,000D (Maclaren and Milligan, 1981). Any peptides and solubilizing
reagents which have MW < l ,500D will elute after the protein peak.
Wool solubilization reagents and products, sulfite, tetrathionate, thiosulfate and Tris have
been reported as interfering with the BCA, Lowry and BT assays (Harris and Angal, 1989;
Sapan et al. 1999; Bollag et al. 1996). Soluble wool protein has a very low absorbance at
280 nm, lacking sufficient tryptophan (35-44 micromoles per gram) and tyrosine (340-390
micromoles per gram) for significant UV absorbance at this wavelength (Maclaren and
Milligan, 1981 ). In addition, some solubilizing reagents absorb in the 214 nm range,
making direct solution measurement impractical. The absorptivity for wool protein was
measured at
€
:i..214 34,300 cm2.i
1 and solubilizing reagents€
,.
214 10,400 cm2.g·1. Theabsorptivity of wool is largely due to the amide bond and is particularly strong in the
190-220 nm range, allowing for increased sensitivity of measurement.
1.3 Solubilization of Wool Protein
1.3.1 Extraction of Soluble Wool Protein
Disulfide bond cleavage can be accomplished by reduction or oxidation of the cystine.
Reduced cystine, forms thiol anions,
ws
·
(Eqn 1.2) or undergoes disulfide reduction bysulfite to form S-sulfone, WSSO3. (Eqn 1.3).
wssw
wssw
W= Wool
+
+
2SO/+
RSSR + Eqn 1.2
Enzymatic dissolution was not investigated in this study, although the action of papain on
wool was studied by (Lennox, 1952; Naval and Nickerson, 1958).
Wool protein was extracted using reducing conditions of alkaline glycollate from native wool (Goddard and Michaelis, 1935). Goddard and Michaelis reported finding two fractions in reduced wool protein that differed in solubility and sulfur content. Extraction of
wool requires breaking of disulfide bonds between wool proteins. This was confirmation of the high and low sulfur proteins present in wool. It is now clearly established that there are
four classes of proteins in wool.
The Goddard and Michaelis study lead to considerable investigation of solubilization by both reduction using potassium thioglycollate and sulfitolysis using copper ammonia/sulfite
solution (Harrap and Gillespie, 1963; Swan, 1961; Koltoff and Stricks, 1951 ).
The Goddard and Michaelis study lead to considerable investigation of solubilization by both reduction using potassium thioglycollate and sulfitolysis using copper ammonia/sulfite solution (Harrap and Gillespie, 1963; Swan, 1961; Koltoff and Stricks, 1951 ). These studies showed the versatile routes that were available to achieve soluble wool protein.
Swan (1957, 1960) demonstrated that copper ammonia/sulfite reagent was very effective at extracting wool protein achieving an 85+% yield. The difficulties from an industrial point of view with this method are the processing demands of a large wool: liquor ratio of 1: 100 and the problems associated with removing copper from the protein product. The reduction pathway has the problem of being highly sensitive to re-oxidation of the cysteine
groups (Yamauchi et al. 1996).
Wool
-S-S-W
Reduction by reducing agents
[ sodium sulfide, thioglycollic acid/ potassium thioglycollate, 1, 4-dithiothreitol, 2-aminoethanol, phosphines]
Problems
1/ reoxidises on exposure to air
2/ protection by alk:ylation is difficult to remove without protein degradation
Sulfitolysis/ oxidative sulfitolysis
[ sulfite/ urea, sulfite/ cuprammonium, sulfite/ tetrathionate]
Problems
1/ heating leads to lanthionine formation
2/ possible side reactions with cysteine, tyrosine 3/ urea SM/reagents present in~ O. lM concentration
Oxidation
L
[peracetic acid, performic acid, hydrogen peroxide] Problems1/ oxidation of amino acids irreversibly, lose of protein intergrity
ELatic
[papain, trypsin]
Problems
1/ degradation of protein 2/ slow process
Scheme 1.3 Methods of solubilizing wool protein
It has been generally accepted that all wool proteins are soluble and that any observed
variation is related to the steric, hydrophobicity and charge effects of neighbouring groups
rather than due to any morphological differences (Maclaren and Milligan, 1981 ). Reduced
wool protein is readily oxidized in air reforming disulfide bonds, both as intra- and
inter-protein linkages (Maclaren and Milligan, 1989). Thiol groups of reduced wool protein
(Thomas et al. 1983; Kelly 1998). Yields obtained for dissolution vary according to
conditions used with alkaline reducing conditions reported as producing yields as high as
87% (Thomas et al., 1983; Maclaren and Milligan, 1981; Wormald, 1948). Most cited
solubilizations of wool protein were carried out at alkaline pH, that inevitably leads to
degradation of the protein, however some extraction methods i.e. using ~-mercaptoethanol
can be carried out in neutral pH (Harrap and Gillespie, 1963; Maclaren and Milligan, 1981;
Yamauchi, 1996). The shorter time 3 hours needed using reduction is an advantage to the
oxidative sulfitolysis requiring 24 hours in limiting alkali damage, however the pH > 10.5
required for reduction will have negative consequences compared to the milder pH > 9
used for sulfonation. Alkaline conditions degrade the protein with hydrolysis of the peptide
bonds and conversion of cystine to lanthionine. The protein degradation is more severe
with strong alkali, making treatments with pH > 11 undesirable. The milder conditions used
in oxidative sulfitolysis cause less protein degradation (Maclaren and Milligan, 1981 ).
OTT used in close to molar equivalence of reagents to wool achieves a high yield
solubilization. Cleland ( 1964) showed that the equilibrium constant for the production of
the oxidized form of DTT in the reduction of cystine strongly favours the products, K
=
104. This large equilibrium is the result of formation of a stable 6-membered ring structure
( 4,5-dihydroxy-1,2-dithiane). Using a 1:4 ratio of wool to DTT was reported as achieving
nearly complete reduction of wool in Jess than 10 h (Weigmann and Rebenfeld, 1966). The
reagent OTT shows specificity to for disulfide bonds of proteins. The use of selenol
selenocystearnine as a catalyst in the DTT reaction has been suggested by Singh and Kats
( 1995) with an ~ 102 improvement in the measured rate of reaction.
Oxidative sulfitolysis using sodium tetrathionate (TTN) achieved solubilization albeit at
lower yields 56% and more importantly the S-sulfonated cystine group was stable when
exposed to air (Thomas et al. 1983).
The oxidative sulfitolysis reaction of arnmoniacal copper (II) and sulfite with cysteine was
first investigated by (Kolthoff and St ricks, 19 51 ), with the formation of the
S-sulfokerateine species. S-sulfokerateine is stable at pH > 7, thus the concentration of
WSSW declines from the oxidative action of the copper (II) (Eqn 1 .4, 1.5). The overall
wssw
+2Cu2'
ws
-
+,__
- - ,
ws
-
+WSSW +
wsso
,
-
Eqn 1.4Eqn 1.5
2Cu' Eqn 16
The sulfitolysis reaction has an equilibrium con tant near to unity, thus necessitating a large
excess of reagent SO, 2- to get a high proportion of product formed Oxidative sulfitolysis
by TTN in contrast uses the conversion of the thiol anion created in Eqn. I .4 back to a
disulfide that can undergo further reaction, Eqn 1.5.
WSSW+ + Eqn 1.7
The action of TTN is quite specific, acting only on cystine and cysteine in wool, TTN being
a mild oxidant E0
S-1O/-;s2O}-= -0 09 V Some studies have found evidence of protein
degradation using TT , however the production of lanthionine during oxidative sulfitolysis
appears to be the result of later hydrolysis reactions as part of the amino acid analysis
(Maclaren and Milligan, 1981 ).
1.3.2.Denaturing Reagent Reaction with Wool
Urea added to reductions usmg potassium thioglycollate was reported by Harrap and
Gillespie ( 1963) as increasing yield to 85%. Urea added to both reducing and sulfonating
environments results in increased yields. Urea breaks the hydrogen and van der Vaals
bonding forces between protein molecules assisting the penetration of reagents in solution.
Urea decomposes slowly to form cyanate ions. Cyanate can cause degradation of protein,
care must be taken in leaving urea in contact with protein (Maclaren and Milligan, 1989;
1.3.3 Physical Disruption of Wool
Wool fibres can absorb water up to 30% of total mass, but are insoluble in water. To
extract all the protein the internal fibrils of the wool fibre must be penetrated by the
dissoluting solution and the soluble protein released. Use of maceration to shatter cells
assists the release of protein. Freezing cells to -21 °C was also found to assist the
extraction of protein from loose cells (Albade et al. 1998). Any action that opens the fibre
to allow easier passage of reagents to the cystine links will speed up reaction. Urea in high
concentrations (8M) has long been recognised as a denaturant of protein, however removal
of urea presents problems downstream. In an extraction of protein material from plant cell
matter, Abalde et al. (1998) experimented with protein extraction by comparing three
methods, sonication at 4°C, freezing at -21 °C and thawing at 4°C, freezing in liquid
nitrogen and thawing at 4°C. The best extraction was achieved from the freezing at -21°C
and thawing at 4°C.
1.4 Separation of Wool Proteins
The objective of a separation strategy is to obtain the maximum yield of protein with
maximum purity, cost-effectively in a minimum of steps (Harris and Angal, 1989). Each
protein has unique properties that can be exploited in separation techniques. The major
properties of proteins to exploit in separation are the charge, biospecificity, surface
hydrophobicity, pl and molecular mass (Harris and Angal, 1989). In particular proteins are
sensitive to pH, temperature, denaturants and ions in solution, these parameters need to be
controlled in separation techniques (Grandison and Lewis, 1996).
Wool proteins have been separated on the basis of molecular size, pl and ammo acid
composition (Gillespie, 1964). The specific properties of the different wool protein classes
will confer specific characteristics to that class of proteins that can be used to develop new
products i.e. the low sulfur class compared to the high sulfur class. A problem arises with
the overlap of characteristics exhibited by the wool protein classes that make it difficult to
Separation schemes are usually designed around principles of, the most general steps first,
each step exploits a different property and the product from one technique can be applied
to the next step without further manipulation (Asenjo, 1990). Wool protein classes have
been separated by precipitation after solubilizing. The disadvantage of this method is that it
presents the next step with a solid that must then be redissolved. Two schemes were
contemplated as separation strategies, Scheme 1.4a and I .4b. Each scheme used different
properties of wool proteins in each step.
Wool
Reduction/Oxidative Sulfitolysis
l
Foam
ractionation~nc~~
IFP HGTP HSP UHSP
Scheme 1.4a Wool Separation
Wool
Reduction/Oxidative Sulfitolysis
l
U ltrfiltration
Foam ractionation
~ a t o ~ or Ion exchange
IFP HGTP HSP UHSP
The intention was to achieve soluble wool protein of one class that could be used for
production of films. Foam fractionation was mentioned in literature as a promising
technique with potential industrial value, which was of particular relevance to wool. Foam
fractionation was an integral part of the investigation undertaken in this study.
Aims of this study were:
❖ to explore the possibility of retaining the wool in a soluble form at each step
❖ separate the wool protein from the ionic and urea components with the wool protein in
solution
❖ separate the wool protein on the basis of wool protein classes
1.4.1 Protein Separation by Foaming - Introduction
Foam concentration 1s a separation technique in which surface-active proteins are
concentrated from dilute solutions by preferential adsorption at gas-liquid interfaces created
by sparging an inert gas e.g. nitrogen, through the protein solution (Uraizee and
Narsirnhan, 1996; Brown et al. 1990). The concentration of protein in foam is the
combined effect of interfacial adsorption of the protein and drainage of protein carrying
foam (Bhattacharjee et al. 1997).
When bubbles are introduced to a protein solution, protein collects at the gas-liquid interface as a result of the difference in the chemical potential of protein at the interface
compared to the chemical potential in the liquid. This difference drives the reaction (Eqn.
1.8) until equilibrium is reached, when the chemical potentials will be equal.
Protein (aq) .,_ --,- Protein (gill Eqn. 1.8
Protein exhibits surface chemical activity and readily accumulates at the interface, thus from
the equation it can be deduced that surface tension decreases when protein concentrates at
The Gibbs energy of the two phases is different by an amount termed the surface Gibbs
energy which leads to the Gibbs surface-tension equation, Eqn. 1. 9 (Atkins, 1994).
dy
= -
RTI C
d In a, Eqn. 1.9ai chemical activity of component i at the interface.
C
surface excess of component i at the gas-liquid interfacey surface tension
The surface activity is a result of the particular rrux of hydrophobic and hydrophilic
functional groups in the protein. The diversity of protein structures and the differences in
hydrophobic and hydrophilic domains on the surface of protein makes protein gas-liquid
interface behaviour difficult to predict (Hunter et al. 1991 ). Changes in surface tension are
a guide to favourable parameters by which protein may be selectively concentrated.
An amino acid sequence for a high sulfur protein indicated 41 out of 151 residues could be
classed as hydrophobic (Maclaren and Milligan, 1981 ). Most of the hydrophobic residues
are found in one half of the sequence, supporting the concept of a hydrophobic part and a
hydrophilic segment to the protein. Sequenced wool intermediate filament proteins of the
same class show a high degree of homogeneity and can be expected to share similar
physico-chemical characteristics (Parry and Steinert, 1995). Liu et al. ( 1998) noted that the
structure of a protein becomes more denatured and hydrophobic when the pH of the
solution is close to the pl of the protein. However Liu et al. also found that the optimal pH
values for separation of trysin (pH 3.0) and catalase (pH 4.0), are both well away from
their respective pl values of 10. 7 and 7. 0. Determination of the optimum pH for separation
by foam fractionation on an individual protein basis is beyond the scope of this
investigation.
Lemlich ( 1972) noted that because of the difficulty of measuring small changes in surface
tension y, and uncertainties in identifying species and evaluating their activity coefficients a;
it has limited use as a quantitative tool in practical situations. An increase in protein
concentration leads to an increase in the surface excess, until the CMC is reached, as
76
72
€ ~
V ...
~ 68 "O ~ 0 ",iii 64 c:.
.,
I-...
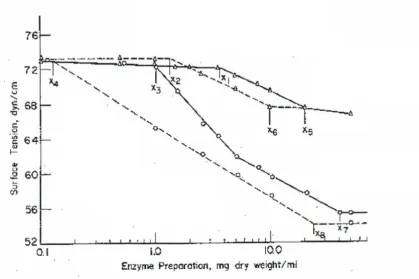
u 60 .g ~ ::I (f) 56 520.1 1.0
[image:32.555.65.484.45.324.2]Enzyme Preporotion, mg dry weight/mJ
Figure 1.4.1 Surface tension-concentration for catalase and amylase.
Surface tension diagram for catalase and amylase. Amylase in water (6- 6 ); amylase in IO% (NIL)2S04 (6 ---6 ); catalase in water (0--0); catalase in 10 % (NIL)zS04 (0----0). From Lemlich (1972).
Foam fractionation is best performed at concentrations below the CMC, where enrichment
is greater. Differences of surface tension indicate points at which fractionation of a protein
mixture may be possible. A decrease in the ionic content results in an increase in surface
tension and in bubble size. Bubble size is proportional to square root of the surface tension
(Liu et al. 1997). Smaller bubbles are more stable, but enrichment is best achieved where
bubbles increase in size and thus maximize the drainage of interstitial spaces.
It would be useful to identify the mmnnum surface tension and hence the maximum
accumulation. Liu et al. ( 1997) found that a minimum surface tension could be established
for different proteins by changing the pH Many, but not all proteins exhibit a minimum
surface tension at the pl of the protein. At high pH away from the pl, the surface tension
approaches that of water because of the weaker electrostatic attractions. It is likely that for
some proteins the hydrophobicity has an important role in accumulation at the surface that
overrides the loss of electrostatic attractions. Wool dissolution mixtures being a mixture of
reagents and over 100 wool proteins would not be expected to show any clearly defined
surface tension pH changes. Any changes of surface tension would however indicate
surface tension pH changes. Any changes of surface tension would however indicate
accumulation of proteins of similar surface activity and for example hydrophobicity. It is
assumed that such proteins would share common sequences of amino acids, i.e. be
same-class proteins.
Desalting a wool protein solution does not immediately lead to precipitation if the pH is
above the pl of all wool proteins Wool in the soluble denatured form will exist in part as
long unwound strands of protein which are exposed for much of their length. Proteins as
amino acid polymers have titratable functional groups varying in pK. It is the collective
action of these groups that define the pl of the protein (Janson and Ryden, 1996). It is
important to recognise the pl as that pH where the sum of the negative and positive
charges on the protein is equal. The solubility of proteins in aqueous buffers depends upon
the properties of exposed surface groups and the environment in which they reside. No
literature cited examined soluble proteins in conjunction with the associated species present
in methods used to solubilize wool. This study aims to investigate the foam fractionation
of soluble wool protein in the presence and absence of the solubilizing agents as a
technique for separation of wool proteins.
1.5 Production of Films and Reconstituted Fibre
Extracted wool protein converted into reconstituted fibre was reported by (Wormall,
1948). Wool protein was reduced with sodium sulfide 25% at 25°C followed by HCl
precipitation. The wet washed curd of precipitated wool protein was dissolved in
cupra-arnmonium solution and extruded to form a reconstituted fibre, however attempts to repeat
these experiments recently failed (Kelly, 1998). In an extension of this experiment,
Wormall (I 948) blended wool protein with casein, producing fibres, but these were deemed
to be somewhat inferior to synthetic fibres available commercially.
Reduced wool protein solution exposed to air in a thin liquid layer will readily re-oxidise to
form cysteine bonds and 'plastic film'. Yamauchi et al. ( 1996) reduced wool with a
combination of urea, 0-mercaptoethanol and sodium dodecyl sulfate (SDS). The resulting
solution was dialysed to remove the urea. The SDS was not completely removed, with 5
or abnormalities were observed in the mice. The breakdown of the film was slower in mice
than by using trypsin. Further work by Kelly ( 1998) using reduced wool proteins suggests
that this is a fertile area for investigation.
The study reported in this thesis has investigated the solubilization of wool protein and the
subsequent separation by foam fractionation. Solubilization was performed by reduction of
disulfide links to form a thiol and by oxidative sulfitolysis to form S-sulfokerateine. Soluble
wool protein was foam fractionated using parameters of pH, protein concentration and
ionic/urea content. The wool protein solutions were analysed for urea, ionic species and
total protein. A method for assay of total protein using gel permeation chromatography
CHAPTER TWO
Materials and Methods
2.1 Reagents and Equipment
Scoured, unbleached wool (Romney-crossbred mix, reference number 3J) was supplied by
Wool Research Organisation of New Zealand, (WRONZ). Bovine albumin, (BSA, MW
66,000), egg albumin (EA, MW 45,000), carbonic anhydrase (CA, MW 24,000),
bicinchoninic acid, bee venom (BV, MW 2,050), dextran 10,000, MW 10 kD, dextran
2,000 kD, polyethylene glycol 3000 and 2-[N-cyclohexylamino]ethanesulfonic acid
(CHES) were purchased from Sigma, St Louis, USA. Monopotassium dihydrogen
phosphate, dipotassium hydrogen phosphate, potassium chloride, sodium tetrathionate,
acetonitrile, 2-aminoethanol were purchased from BDH, Poole, England. Sodium sulfite
and sodium sulfide were purchased from May and Baker, Dagenham, England. Sodium
azide was purchased from Ajax, Sydney, Australia. United States Biochemical
Corpration, Cleveland, USA supplied tris(hydroxymethyl)aminomethane (Tris). Sodium
chloride was purchased from Univar, Melbourne, Australia. Sodium tetrathionate
(Kurtenacker and Matejka, 1931) was synthesised in the laboratory with iodine and
sodium thiosulfate from BDH, Poole, England. Wherever possible all other reagents were
of analytical grade. Water was four-bowl Milli-Q grade. The Sephadex G-15, particle
size 40-80 µm and G-75 superfine, particle size 40-120 µm were from Pharmacia,
Uppsala, Sweden.
The GPC columns were connected to a Waters Associates HPLC system from Milford,
USA. This comprised a Model 510 pump, a Model 441 UV absorbance detector with
extended wavelength capability and a Rheodyne injection system Contati, USA. The
recorder was a Model Omniscribe from Houston Instruments, Austin, USA. A Smart TM
System HPLC, Model SMAPS0-01-537 from Pharmacia, Uppsala, Sweden, coupled to a
NEC Computer, Model MultiSync 3 FG was used for control of chromatographic
UV Nis absorption measurements were made usmg a Model 8452 Diode Array
Spectrophotometer manufactured by Hewlett-Packard USA A Phillips Morse computer,
model PC AT, Amsterdam, Holland was used for the data processing, with printing of
spectrophotographs on a Thinkjet printer from Hewlett-Packard.
CE and CGE were performed on a Model 270A Capillary Electrophoresis, Applied
Biosystems, Burwood, Australia. The uncoated silica capillaries, 750 mm x 50 µm were
supplied by SGE, Houston, USA The chart recorder, code no. 19-8004-01 and Eppendorf
tubes were from Pharmacia, Uppsala, Sweden.
2.2 Routine Operations
► Wool 10 g was cleaned for experimental purposes by gently agitating in the following
successive washes. The wool was submerged in 500 mL of water at 60°C for 5
minutes, then drained, then placed in 300 mL isopropyl alcohol at 60°C for 5 minutes,
then drained, then placed in 300 mL of hexane at 40°C for 5 minutes, then drained,
then finally placed in water 500 mL at room temperature, drained and left to dry in the
fume hood overnight.
► Wool fibres were macerated during the OSP and RP studies with a Model T45
Ultra-Turrax, Janke and Kunkel, Breisgau, Germany. Wool was intermittently macerated
using a 30 sec maceration every 15 min with magnetic stirring in between macerations.
► Sodium assay was performed on foam samples with a Coming Flame Emission
Photometer Model 410, supplied by Ciba Coming Diagnostics Scientific Instruments,
Halstead, Essex.
► Conductivity was measured using a conductivity meter, Model CDM83, Radiometer,
Copenhagen, Denmark. Measurement of pH was performed with a calomel electrode
connected to a Model 501 Digitalionalyser/5, Orion Research, Cambridge, USA All
measurements were at room temperature of 20
±
2°C. The resting buffer was pH 7.0.► Surface tension was measured with a surface and interfacial torsion tension balance
manufactured by Whites Electrical Instruments, Malvern, England.
► Ultrafiltration was performed either using a Model 8400, 300mL stirred pressure cell
and membranes from Amicon, Beverley, USA, or a Model Vivaflow 50 modular
2.3 Ultraviolet/Visible Spectrophotometry
Measurements of the absorption were performed using 4 cm3 cuvettes with a l cm path
length. Quartz cuvettes were used for 190-300 nm and plastic cuvettes for 300-560 nm
from Stama, Romford, England.
2.4 Dissolution of Wool Protein
Reduced Wool Protein by Sulfide Ion (S2-)
The wool was cut into 1 cm lengths. The wool was cleaned as stated in Section 2.2. To
400 mL of (5%) sodium sulfide solution, (25 g Na2S.xH20 in 500 mL), was added 40.0 g
of washed butt wool. The mixture was macerated for 3 hours in a water-jacketed stainless
steel, sealed container that had a continuous flow of nitrogen gas passed over the mixture.
Maceration was from three crossed sets of blades spinning at 600 rpm. The wool mix was
centrifuged at 10,000 rpm for 30 minutes, the supernatant fluid decanted and kept under
nitrogen. The residual wool fibre was twice agitated with water and centrifuged, the
supernatant liquid being discarded. The undissolved wool was filtered under suction and
oven dried (60°C) to constant mass to allow calculation, by difference of the amount of
dissolved wool.
Reduced Wool Protein by Thioglycollate Ion (HOOCCH2.s)
The wool was cleaned as stated in Section 2.2 and cut into 1 cm lengths. A 0.5M
thioglycollic acid was prepared by adding 30.3 mL to 200 mL of water, 20 g potassium
hydroxide was added and then titrated to pH 10 with SM potassium hydroxide. Wool 25 g
and urea 180 g (3 mol) was added to 200 mL potassium thioglycollate, the whole made up
to 500 mL with water. The mixture was left to soak for an hour prior to being macerated
for 3 hours in a water-jacketed, stainless steel, sealed container that had a continuous flow
of nitrogen gas passed over the mixture. The mixture was centrifuged l 0,000 rpm for 20
minutes. The wool residue was washed twice with 250 mL water, the filtrate being added
to the dissoluted wool. The residue wool was filtered over a large 1 00µm sieve, agitated
with acetone. The undissolved wool was filtered under suction and oven dried (60°C) to
constant mass to allow calculation, by difference of the amount of dissolved wool.
Reduced Wool Protein by Hydrogen Sulfide Ion (HS-)
The wool (T exel cross Romney) was cleaned as stated in Section 2,2 and cut with a wool
sampler into ~2 mm lengths. To sodium hydrogen sulfide dihydrate 1.03 g (10.6 mmol)
was added with stirring 50 mL of water. Wool 4.74 g was added to 50 mL of water and
then combined with the sulfide solution to give a total solution of 100 mL. Nitrogen was
bubbled through the mix for the first 4 hours, after that the flask was stoppered with
additional nitrogen being added whenever the flask was opened. The flask was agitated
by magnetic stirrer. After filtering and mixing with varying quantities of polyethylene
glycol, 5 mL aliquots of filtrate were poured into petri dishes. A thin film was formed on
the plate and left to set in the fumehood overnight.
Reduced Wool by 1,4-dithiothreitol
To 0.6055 g Tris (5 mmol) in 80 mL of water was added urea 48.0 g (0.8 mol) and
1,4-dithiothreitol 0.7712 g (5 mmol) made up to 100 mL with Milli-Q water adjusted with HCl
to pH 9.3. The wool was cleaned as stated in Section 2.2. Wool 1.014 g was cut into ~0.5
cm lengths and mixed into the I 00 mL solution. Maceration was performed for 30 sec
every 15 minutes for the first three hours with nitrogen gas bubbled slowly into the
mixture and head space during maceration. Processing was continued with magnetic
stirring for 21 hours with slow nitrogen bubbling into the liquor. The dissoluted material
was centrifuged 5,000 rpm for 40 min with the supernatant, dissolved wool decanted. The
wool residue was agitated in a succession of washes with water until the filtrate was clear.
The undissolved wool was filtered under suction and oven dried (60°C) to constant mass
to allow calculation, by difference of the amount of dissolved wool.
Sulfitolysis bv Copper Ammonium and Sulfite Ion
Obvious detritus was shaken free from the wool before weighing of the air dried, wool
fibre. A sample (~lg) was removed at the time of weighing and oven dried to constant
dissolved in 150 mL of water was added 50 mL of 0.02M cuprammonium hydroxide and
sodium sulfite 12.6 g (0.1 mol). Chopped wool ~ 1 g (Texel cross Romney) was added to
the reagents and magnetic flea stirred for 24 hours at room temperature as per the method
in Swan (1960). Undissolved wool was washed in O. IM citrate buffer followed by dilute
acetic acid, ( 15 mL glacial acetic acid in 400 mL of water) to remove copper. Filtration
was through a No. l Pyrex sintered glass filter. The undissolved wool was filtered under
suction and oven dried ( 60°C) to constant mass to allow calculation, by difference of the
amount of dissolved wool
Oxidative Sulfitolysis by Tetrathionate Ion
Wool from (Romney-crossbred mix, reference number 31) was cut into ~0.5 cm lengths.
Wool (10 g) was soaked in a dissolution mix comprising, urea (108 g, 1.8 mo!), sodium
tetrathionate (6.12 g, 67mmol), sodium sulfite (5.04 g, 12mmol),
tris[hydroxymethyl]methylamine (2.4 g, 67mmol), in 300 mL of Milli-Q water. The
wool-reagent mix was kept at 4°C whilst soaking for 24 h prior to maceration. The
wool-reagent mix was frozen in a chest freezer with a temperature of - l 9°C. The sequence that
followed was to soak wool at 4°C for 24 h, freeze at -l 9°C for 48 h, thaw at 4°C for 24 h,
this was then repeated before maceration. Maceration in an ice bath was performed as
detailed in Section 2.2 for the first three hours, followed by stirring at 4°C for 21 hours.
The dissoluted material was centrifuged 8,000 rpm for 40 min with the supernatant
decanted from the dissolved wool. The wool residue was agitated in a succession of
washes with water until the filtrate was clear. The undissolved wool was filtered under
suction and oven dried ( 60°C) to constant mass to allow calculation, by difference of the
amount of dissolved wool
2.5 Capillary Electrophoresis and Capillary Gel Electrophoresis
All samples used in CE and CGE were filtered using 0.22 µm Type GV filters from
Millipore Corporation, Beford, USA., with the addition of a pre-filter membrane when
using dissoluted wool samples. Eppendorf sample vials 0.5 mL were used for introduction
of all samples, the buffer volumes of the inject and detector reservoirs were 4 and 12. 5 mL
capillary inject end was positive and solutes eluted in the order cationic, neutral, anionic
species. The polyimide coated fused silica capillary length was 75 cm x 100 µm ID, the
distance from injector to UV detector was 50 cm. The polyimide coating was burnt off the
capillary to create a UV transparent window of- 1.5 cm. This left a carbon residue that
was cleaned off with alcohol.
Routine operation of the capillary electrophoretic instrument
CE
► Wash 2 min
► Buffer 4min
►
Sample 0.5 sec►
Run 45 minCGE
...__
,,
Wash 3 min► Buffer 5 min
► Sample 0.5-1.5 sec range
...__
,,
Run 45 minCGE preparation for PEG/dextran loading.
► Wash 20 min
► Wash
► Wash
► Gel loading
15 min
20 min
20 min
NaOH0.1M
as per section 3. 1
Vacuum
Buffer
NaOH O.IM
as per section 3. 2
Vacuum
Buffer
NaOH 0.lM
HCI 0.IM
water, milli-Q
PEG 3-5 %/Dextran IO %
The detector was set with a risetime of 2 and auto-zeroed. The temperature was in the
range 25-30°C, except for the dextran which was run at 50°C (Guttman et al., 1993).
Voltage was either 12 or 20 kV and the current was kept < 50 µA, to avoid adverse
heating effects. No marker was used, urea was present in all dissolution mixtures and
used as a neutral marker. The new capillary was washed for 20 min in NaOH 0. lM, 20