ePrints Soton
Copyright © and Moral Rights for this thesis are retained by the author and/or other
copyright owners. A copy can be downloaded for personal non-commercial
research or study, without prior permission or charge. This thesis cannot be
reproduced or quoted extensively from without first obtaining permission in writing
from the copyright holder/s. The content must not be changed in any way or sold
commercially in any format or medium without the formal permission of the
copyright holders.
When referring to this work, full bibliographic details including the author, title,
awarding institution and date of the thesis must be given e.g.
AUTHOR (year of submission) "Full thesis title", University of Southampton, name
of the University School or Department, PhD Thesis, pagination
Saliency for Image Description and
Retrieval
by
Jonathon Stephen Hare
A thesis submitted in partial fulfillment for the degree of Doctor of Philosophy
in the
Faculty of Engineering, Science and Mathematics School of Electronics and Computer Science
ABSTRACT
FACULTY OF ENGINEERING, SCIENCE AND MATHEMATICS SCHOOL OF ELECTRONICS AND COMPUTER SCIENCE
Doctor of Philosophy
by Jonathon Stephen Hare
We live in a world where we are surrounded by ever increasing numbers of images. More often than not, these images have very little metadata by which they can be indexed and searched. In order to avoid information overload, techniques need to be developed to enable these image collections to be searched by their content.
Much of the previous work on image retrieval has used global features such as colour and texture to describe the content of the image. However, these global features are insufficient to accurately describe the image content when different parts of the image have different characteristics. This thesis initially discusses how this problem can be circumvented by using salient interest regions to select the areas of the image that are most interesting and generate local descriptors to describe the image characteristics in that region. The thesis discusses a number of different saliency detectors that are suitable for robust retrieval purposes and performs a comparison between a number of these region detectors. The thesis then discusses how salient regions can be used for image retrieval using a number of techniques, but most importantly, two techniques inspired from the field of textual information retrieval.
Using these robust retrieval techniques, a new paradigm in image retrieval is discussed, whereby the retrieval takes place on a mobile device using a query image captured by a built-in camera. This paradigm is demonstrated in the context of an art gallery, in which the device can be used to find more information about particular images.
Nomenclature ix
Acknowledgements xi
1 Introduction 1
1.1 Aims and Objectives . . . 2
1.2 Contributions . . . 2
1.3 Thesis Structure . . . 3
2 Background 5 2.1 Content-based Retrieval . . . 5
2.1.1 Textual Information Retrieval . . . 6
2.1.1.1 Classical Text Retrieval: The Vector Space Model . . . . 6
2.1.1.2 The Vector Space Model Extended: Latent Semantic In-dexing . . . 9
2.1.2 Image Retrieval . . . 11
2.1.2.1 Applications of Image Retrieval . . . 12
2.1.2.2 Retrieval Paradigms . . . 13
Browsing. . . 13
Navigation. . . 13
Query By Example. . . 14
Query By Sketch. . . 14
2.1.2.3 The Fundamental Bases of CBIR . . . 14
Feature Extraction. . . 14
High Dimensional Indexing. . . 14
Image Retrieval System Design. . . 14
2.1.2.4 Recognition and retrieval using salient interest points . . 15
2.1.3 Retrieval Evaluation . . . 16
2.1.3.1 Precision and Recall . . . 16
2.1.3.2 Single Value Summaries . . . 17
Mean Average Precision. . . 17
R-precision. . . 17
2.2 Image Description . . . 17
2.2.1 Saliency for image description . . . 18
2.2.1.1 The Harris Corner Detector . . . 19
2.2.1.2 Saliency from Local Complexity . . . 19
2.2.1.3 Wavelet Based Saliency . . . 20
2.2.1.4 Peaks in a difference-of-Gaussian Pyramid . . . 21
2.2.1.5 Affine Covariant Region Detectors . . . 22
Harris-Affine and Hessian-Affine. . . 22
Maximally Stable Extremal region detector (MSER). . . 24
Affine Scale Saliency. . . 24
2.2.2 Image Features . . . 24
2.2.2.1 Colour Features . . . 25
2.2.2.2 Texture . . . 25
2.2.2.3 Shape . . . 26
2.2.2.4 Robust Local Descriptors - SIFT . . . 26
2.3 The Semantic Gap and Auto-Annotation . . . 27
2.3.1 Auto-Annotation Techniques . . . 27
2.4 Summary . . . 28
3 Image Description using Saliency 30 3.1 Requirements for Saliency Detectors for use in Robust Retrieval Scenarios 31 3.2 A Comparison of Saliency Detectors . . . 31
3.2.1 Kadir’s Scale-Saliency algorithm and Lowe’s DoG-Peaks . . . 31
3.2.1.1 Repeatability . . . 32
Repeatability Criterion. . . 33
3.2.1.2 Repeatability Results . . . 34
3.2.2 DoG-Peaks and the State-of-the-Art Affine-Invariant Detectors . . 34
3.2.2.1 Image Data-set . . . 37
3.2.2.2 Region Overlap and Repeatability . . . 37
Repeatability measure. . . 38
3.2.2.3 Matching . . . 41
Matching score. . . 41
3.2.2.4 Discussion of results . . . 41
General observations. . . 42
Analysis of each transform. . . 43
Conclusions. . . 48
3.3 A Simple Local Colour Descriptor . . . 49
3.4 Summary . . . 51
4 Image Retrieval using Salient Region Descriptors 52 4.1 Basic Model . . . 52
4.1.1 Semantic Relevance . . . 53
4.1.2 Results . . . 55
4.1.3 Discussion . . . 57
4.2 Text Retrieval Approaches . . . 57
4.2.1 Applying Text Retrieval Techniques to Image Retrieval . . . 57
4.2.1.1 Building visual words: Vector Quantisation . . . 57
4.2.1.2 Image Retrieval based on visual words . . . 60
The Classical Approach . . . 60
The Latent Semantic Indexing Approach . . . 61
4.3 Evaluation Techniques . . . 61
4.3.2 Precision, Recall and Semantic Relevance . . . 62
4.4 Results and Discussion . . . 62
4.4.1 The Vocabulary . . . 62
4.4.1.1 Vocabulary size . . . 62
4.4.1.2 Sensitivity of retrieval with different vocabularies . . . . 64
4.4.2 Optimal k . . . 65
4.4.3 Retrieval performance with the Washington data-set . . . 65
4.4.4 Retrieval Performance with the Corel Data-set . . . 69
4.4.5 Computational Performance . . . 73
4.5 Conclusions . . . 73
4.6 Summary . . . 74
5 Query By Mobile Device 75 5.1 Requirements . . . 76
5.2 Approach . . . 78
5.2.1 Geometry-based Re-Ranking . . . 78
5.2.2 Summary . . . 79
5.3 Client-Server Implementation and Technology . . . 79
5.4 Retrieval Performance . . . 80
5.4.1 Discussion . . . 84
5.5 Summary . . . 84
6 Auto-Annotation and Advanced Retrieval 85 6.1 Auto-annotation using Semantic Propagation . . . 86
6.1.1 Preliminary Results . . . 86
6.1.1.1 Image Dataset . . . 86
6.1.1.2 Performance Evaluation . . . 87
6.1.1.3 Experimental Results . . . 88
6.2 Using linear-algebra to associate images and terms . . . 90
6.2.1 Decomposing the Observation Matrix . . . 91
6.2.1.1 Interpreting the decomposition . . . 93
6.2.2 Using the terms as a basis for new documents . . . 93
6.2.3 Summary . . . 94
6.2.4 A Simple Example . . . 94
6.2.5 Some real examples . . . 96
6.2.5.1 Building a training observation matrix . . . 96
6.2.5.2 Experiments with the Washington data-set and SIFT ‘vi-sual’ terms . . . 98
Choosing a good value forkkk. . . 98
Overall Retrieval Effectiveness. . . 98
Example: Querying for “Bridge”. . . 100
6.2.5.3 The effect of including colour features in the Washington data-set . . . 103
6.2.5.4 The Corel data-set . . . 104
6.2.6 Discussion . . . 110
7 Conclusions 113
7.1 Summary and Conclusions . . . 113
7.1.1 Novel work in this Thesis . . . 115
7.2 Future Work . . . 116
7.2.1 Image Description using Saliency . . . 116
7.2.2 Image Retrieval using Salient Region Descriptors . . . 116
7.2.3 Query by Mobile Device . . . 118
7.2.4 Auto-Annotation and Advanced Retrieval . . . 118
7.3 The Future of CBIR . . . 119
Glossary 121
2.1 An illustration of the Vector-Space model . . . 7
2.2 An illustration of Latent Semantic Indexing . . . 9
2.3 Graphical representation of dimensionality reduction . . . 11
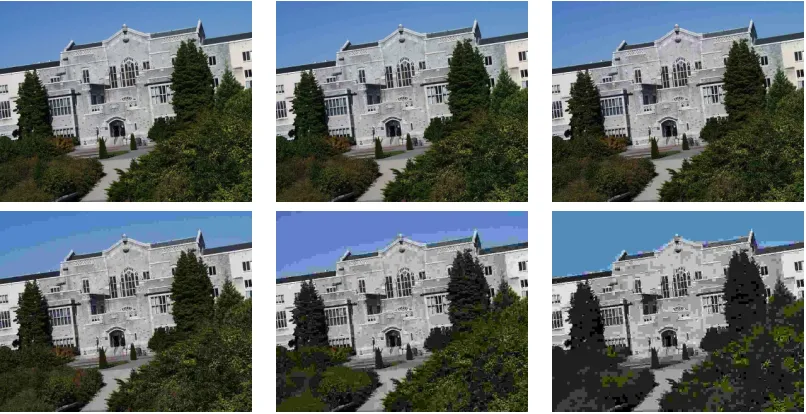
2.4 Examples of saliency operators . . . 23
3.1 Comparison of difference-of-Gaussian and entropy response functions to a 1D signal . . . 32
3.2 Effect of noise to entropy and difference-of-Gaussian response functions . 33 3.3 Sample image from the Washington data-set showing varying transforms . 35 3.4 Repeatability versus rotation and scale . . . 36
3.5 Images of the Affine data-set showing viewpoint change . . . 38
3.6 Images of the Affine data-set showing zoom and rotation . . . 39
3.7 Images of the Affine data-set showing increasing image blurring . . . 40
3.8 Images of the Affine data-set showing increasing JPEG compression . . . 40
3.9 Images of the Affine data-set showing illumination change . . . 41
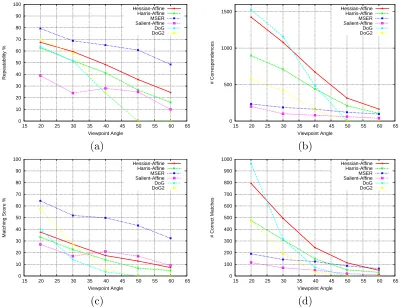
3.10 Detector results for viewpoint change with the Graffiti sequence . . . 42
3.11 Detector results for viewpoint change with the Wall sequence . . . 43
3.12 Detector results for scale change with the Boat sequence . . . 44
3.13 Detector results for scale change with the Bark sequence . . . 45
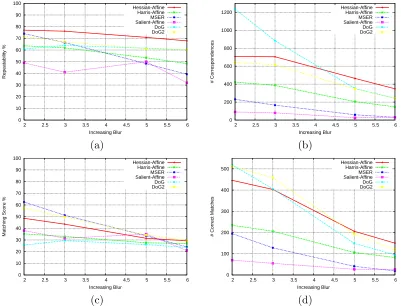
3.14 Detector results for blur change with the Bikes sequence . . . 46
3.15 Detector results for blur change with the Trees sequence . . . 47
3.16 Detector results for increasing JPEG compression with the UBC sequence 48 3.17 Detector results for illumination change with the Leuven sequence . . . . 49
3.18 The dominant colour descriptor applied to DoG regions on the first image of the Graffiti sequence . . . 50
4.1 Sample images and their annotations from the Washington Ground Truth Image Database . . . 54
4.2 Example showing retrieval with the DoG and global methods . . . 56
4.3 Illustration of how the hue and saturation are quantised to form a vocab-ulary of colour ‘visual’ terms . . . 59
4.4 Rank-frequency plot for ‘visual’ words . . . 59
4.5 Generating vectors of occurrences of ‘visual’ terms from an image. . . 60
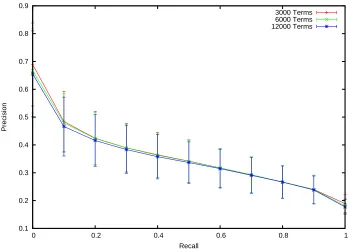
4.6 Precision-recall curves for different sizes of vocabulary using SIFT ‘visual’ terms with vector-space retrieval. . . 63
4.7 Precision-recall curves using the Washington data-set with vector-space retrieval . . . 64
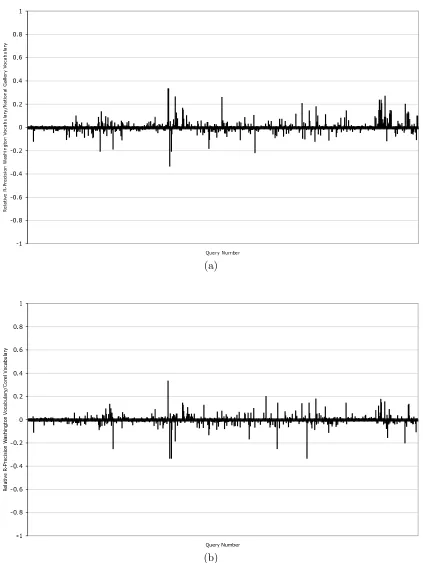
4.8 Relative R-Precision histograms showing the relative performance of
re-trieval using different vocabularies. . . 66
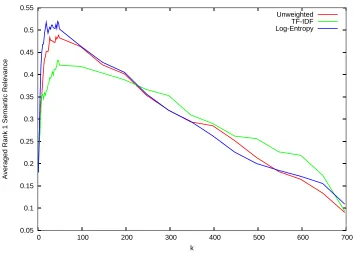
4.9 Effect of varying k with respect to retrieval performance for LSI based retrieval. . . 67
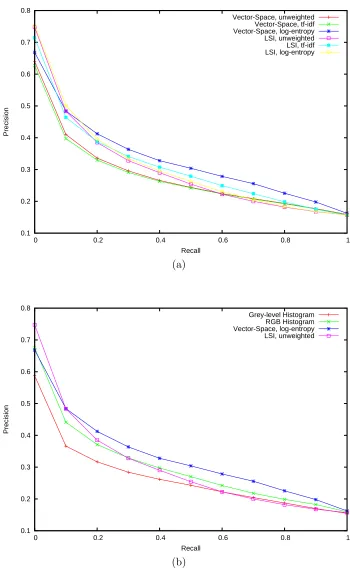
4.10 Precision-Recall for the Washington data-set with SIFT ‘visual’ terms . . 68
4.11 Precision-Recall for the Washington data-set with colour ‘visual’ terms . . 70
4.12 Precision-Recall for the Washington data-set with combined ‘visual’ terms 71 4.13 Precision-Recall for the Corel data-set . . . 72
5.1 Screen-shot from the software demonstrator in capture mode . . . 77
5.2 Montage showing various parts of the metadata shown to a user . . . 78
5.3 Overview of our content-based image retrieval technique. . . 80
5.4 An overview of the mobile image retrieval system. . . 81
5.5 The system in use in a mock art gallery scenario . . . 81
5.6 Example query images captured by the mobile device for testing the per-formance . . . 82
5.7 Plot of the rank of the matching image for a number of different retrieval algorithms. . . 83
5.8 Retrieval rate versusN, the number of images considered for second-stage geometry based re-ranking. . . 83
6.1 Plot of empirical keyword distribution in the dataset . . . 87
6.2 Precision-Recall curves for each of the auto-annotation methods . . . 88
6.3 Example Annotations . . . 89
6.4 Generating cross-language vectors of occurrences of ‘visual’ and annota-tion terms . . . 97
6.5 The effect of kon average precision for four different queries. . . 99
6.6 The effect of kon the Mean-Average Precision over all 170 queries. . . 99
6.7 Average precision-recall curves for the different algorithms over all queries.100 6.8 Average precision of Washington keyword queries . . . 101
6.9 Relative R-Precision histograms of Factorisation versus Vector-Space . . . 102
6.10 Training images containing the “Bridge” keyword. . . 103
6.11 Precision-Recall curves for querying with the keyword “Bridge” . . . 104
6.12 Test Images and their retrieved rank-order . . . 105
6.13 Average precision-recall with different ‘visual’ terms . . . 106
6.14 Relative R-Precision histogram between combined- and SIFT-‘visual’ terms106 6.15 Plot illustrating the effect of varying kwith the Corel data-set . . . 107
6.16 Average Precision-Recall plots for the Corel data-set . . . 108
6.17 R-Precision histograms for the Corel data-set . . . 109
3.1 Number of regions detected by each detector for top-left image in Figure 3.5(a) . . . 44
4.1 Averaged Semantic Relevance for queries based on the rank-1 result image and the closest 5 result images . . . 55 4.2 Semantic Relevance for different sizes of vocabulary using SIFT ‘visual’
terms with vector-space retrieval. . . 63 4.3 Summary of average semantic relevance values for retrieval with the
Wash-ington data-set . . . 67
6.1 Summary of Results . . . 89 6.2 Comparison of precision between Factorisation and Machine Translation . 108
N Number of documents in a given corpus
Vd Vector representing document din a vector-space q Vector representing a query in a vector-space
A The term-document matrix
U Left-hand subspace from an SVD of A
Σ Diagonal matrix of singular values from an SVD of A VT Right-hand subspace from an SVD of A
k number of the space formed when performing Latent Seman-tic Indexing
Uk Reduced left-hand subspace from an SVD of Aconstructed by considering only the firstk-th columns
Σk Diagonal matrix of the largest k singular values from an SVD of A
VT
k Reduced right-hand subspace from an SVD ofAconstructed by considering only the firstk-th rows
Ak Rank k estimate of a term-document matrix formed calcu-lating the productUkΣkVTk
ˆ
q k-dimensional query vector formed by projecting a vector-space query vector, qinto a subspace, qTUkΣ−k1
MAP Mean Average Precision
RPA(i) R-Precision of the i-th query in system A
RPA/B(i) Relative R-Precision of thei-th query between systemAand systemB
I(x) Intensity of the imageI at the pointx
Ix(x) Gradient (1st derivative) of the image I along the x-axis at the point x
Ixx(x) Gradient of the Gradient (2nd derivative) of the image I along the x-axis at the point x
Ixy(x) Derivative of the gradient image Ix along the y-axis at the point x
∗ Convolution operator
M Second moment matrix
H Hessian matrix
σ Standard deviation (of a Gaussian)
c Constant factor relating to the ratio ofσbetween two Gaus-sian distributions in a difference-of-GausGaus-sian
D(x, σ) Result of convolution of an image Ix(x) with difference of Gaussian with standard deviations (σ, cσ)
H Planar homography relating two images
X Point in 3-Space
P1,P2 Projection matrices
p1,p2 Points in 2-space (on the image plane)
|D(ǫ)| Cardinality of (number of elements in) the set D(ǫ)
r(ǫ) repeatability of the points inD(ǫ)
DE(F1,F2) Euclidean distance between feature vectors F1 and F2
Dsalient({F1},{F2}) Distance between two equally sized sets of features{F1}and
{F2}
Rsemantic Semantic relevance
Vn,Z Binary relevance of an image created by thresholding the semantic relevance above and below Z
EN S Normalised score measure
O Observation matrix (analogous to a term-document matrix)
T Term matrix, representing the locations of terms in a se-mantic space
D Document matrix, representing the locations of documents in a semantic space
I Identity matrix
O∗ Ideal, noise-free observation matrix
ˆ
T Estimated noise-free term matrix
ˆ
D Estimated noise-free document matrix
Firstly, I would like to thank Paul Lewis for his support and supervision, without which this thesis would not have been possible. Paul’s ideas and discussion have helped shape the work presented here.
Secondly I would like to thank the EPSRC and Motorola UK Research Laboratory for their continued support in funding this work. In particular, special thanks go to Paola Hobson, Angus Reid, Simon Waddington and Tony May of Motorola UK Research Lab-oratory.
I would also like to thank the members of the lab; in particular, Maria Karam, Si-mon Goodall, Christopher Bailey, Richard Lawley, Patrick Sinclair, Jiayu Tang, Wasara Rodhetbhai and Mark Thompson. Outside of the lab, I would particularly like to thank Jendra Gosai, Amanda Hatton, Deborah Santa Clara and Derya Sahin for their encour-agement, suggestions and discussion.
In addition, I would like to thank the National Gallery for providing the data-set used of experimentation in Chapter 5 of this thesis, and graciously allowing us to use a number of the images as illustrations in this thesis and our other publications.
Finally I would like to thank my parents for their continued love and support.
Introduction
“If I have seen further than others, it is by standing upon the shoulders of giants.”
Sir Isaac Newton
The White Rabbit put on his spectacles. “Where shall I begin, please your Majesty?” he asked. “Begin at the beginning,” the King said, very gravely, “and go on till you come to the end; then stop.”
Lewis Carroll, Alice’s Adventures in Wonderland
We live in the midst of the information age. Information is everywhere, and current society is beginning to require us to document everything, creating more information. In order to avert information overload, we need to develop techniques to search all this information.
This thesis is concerned in particular with visual information in the form of images. Even today, it is not uncommon for owners of digital cameras to have many thousands of photos stored on their personal computers. Mobile phones abound, and almost all modern phones come with built-in cameras of increasingly higher resolution. Through the internet it is possible to view millions of pictures created by others.
On the whole, these images have very little useful external metadata with which they can be indexed and searched, and so there is an increasing need for techniques to search these large image collections based on their content. This thesis attempts to investigate some of the issues involved with content-based search of image collections.
1.1
Aims and Objectives
The original aims of this work were to investigate how salient regions could be used in query-by-example retrieval scenarios where the query image was of particularly poor quality, such as in the case where it had been captured by a camera on a mobile device, such as a cellphone. This objective falls into two intertwined parts; the development of a robust image description using saliency, and the development of a retrieval approach to use this description.
With this objective complete, the work has evolved to investigate more advanced re-trieval techniques, in the form of approaches that allow us to attack, or attempt to bridge the semantic gap. In this thesis, this has fallen into two very different techniques, directly inspired from the first objective. In the first of these techniques, we attempt to bridge the semantic gap by auto-annotation, that is, applying keywords to un-annotated images. In the second approach, we develop a linear-algebraic technique that essentially allows us to model the gap as a semantic space in which keywords and visual features are associated.
1.2
Contributions
This thesis brings a number of clear contributions to a number of fields, but in particular to the field of image retrieval. These contributions are itemised in brief below.
• A comparison of the Scale Saliency algorithm with the difference-of-Gaussian ap-proach to finding salient regions.
• An in depth comparison of the difference-of-Gaussian algorithm to a number of state-of-the-art affine-invarient salient region detectors.
• The development of approaches to indexing images using descriptors of salient regions, in particular, approaches using information retrieval techniques adopted from the text retrieval field.
• Development of new techniques for assessing image retrieval performance when doing query by image content tasks in association with annotated test image sets.
• The development of an approach to improving the ranking of retrieved objects based on the existence of a planar homography between salient regions.
• The development of a demonstrator system that uses the above techniques to enable ‘query by mobile device’.
• Formalisation and extension of an approach for text retrieval known as Cross-Language Latent Semantic Indexing which enables semantic spaces representing the relationships between observations of keywords and image features to be cre-ated using techniques from linear algebra. The technique allows un-annotcre-ated doc-uments to be projected into the semantic space, uncovering hitherto unknown rela-tionships, and allows these (un-annotated) documents in the space to be searched by keyword.
The research has led to four refereed conference publications on varying subjects, and one refereed workshop paper; Hare and Lewis (2003) discussed the applications of the Scale-Saliency algorithm (Kadir, 2001) for image matching, tracking and recognition/re-trieval. Hare and Lewis (2004) described an evaluation of the Scale-Saliency algorithm and difference-of-Gaussian peaks detector (Lowe, 1999, 2004), and proposed a method of using the salient regions for query by example (QBE) tasks. The paper also proposed a new method for assessing retrieval performance of QBE tasks with annotated image sets. Hare and Lewis (2005a) demonstrated the idea of query by mobile device within an art gallery scenario, using content-based retrieval approaches evolved from Hare and Lewis (2004) using a vector-space retrieval model. Hare and Lewis (2005b) discussed the retrieval techniques described in Hare and Lewis (2005a) with respect to a more traditional retrieval environment. In addition the work was extended to cover another indexing approach called Latent Semantic Indexing (LSI), and a comparison was per-formed. Finally, Hare and Lewis (2005c) proposed a simple method for auto-annotation by propagation of keywords from similar images. Image similarity was assessed using both the vector-space and LSI indexing techniques.
1.3
Thesis Structure
This thesis describes the work of the author in attempting to achieve the objectives outlined earlier in this chapter. The early chapters of the thesis attempt to document and describe existing research towards these goals. Chapters 3 through 6 describe the actual research undertaken by the author, and Chapter 7 presents the conclusions of this research together with some views of the author regarding directions for future research. The following list describes the structure and content of the thesis on a chapter by chapter basis.
Chapter 2 - Background. Introduction to the background behind content-based re-trieval, computational saliency, auto-annotation and the semantic gap. Also dis-cusses techniques for assessing performance of retrieval and auto-annotation.
on the performance of the difference-of-Gaussian peaks detector. A simple local-colour descriptor is also introduced.
Chapter 4 - Image Retrieval using Salient Region Descriptors. Investigates a number of techniques for image retrieval using the salient regions discussed in the previous chapter. The chapter culminates with the discussion of image retrieval techniques inspired by models from the text retrieval community.
Chapter 5 - Query by Mobile Device. Description of an example system that demonstrates the use of the techniques from the previous two chapters for im-age retrieval on a mobile device within an art gallery scenario. The system allows image queries to be captured using a camera built into the device and sent to a server for processing. The server returns metadata, such as a web-page corre-sponding to the closest matching image in a database, which is then displayed to the user on the screen of the device.
Chapter 6 - Auto-Annotation and Advanced Retrieval. Research into two ad-vanced image retrieval strategies that attempt to bridge the semantic gap. The first strategy describes a simple auto-annotator using the techniques from Chap-ters 3 and 4. The second technique builds in particular on the Latent Semantic Indexing approach described in Chapter 4 in order to construct a semantic space that can be used to search for un-annotated images by keyword.
Background
“We operate with nothing but things which do not exist, with lines, planes, bodies, atoms, divisible time, divisible space — how should explanation even be possible when we first make everything into an image, into our own im-age!”
Friedrich Wilhelm Nietzsche
This thesis uses techniques from a number of vast and multi-faceted fields, covering everything from information retrieval, to cognitive psychology (in the form of saliency), to computer vision. Whilst it would be far beyond the scope of this chapter to review all of these fields in depth, the chapter attempts to describe the techniques and prior art used throughout the remainder of the thesis.
The chapter begins by reviewing techniques in content-based retrieval; firstly textual information retrieval, and then image retrieval. This is followed by a discussion of techniques for image description, in particular techniques using salient points or regions. Finally the chapter looks at techniques for auto-annotation as an attempt to bridge what has been described as thesemantic gap. Thesemantic gap can be described as the gap between low-level image descriptions, and the high-level semantics that the images convey and in which users typically prefer to articulate their queries.
2.1
Content-based Retrieval
Content-based retrieval is a technique for retrieving documents from a store such that the contents of the retrieved documents satisfy a user-provided information need. Unlike database retrieval, where a query is well defined and returns a set of records that exactly match the required specifications, content-based retrieval attempts to find objects or documents that are most similar to a specific query. The content-based retrieval process
usually involves generating signatures from the content of each of the documents in the archive or corpus, and comparing these signatures to the signature of the query. Results are usually ranked in terms of howsimilar their signatures are to the query signature. The next part of this section describes two techniques for content based retrieval of tex-tual documents, where the document signatures are created from vectors of the number of times each word in a lexicon occurs within the document. The final part of the section describes a number of techniques for the content-based retrieval of images.
2.1.1 Textual Information Retrieval
Archaeological evidence has suggested that man first begun organising information for later retrieval and usage over 4000 years ago. Examples of this include tables of contents in books. As the numbers of books increased, it became necessary to build specialised data structures to ensure fast data access, An old and popular data structure is theindex, which contains a collection of words or concepts, and pointers to the related information. Traditionally, indexes have been manually created as forms of categorisation hierarchy which allow books of similar content to be grouped together, thus allowing a primitive form of content-based retrieval. Even today, libraries still use categorisation hierarchies, such as the Dewey decimal system (Dewey, 1876).
From around the mid to late 1960’s, corresponding with the beginnings of the informa-tion age, research began on automatic computainforma-tional approaches to text indexing and retrieval. The research led to three classic classes of models in information retrieval; the set theoretic Boolean models, algebraic vector models, and probabilistic models. The original vector model and a modern extension called Latent Semantic Indexing form a basis of this thesis, and are described next.
2.1.1.1 Classical Text Retrieval: The Vector Space Model
The vector-space model was developed by Salton et al. (1975). Most classical text retrieval systems work in the same general way, by representing a document and query as a set of terms. In the vector-space model, these terms are represented as axes in a vector space, using weighted term frequency as the distance along the axis corresponding to that term. Figure 2.1 illustrates the main idea behind the Vector-Space model, and the standard steps involved with creating this model are discussed below.
T e r m 1 Te
r
m
2
T erm
3
D o c u m e n t 1
D o c u m e n t 2
Figure 2.1: An illustration of the Vector-Space model; Document similarity is mea-sured by angle between document vectors.
connection, and connections are all represented by the stem connect. Words with a common stem will often have similar meanings. Various algorithms for stemming have been developed, for example, the Porter Stemmer (Porter, 1980), which stems English words.
Stop Lists. The next stage is to apply a stop list. The stop list is used to reject com-mon words which occur frequently throughout the corpus of documents, and therefore are not discriminating for a particular document. Examples of such words include words like ‘and’, ‘an’ and ‘the’.
Representing documents by word frequency. Each of the words from the docu-ment (after application of the stop list) are then represented by a unique identifier for that word. The number of occurrences of each word in the document is then counted and a vector of word-frequencies is created to represent the document.
Frequency weighting. Each component of the vector of word frequencies is often weighted. In the case of the Google web search engine, the weighting of terms within a particular web page depends on the position or class of the word within the page; for example, words in the title may be given a higher weight (Page and Brin, 1998).
A standard way of weighting the frequency vectors of text documents in the vector-space model is called ‘term frequency-inverse document frequency’,tf-idf, and is computed as follows1. Suppose that there is a vocabulary of k words, then each document is repre-sented by ak-dimensional vectorVd= (t1, . . . , ti, . . . , tk)T of weighted word frequencies
1tf-idf actually refers to a class of different formulae for weighting terms, however, for simplicity we
with components
ti =
nid
nd
logN
ni
, (2.1)
wherenid is the number of occurrences of wordiin documentd,nd is the total number of words in the documentd, ni is the number of documents in which the term ioccurs in the whole database and N is the number of documents in the whole database. The weighting is the product of two terms: the word frequencynid/ndand the inverse
docu-ment frequency logN/ni. The intuition is that word frequency increases the weights of words that occur frequently in a particular document, and thus describe it well, whilst the inverse document frequency down-weights words that appear often in the database.
Indexing using Inverted Files. Inverted file structures are used for efficient re-trieval. An inverted file is like an ideal book index. Each word in the collection has an entry in the inverted file, together with a list of documents (and the positions in which the words occurs in them) that contain that word.
Searching: Ranking the results. In order to search the database of documents, a tf-idf vector q is created for the query terms or document, and the query vector is compared against all the vectors Vd in the database. The documents in the database
are ranked using the normalised scalar product (cosine of angle):
cos(θ) = q•Vd
|q||Vd|
(2.2)
T e r m 1 "C a t " Te r m 2" F e l in e
" D o c u
m e n t 1
D o c u
m e n t 2
P s e u d o 2
T e r m 1 Ps
e
u
do8
T
e
r
m
2
D o c u
m e n t 1
D o c u
m e n t 2
L S I
Figure 2.2: An illustration of Latent Semantic Indexing; LSI reduces the dimension-ality so that similar documents have a smaller angle between their vectors.
2.1.1.2 The Vector Space Model Extended: Latent Semantic Indexing
The classical approach to text retrieval described above depends on a lexical match between the words in the query and those in the document collection. However, there is often a lot of diversity in the words used to describe a document (synonomy), and the words often have multiple meaning (polysemy), making the lexical methods incomplete and imprecise. Deerwester et al. (1990) suggest that it is possible to take advantage of the implicit higher-order structure in the association of terms with documents by determining the singular value decomposition (SVD) of large sparse term-by-document matrices. Terms and documents represented by thek largest singular vectors are then matched against user queries. Deerwester calls this retrieval method Latent Semantic Indexing (LSI) because the k-subspace represents important associative relationships between terms and documents that are not evident in individual documents (Berry et al., 1994). Figure 2.2 illustrates this idea.
The Term-Document Matrix and its Decomposition. LSI begins by construct-ing a vector space representation for each document, representconstruct-ing each document by a vector of word frequencies, as described in the previous section. The vectors are then arranged into a matrixA, which is known as the term-document matrix. An individual element in A, aij represents the frequency of term i in document j. The matrix A is usually very sparse because every word does not normally occur in each document. It is normal to apply weightings to each element of A, such that:
aij =L(i, j)×G(i) (2.3)
Log-Entropy Weighting. The most commonly used weighting for LSI is the “Log-Entropy” weighting. The local weighting is the log of the term-frequency of an individual document, and the global weighting is related to the entropy of the term frequency over the entire collection. This weighting scheme ensures that a term whose appearance tends to be equally likely among the documents is given a low weight and a term whose appearance is concentrated in a few documents is given a higher weight. The equations for the weighting are as follows:
L(i, j) = log(tfij + 1) (2.4)
G(i) = 1−
N
X
j=1
tfij
gfi log(
tfij
gfi)
logN , (2.5)
where tfij is the frequency of term i in document j, gfi is the total number of times term i occurs in the entire collection, and N is the total number of documents in the collection.
Decomposition into a subspace. Once the weighted term-document matrix has been created, it is decomposed using the singular value decomposition. Briefly, SVD is used to decompose matrix A into the product of three separate matrices,U,Σ,VT:
A=UΣVT (2.6)
The monotonically decreasing (in value) diagonal elements of the matrixΣare called the singular values of the matrixA. These matrices represent the breakdown of the original relationships into linearly-independent vectors or factor values. By selecting the first (largest)k singular values of A, it is possible to construct a rank-kapproximation to A
via Ak =UkΣkVTk. This is illustrated in Figure 2.3. A theorem by Eckart and Young (1936)(see also Golub and Reinsch, 1971) suggests that the Ak constructed from the largest k singular values of A is the closest rank-k approximation (in the least squares sense) to A. In terms of LSI, Ak is the closest k-dimensional approximation to the original term-document space represented by A. By reducing the dimensionality ofA, much of the “noise” that causes poor retrieval performance is thought to be eliminated.
m x n m x r r x r r x n T e
r m V e c t o
rs k
k k
k
D o c u
m
e
n
t
V e c t o r s
Figure 2.3: Graphical representation of dimensionality reduction of the term-document matrix using the singular value decomposition.
vector can be projected into thek-dimensional subspace:
ˆ
q=qTUkΣ−k1 (2.7)
The k-dimensional query vector, ˆq can then be compared against each of the docu-ment vectors and the results ranked. Again, a common similarity measure is the cosine similarity, described in Section 2.1.1.1.
2.1.2 Image Retrieval
To discuss the field of image retrieval in much detail would be far beyond the scope of this thesis. However, this section will attempt to give an overview of the salient facets and techniques of the field, drawing particular attention to the techniques built upon later in this thesis. Excellent reviews of image retrieval, and in particular content-based image retrieval can be found in the review articles by Smeulders et al. (2000) and Rui et al. (1999) and the report by Eakins and Graham (2000).
Active research into image retrieval has taken place since the late 1970’s (Rui et al., 1999). Image retrieval has been approached from two main directions in the past by different communities; Database Management and Computer Vision. The Database Management community focused on techniques for retrieving images based on textual keywords or annotations, whilst the Computer Vision community investigated visual retrieval techniques. Nowadays, and into the future, these two areas of retrieval are becoming more intertwined, as discussed later in this chapter and in the concluding chapter of this thesis.
dealing with large numbers of images. The first of these problems is simply that of the expense of annotating each of the images. The second is related, and is about the subjectivity of the annotators; different people may perceive an image in different ways, and thus apply different annotations. This subjectivity may cause unrecoverable errors or mismatches in the retrieval process. The text-based image retrieval methodology is discussed in detail in the review papers by Chang and Hsu (1992) and Tamura and Yokoya (1984). The most pervasive text-based image search system available presently is perhaps the Google image search (http://images.google.com), which indexes images based on text and metadata from the web-page on which the image is embedded (Google Inc., 2005).
Over the last 15 years or so, the problems surrounding the text-based image retrieval approaches have become more and more acute due to the ever increasing size of image collections. The early 1990’s saw the proposal of a new technique - Content-based Image Retrieval (CBIR). The aim of the content-based approach was to retrieve images relevant to a query, not by their keywords, but rather by their own visual content, such as the colours and textures within the image.
2.1.2.1 Applications of Image Retrieval
Smeulders et al. (2000) follows the categorisation of Cox et al. (2000) in describing the broad categories of user aims in image retrieval. Cox et al. (2000) describes these aims as Target-Specific Search or, simply, Target Search, Category Search and Open-Ended Search - Browsing.
In Target Search, users are required to find a specific image within a database; the search can only terminate when the specific image is found. Examples of where this type of search is valuable include checking whether a particular logo has been registered, searching for a particular photograph tied to a historical event, searching for a precise image in mind - as in searching art catalogues (e.g. Flickner et al., 1995), and, searching for a specific painting in order to find out the artist and title (e.g. Chan et al., 2001; Hare and Lewis, 2005a).
These three categories do not fully describe all of the aims of users when retrieving images, as shown by Armitage and Enser (1997). Enser (1995) attempts a more generic categorisation of image retrieval query requests from archives of still and moving im-agery. Ornager (1997) studied how journalists retrieved images and identified five typical patterns. Ornager’s patterns were classified as follows:
• Thespecific inquirer who asks very narrow questions, because he/she has a specific photograph in mind;
• The general inquirer who asks very broad questions because they want to make their own choice;
• Thestory teller inquirer who tells about the story and is open to suggestions from the archive staff;
• The story giver inquirer who hands the story over to the staff wanting them to choose the photograph(s); and
• Thefill in space inquirer who only cares about the size of the photograph in order to fill an empty space on the page.
2.1.2.2 Retrieval Paradigms
The applications and user aims within content-based image retrieval described above have led to a number of paradigms or methods by which images can be retrieved. Some of these methods are listed below.
Browsing. Retrieval by browsing is perhaps the most commonly used paradigm. It is used by people often on a daily basis when trying to find information (not necessarily on a computer). The process is largely an iterative one in which the user gets closer to the information they require in an iterative manner by repeatedly selecting subsets of data. A common example of this is of a user searching for information in a library; The user will locate the appropriate section of the library (perhaps with the aid of a classification scheme, such as the Dewey Decimal System (Dewey, 1876)) in the first iteration, then select the appropriate shelves, then books, etc.
(Microcosm Architecture for Video, Image and Sound) (Lewis et al., 1996b) provided generic linking for non-textual media; enabling linking based on the use of the media as the link anchor. The MAVIS II system (Lewis et al., 1996a; Dobie et al., 1999) extended the concept by incorporating a multimedia thesaurus, enabling navigation by concept.
Query By Example. Query by Example (QBE) is perhaps the most common form of retrieval in the content-based image retrieval community. The method allows users to specify queries in the form “find me documents like this one”. In addition to finding similarity matches, QBE can be used for finding exact matches (Target Specific searching).
Query By Sketch. Query by sketch allows the user to interactively generate a proxy document from which to perform a query by example style search. The proxy document generation could involve laying out shapes to indicate where particular colours should appear within the retrieved documents (Huang et al., 1996).
2.1.2.3 The Fundamental Bases of CBIR
Rui et al. (1999) describe three fundamental bases for Content-Based Image Retrieval. The bases are described briefly below.
Feature Extraction. The first stage of content-based image retrieval is to extract features from the image. These features represent some of the content of the image in some form. For example, the feature may describe the global colour distribution of the image. Feature extraction is described in more depth in Section 2.2.
High Dimensional Indexing. In order to make content-based image retrieval truly scalable, the extracted features have to be indexed in some manner. Proposed techniques for indexing have included tree structures, such as theR∗-tree (Beckmann et al., 1990)
and priority k-d tree (White and Jain, 1996), clustering approaches (Charikar et al., 2004; Rui et al., 1997a), and neural network approaches (Zhang and Zhong, 1995). Some of the tree-based indexing techniques have been criticised in the literature because they break down when the number of dimensions exceeds about 20.
in detail, including the first commercial system, QBIC (Flickner et al., 1995; Niblack et al., 1993; IBM Corporation, Accessed 10/9/2005), and the MARS system (Huang et al., 1996; Rui et al., 1997b).
2.1.2.4 Recognition and retrieval using salient interest points
Image description using saliency is described in detail in Section 2.2. However, the following descriptions give an overview of theprior art of the use of saliency in retrieval. The ground-breaking work of Schmid and Mohr (1997) showed that it was possible to extend invariant local feature matching to general image recognition problems where a feature was matched against a large database of images. Schmid and Mohr used Harris corners (see Section 2.2.1.1)to detect interest points and used a local jet - a rotationally invariant feature descriptor to describe the characteristics of the local image region around the interest point. This demonstrated that it was possible to allow features to be matched under arbitrary orientation change between two images. It also showed that multiple feature matches could accomplish recognition under occlusion and clutter by identifying consistent clusters of matched points.
Harris corners are very sensitive to scale change, and so researchers began looking at other methods for selection of salient points. Lowe (2004) used peaks in the difference-of-Gaussian pyramid to select interest points and developed a highly distinctive local descriptor that is insensitive to small perturbations in location. He then went on to develop techniques for verifying object matches based on clusters of matching salient points. Shokoufandeh et al. (1999) developed a graph based matching and recognition strategy based on their wavelet based salient regions.
Each of the retrieval algorithms based on salient regions described above demonstrate a clear advantage over the use of global descriptors for image retrieval. Each of the methods showed a significant improvement in both retrieval accuracy and precision.
2.1.3 Retrieval Evaluation
Performance evaluation has become an increasingly important problem over the years. In the field of information retrieval, performance has often been measured by comparing how many documents returned for a query are actually relevant to that query. However, the problem with this is that the definition of what is relevant is subjective. To solve this problem, collections of documents must be created with distinct categories. This approach has been used with much success in the text retrieval community in conferences like TREC (Text REtrieval Conference), where there is a standard corpus of documents and categories, and a well defined protocol for retrieval engine evaluation. The TREC evaluation has motivated a similar effort for assessing content-based retrieval for video called TRECVid.
The most common measures of information retrieval are described below. Smith (1998) gives a review of these measures and more, with regards to content-based image retrieval.
2.1.3.1 Precision and Recall
The standard metrics for performance evaluation of information are called precision and recall. The precision of a query is defined as the ratio of the number of returned relevant documents to all documents returned by a retrieval system:
precision= |retrieved relevant|
|retrieved| (2.8)
Recall is defined as the ratio of the number of retrieved relevant documents to the number of documents from the entire corpus that are relevant to the query:
recall= |retrieved relevant|
|relevant| (2.9)
2.1.3.2 Single Value Summaries
Rather than comparing plots of precision and recall, it is sometimes useful to have a single value by which to compare the retrieval performance. The mean average precision (MAP) and R-Precision are two such values.
Mean Average Precision. The average precision is the average of the precision after each relevant document is retrieved:
AveP =
PN
r=1(P(r)×rel(r))
|relevant| , (2.10)
wherer is the rank, rel(r) is the binary relevance of the document with rankr, andP(r) is the precision of that document. The Mean Average Precision is the average precision, AveP averaged over all queries.
R-precision. The R-precision is the precision afterRdocuments have been retrieved, where R is the total number of documents relevant to the query. By definition, the recall at the R-precision is equal to the R-precision. The R-precision can be averaged over all queries, and in fact the averaged R-precision is highly correlated with the MAP (Aslam et al., 2005). The R-precision is useful for comparing two retrieval algorithms on a query-by-query basis. Let RPA(i) and RPB(i) be the R-precision values of two algorithms A and B for the i-th query. If we then define the difference, or relative R-precision,RPA/B(i) to be,
RPA/B(i) =RPA(i)−RPB(i) . (2.11)
Positive values of RPA/B(i) indicate that algorithm A has better performance for the query, negative values indicate algorithm B is better, and an RPA/B(i) equal to 0 in-dicates both algorithms perform equivalently. Multiple RPA/B(i) values for different queries can be plotted in the form of of a histogram in order to give an overview of how the two algorithms perform relative to one another.
2.2
Image Description
Image description is the process of creating descriptions of the visual content of an image in a form that is useful to the problem being solved. In its lowest form, an image description, or signature, is a collection of one or more features that describe some aspect of the image content.
researchers have begun to realise that global descriptors are not neccessarily good when it comes to describing the actual objects within the images and their associated semantics. Two approaches have grown from this realisation; firstly approaches have been developed whereby the image is segmented into multiple regions, and separate descriptors are built for each region; and secondly, the use of salient points has been suggested.
The first approach has been demonstrated to work (Carson et al., 2002), although it has a large problem — that of how to perform the segmentation. Over the years many techniques for performing image segmentation have been suggested, although none really solve the problem of linking the segmented region to the actual object that is being described. Indeed, this shows that the non-naive segmentation problem is not just a bottom-up image processing problem, but also a top-down problem that requires knowledge of the true object before it can be successfully segmented.
The second approach avoids the problem of segmentation altogether by choosing to describe the image and its contents in an altogether different way. By using salient points within an image, it is possible to derive a compact image description based around the local attributes of the salient points. A number of different methods for finding salient points have been suggested, from the simple Harris and Stephens (1988) corner detector, to wavelet based approaches (Shokoufandeh et al., 1999; Sebe et al., 2003; Sebe and Lew, 2003), to methods centred around image entropy (Kadir, 2001; Kadir and Brady, 2001). Many previous approaches to using salient points have generated feature-vectors from pixel data in fixed-sized regions around the salient point, usually a 3×3 or 9×9 pixel neighbourhood centred on the point (Sebe et al., 2003), although some of the modern state-of-the-art detectors find affine invariant regions and generate descriptors from within the region (Tuytelaars and Gool, 1999; Sivic and Zisserman, 2003; Obdrzalek and Matas, 2003).
2.2.1 Saliency for image description
2.2.1.1 The Harris Corner Detector
The interest point detector developed by Harris and Stephens (1988) is perhaps the most widely cited and ubiquitous of all interest point detectors. It is often used as a baseline for comparing the performance of newer detectors. The Harris Corner detector works by considering the second moment, or auto-correlation, matrix:
M=µ(x) =
"
Ix2(x) IxIy(x)
IxIy(x) Iy2(x)
#
(2.12)
whereI(x) is the grey level intensity of the image at pointxandIx(x) is the derivative of I in the direction of the x-axis at the point x. Similarly, Iy(x) is the derivative ofI in the direction of they-axis at the pointx. If at a certain point the two eigenvalues of the matrix M are large, then a small motion in any direction will cause an important change in grey level. This indicates that the point is a corner. The corner response function is given by:
R= detM−k(traceM)2 (2.13)
where k is a parameter set to a value of 0.04 (a suggestion of Harris). Corners are defined as local maxima of the corner response function. Sub-pixel accuracy can be achieved through quadratic approximation of the local neighbourhood of the local max-ima. Corners due to image noise can be avoided by smoothing the images containing the squared derivatives (Ix2(x), Iy2(x), IxIy(x)) with a Gaussian filter. Often the corner response function finds too many corners, so the number of corners is often reduced by applying non-maximal suppression and/or only selecting R values above a certain threshold.
The performance of the Harris detector is limited by the ability to estimate the image derivatives in a robust and rotationally insensitive manner. Often, corners found when the image is horizontal will not be found if the image is rotated by 45◦ in the plane.
Figure 2.4(a) illustrates the results of applying the Harris detector to an image.
2.2.1.2 Saliency from Local Complexity
with flatter intensity histogram distributions2tend to have higher signal complexity and thus higher entropy. Gilles’ method only worked at a single scale, and picked single salient points, rather than salient regions.
Kadir and Brady (2001) (see also Kadir, 2001) modified Gilles original algorithm to make it perform well on images other than those from aerial reconnaissance imagery. Essentially they changed the algorithm so that it detected salient regions at multiple scales. The modified algorithm located circular patches of the original image that were considered salient. The size of the patch was determined automatically by the multi-scale additions to Gilles’ algorithm. In addition Kadir and Brady developed a simple clustering algorithm to group together features within theR3 space that have similar x and y location, and scale.
In more detail, the scale-saliency algorithm works by considering circular regions R of radius, or scale, s, centred at a point x within the image I(x). The entropy, H, of each region is calculated from an estimate of the probability density function of pixel intensities, p(I, s) overR, as follows:
H=−X
I
p(I, s) log(p(I, s)) (2.14)
The set of extrema with respect to scale inHis computed over a range of thesparameter for all pixels in the image. For each extremum, a weighting W is calculated as
W =sX
I
|p(I, s)−p(I, s+ 1)|. (2.15)
The saliency,Y, of each circular region is calculated as Y =HW. Kadir’s implementa-tion then applies a simple clustering algorithm to cluster together regions with similar spatial location and scale. Figure 2.4(b) illustrates the results of applying the algorithm to an image.
2.2.1.3 Wavelet Based Saliency
Wiscott et al. (1997) used Gabor wavelet jets to extract salient features for their face recognition algorithm. Wavelet jets represent an image patch, containing a feature of interest, with a set of wavelets across the frequency spectrum. Each set of wavelet responses represents a node in a grid-like planar graph covering overlapping regions within the image, which is in itself a kind of saliency map.
Shokoufandeh et al. (1999) use dyadic multiscale wavelets to find the scale which captures the most efficient encoding of an object’s salient shape. Essentially, a saliency map
2Kadir and Brady (2001) note that the method is not limited to the intensity histogram and that it
is created for each dyadic scale based on the wavelet response and a function that defines whether that scale best encodes an object’s shape. Shokoufandeh et al. (1999) demonstrate the method to find circular patches at each scale.
2.2.1.4 Peaks in a difference-of-Gaussian Pyramid
The idea of using peaks in a difference-of-Gaussian pyramid comes from the work of Lowe (2004, 1999) on object recognition using keypoints. Lowe has shown that by searching a difference-of-Gaussian pyramid for local peaks, both spatially and across scale, it is possible to select points robust to a range of projective transformations.
Koenderink (1984) and Lindeburg (1994) showed that under a variety of reasonable assumptions, the only possible scale-space kernel is a Gaussian function. Therefore, the scale-space of an image is a function L(x, σ), that is produced from the convolution of a variable scale Gaussian,G(x, σ) and the image I(x),
L(x, σ) =G(x, σ)∗I(x), (2.16)
where∗ represents the convolution operation and the 2D Gaussian kernel is given by:
G(x, σ) =G(x, y, σ) = 1
2πσ2e
−(x2+y2)
2σ2 (2.17)
Lowe (1999) proposed that stable interest points (or, in fact regions) could be selected by locating scale-space peaks in the difference-of-Gaussian function convolved with the im-age,D(x, σ), which can be computed from the difference of two nearby scales separated by a constant factorc:
D(x, σ) = (G(x, cσ)−G(x, σ))∗I(x)
= L(x, cσ)−L(x, σ) (2.18)
The difference-of-Gaussian closely approximates the scale-normalised Laplacian-of-Gaussian,σ2∇2G(Lindeburg, 1994; Marr, 1982; Lowe, 2004). Lindeburg (1994) showed that a normalisation of the Laplacian by a factor of σ2 was required for true scale
in-variance. Mikolajczyk (2002) showed that the minima and maxima ofσ2∇2Gproduced the most stable interest points when compared to a range of other operators.
suggests that poorly defined peaks in the difference-of-Gaussian scale space should be rejected.
A poorly defined peak will have a large principle curvature across the edge, but a small one perpendicular to it. The principle curvatures are proportional to the eigenvalues of the 2×2 Hessian matrix, Hcomputed at the location and scale of the interest point:
H=
"
Dxx(x, σ) Dxy(x, σ)
Dxy(x, σ) Dyy(x, σ)
#
(2.19)
The eigenvalues need not be calculated explicitly, as only the ratio of the eigenvalues is important. It can be shown that in order to test that the ratio of principle curvatures is below some threshold, then this is equivalent to checking
trace(H)2 detH <
(r+ 1)2
r , (2.20)
where r is the ratio between the smallest and largest eigenvalues of H. Lowe suggests setting r = 10 which eliminates interest points that have a ratio of principle curvature greater than 10.
It should be noted that whilst Lowe only refers to interest points, the selection of peaks from the difference-of-Gaussian pyramid actually selects regions of the image, where the size of the region is related to the scale of the interest point. Figure 2.4(c) illustrates the results of finding peaks in a difference-of-Gaussian pyramid.
2.2.1.5 Affine Covariant Region Detectors
A number of recent state-of-the-art techniques have been suggested that are able to detect regions that are invariant to affine transforms (Tuytelaars and Gool, 1999; Ob-drz´alek and Matas, 2002; Mikolajczyk, 2002). However, these approaches are not yet fully affine invariant as they start with initial feature scales and locations selected in a non-affine-invariant manner. Mikolajczyk (2002) showed that the performance of his affine invariant detector was below that of the difference-of-Gaussian peaks detection method, until the difference in viewpoint of the two images being matched was very large. A small section of affine-covarient region detectors is discussed here.
(a) (b)
(c) (d)
(e) (f)
Figure 2.4: (a) Interest points found by the Harris Corner Detector; (b) Salient regions found by the Scale-Saliency algorithm; (c) Salient regions found by from peaks in a difference-of-Gaussian pyramid (region radius is equal to the size of the smaller
σin the difference-of-Gaussian). (d) Affine-covarient regions detected by the Hessian-Affine detector. (e) Hessian-Affine-covarient regions detected by the Harris-Hessian-Affine detector.
using the same technique as the Harris detector. The Hessian-affine detector selects points in a similar manner, but instead of selecting points based on the eigenvalues of the second moment matrix, points are selected based on the determinant of the Hessian matrix (c.f. Equation 2.19). The second derivatives used by the Hessian matrix give strong responses to ridge and blob structures, these are very similar to those detected by the Laplacian operator. The use of the determinant penalises very long ridge-like structures where the second derivative in one particular orientation is small.
The scale of the interest point is selected by choosing the characteristic scale at which the local structure gives the maximum response of a Laplacian operator. Figure 3.1 in Chapter 3 illustrates this idea by showing how the response of a difference-of-Gaussian operator (closely related to the Laplacian) to a simple one-dimensional signal over a range of scales. Figure 2.4(d) and (e) show regions found by the Hessian-Affine and Harris-Affine detectors within a sample image.
Maximally Stable Extremal region detector (MSER). The Maximally Stable Extremal Region detector was developed by Matas et al. (2002). The detector finds arbitrarily shaped regions in the form of connected components of an appropriately thresholded image. The regions are extremal because all of the surround pixels have either higher or lower intensity than the pixels within the region. The regions are maximally stable because of the optimal threshold selection process. The stability is measured as a function of how stable the local binarisation of the pixels is over a range of thresholds. As the threshold changes, the number of pixels within a connected region will likely change as well; if the number of pixels is fairly constant, then the region is stable. This definition of region stability based on relative area change is affine-invariant. Figure 2.4(f) shows elliptical regions fitted to the MSER regions in a sample image using the method described by Mikolajczyk et al. (2005).
Affine Scale Saliency. Kadir et al. (2004) presented an extension to the original Scale Saliency algorithm. The modifications involved changing the sampling region from a circle parameterised by its centre and radius (scale) to an ellipse parameterised by its scale (length of the major axis), orientation (of the major axis) and the ratio of major to minor axes. The original clustering algorithm was upgraded with an improved greedy algorithm.
2.2.2 Image Features
There are also pseudo-global descriptors that describe the whole of an image, but are built from the specific arrangement of regions and their descriptors within the image. It is also possible to classify features as being general, or domain-specific. General features include things such as colour and texture, whilst the domain-specific features may describe such things as faces or fingerprints. From a retrieval standpoint, it is often better to combine multiple features to generate a more robust image description. Some common image features used in content-based image retrieval are described below.
2.2.2.1 Colour Features
Colour is perhaps the most widely used of all visual features in image retrieval. Most colour feature representations are relatively robust to image size and orientation. Colour is most often indexed in the RGB or HSV colour-spaces, however otherperceptual colour-spaces have also been suggested. Finlayson et al. (1998) discuss colour-normalisation techniques for indexing.
By far the most common colour descriptor (used both globally and locally) is the colour histogram first proposed for use in retrieval by Swain and Ballard (1991). Stricker and Orengo (1995) noted most colour histograms are sparse and sensitive to noise, and suggested using the cumulative colour histogram instead, which they showed to be insensitive to the quantisation parameter. Stricker and Orengo also proposed a second technique in which only the dominant features of the colour distribution were indexed, in the form ofcolour moments from the first three moments (mean, variance and skewness) of the colour histogram. Sebe et al. (2003) used local colour moment descriptors together with salient points for retrieval.
Smith and Chang (1995) proposed the Colour Set feature formed from a set of colours from a quantised colour-space. The Colour Set features were binary, and thus allowed a binary search tree to be constructed for fast search (Smith and Chang, 1996).
Pass et al. (1996) take a two stage approach to indexing in which the image is segmented by reducing the number of colours. Pixel values of segmented regions with large areas are then stored in acoherent vector, and those from small regions are stored in aincoherent vector. Results showed this approach worked better than the simple colour histogram.
2.2.2.2 Texture
studies. These Tamura textures are attractive for image retrieval because they are visu-ally meaningful. The Tamura textures were exploited in both the MARS (Huang et al., 1996) and QBIC (Niblack et al., 1993) retrieval systems. Howarth and R¨uger (2004) carried out a detailed evaluation of the use of textures in a query-by-example image retrieval task.
Textures have also been represented using the Wavelet transform (e.g. Smith and Chang, 1994; Laine and Fan, 1993). In particular, Ma and Manjunath (1995) showed that the Gabor Wavelet transform performed well in a texture annotation task.
2.2.2.3 Shape
Shape is important in some retrieval scenarios, such as trademark retrieval (Eakins et al., 1998). Eakins (1993) discusses some design requirements for a shape retrieval system. Shape-based retrieval does suffer from the drawback that it requires an initial segmentation to select the shapes from the image.
In general, shape descriptors can be separated into two categories; region-based and boundary-based. Perhaps the most successful region-based descriptors are moment in-variants introduced by Hu (1962). The characteristic boundary-based descriptor is the Fourier descriptor (Zahn and Roskies, 1972).
2.2.2.4 Robust Local Descriptors - SIFT
There are a large number of different types of feature descriptors that have been sug-gested for describing the local image content within a salient region; For example colour moments and Gabor texture descriptors (Sebe et al., 2003; Stricker and Orengo, 1995; Ma and Manjunath, 1995). However, many of these descriptors are not robust to poor imaging conditions. A study by Mikolajczyk and Schmid (2003) showed that the Scale Invariant Feature Transform (SIFT) descriptor, designed by Lowe (2004), was superior to other descriptors found in the literature, such as the response of steerable filters or orthogonal filters. The performance of the SIFT descriptor is enhanced because it was designed to be invariant to small shifts in the position of the sampling region, as might happen in the presence of imaging noise.
2.3
The Semantic Gap and Auto-Annotation
The hallmark of a good retrieval system is its ability to respond to a user’s queries and present results in a desired fashion. In the past there has been a tendency for research to focus on content-based retrieval techniques, ignoring the issues of users. In spite of this, some investigators have attempted to characterise image queries, providing insights in retrieval system design (Enser, 1995; Armitage and Enser, 1997; Ornager, 1997; Hollink et al., 2004) and highlighting the problem of what has become known as the semantic gap.
In the survey of content-based image retrieval by Smeulders et al. (2000), the semantic gap is described as;
...the lack of coincidence between the information that one can extract from the visual data and the interpretation that the same data have for a user in a given situation.
At the end of the survey the authors conclude that:
A critical point in the advancement of content-based retrieval is the semantic gap, where the meaning of an image is rarely self-evident. The aim of content-based retrieval systems must be to provide maximum support in bridging the semantic gap between the simplicity of available visual features and the richness of the user semantics.
Techniques for attempting to bridge the semantic gap in image retrieval have mostly used an auto-annotation approach, in which keyword annotations are applied to unlabelled images. Enser et al. (2005) discusses some short-comings of auto-annotation due to their lack ofrichness when compared to real image annotations in archival collections. Enser et al. (2005) goes on to suggest that perhaps a way forward is to combine shareable ontologies to make explicit the relationships between the keyword labels and concepts they represent (e.g. Addis et al., 2003; Goodall et al., 2004; Hu et al., 2003). Zhao and Grosky (2000) proposed an approach to bridging the semantic gap using Latent Semantic Indexing (see also Grosky and Zhao, 2001; Cascia et al., 1998) — an approach that is further explored in this thesis.
2.3.1 Auto-Annotation Techniques