A great deal of additional information on the European Union is available on the Internet. It can be accessed through the Europa server (http://europa.eu.int).
Europe Direct is a service to help you find answers to your questions about the European Union
New freephone number:
00 800 6 7 8 9 10 11
ISBN 92-894-9996-6
© European Communities, 2005
This publication was prepared under the responsibility of
Rainer Muthmann, Head of Unit E3 - Environment Statistics, Eurostat.
Publication editors:
Wim Kloek, Eurostat
Karin Jordan, Eurostat
Consultants:
Jürgen Gonser
Friedrich Heggemeier
National Statistical Institutes:
We would like to thank all the participants from the National Statistical Institutes that have contributed with information.
Further information:
Wim Kloek
Tel (352) 4301 - 34963
Fax (352) 4301 - 30039
E-mail [email protected]
Karin Jordan
Tel (352) 4301 - 32308
Fax (352) 4301 - 30039
E-mail [email protected]
The views expressed in this publication are those of the authors and do not necessarily reflect the opinion of the European Com-mission.
TABLE OF CONTENTS
INTRODUCTION
1
TOTAL WASTE GENERATED
2
INDUSTRIAL WASTE
6
Waste Generation by Economic Sectors 6
Manufacturing Industry 11
MUNICIPAL WASTE
14
Generation and Treatment in the European Union 14
Generation and Collection by Countries 16
Treatment and Disposal of Municipal Waste 20
HAZARDOUS WASTE
22
Generation of Hazardous Waste 22
Treatment and Disposal of Hazardous Waste 26
RECOVERY AND RECYCLING
27
Recycling and Recovery of Packaging Waste 27
Separate Collection of Waste Paper 29
ANNEX I — DEFINITIONS
33
Definitions of the Joint Questionnaire 33
Definitions of the Gross Value Added 35
ANNEX II — ABBREVIATIONS AND SYMBOLS
36
ANNEX III — STRUCTURAL INDICATORS ON MUNICIPAL WASTE
37
ANNEX IV — RAW DATA FROM OECD/EUROSTAT JOINT QUESTIONAIRE
43
Figure 2-1 Origin of total waste generated by economic sectors and country for 2002 (%) ...3
Figure 2-2 Origin of total waste generated by economic sectors and country for 2002 (tonnes/person) ...3
Figure 3-1 Waste generated by the mining and quarrying sector (10–14) by countries from 1999 to 2002 (tonnes/1000 EUR GVA) ...7
Figure 3-2 Waste generated by the mining and quarrying sector (10–14) by countries from 1999 to 2002 (tonnes/person) ...7
Figure 3-3 Waste generated by the manufacturing industry (15–37) by countries from 1999 to 2002 (tonnes/1000 EUR GVA) ...8
Figure 3-4 Waste generated by the manufacturing industry (15–37) by countries from 1999 to 2002 (tonnes/person) ...8
Figure 3-5 Waste generated by the sectors energy production (40) and water supply (41) by countries from 1999 to 2002 (tonnes/EUR GVA) ...9
Figure 3-6 Waste generated by the sectors energy production (40) and water supply (41) by countries from 1999 to 2002 (tonnes/person) ...9
Figure 3-7 Waste generated by the construction industry (45) by countries from 1999 to 2002 (tonnes/1000 EUR GVA) ...10
Figure 3-8 Waste generated by the construction industry (45) by countries from 1999 to 2002 (tonnes/person) ...10
Figure 3-9 Waste generated by the manufacturing industry (15-37) by countries and sub-sectors for 2002 (%) ...12
Figure 3-10 Waste generated by the manufacturing industry (15-37) by countries and sub-sectors for 2002 (tonnes/person) ...12
Figure 3-11 Recovery and disposal of non-hazardous waste from the manufacturing industry (15-37) by countries for 2002 (%) ...13
Figure 3-12 Recovery and disposal of non-hazardous waste from the manufacturing industry (15-37) by countries for 2002 (tonnes/person) ...13
Figure 4-1 Generation and treatment of municipal waste in EU 25 from 1995 to 2003 (Million tonnes) ...14
Figure 4-2 Generation of municipal waste in the European Union from 1995 to 2003 (kg/person) ...15
Figure 4-3 Treatment and disposal of municipal waste in the European Union from 1995 to 2003 (kg/person)...15
Figure 4-4 Municipal waste generation by countries and the European Union for 1995 and 2003 (kg/person)...16
Figure 4-5 Municipal waste collected by origin and by countries for 2002 (%) ...17
Figure 4-6 Municipal waste collected by origin and by countries for 2002 (kg/person)...17
Figure 4-7 Municipal waste collected by type of collection and by countries for 2002 (%)...18
Figure 4-8 Separate collection of municipal waste by materials and countries for 2002 (%)...19
Figure 4-9 Separate collection of municipal waste by materials and countries for 2002 (kg/person) ...19
Figure 4-10 Recovery and disposal of municipal waste by countries for 2002 (%)...20
Figure 4-11 Recovery and disposal of municipal waste by countries for 2002 (kg/person) ...21
Figure 5-1 Generation of hazardous waste in the European Union from 1998 to 2002 (Million tonnes)....23
Figure 5-2 Generation of hazardous waste in the European Union from 1998 to 2002 (kg/1000 EUR GVA)...23
Figure 5-3 Generation of hazardous waste by countries from 1999 to 2002 (kg/1000 EUR GVA) ...24
Figure 5-4 Generation of hazardous waste by countries from 1999 to 2002 (kg/person) ...24
Figure 5-5 Origin of hazardous waste by economic sectors and countries for 2002 (%)...25
Figure 5-6 Origin of hazardous waste by economic sectors and countries for 2002 (kg/person) ...25
Figure 5-7 Recovery and disposal of hazardous waste by countries for 2002 (%)...26
Figure 6-1 Generation and treatment of packaging waste in the EU 15 from 1997 to 2001 (Million tonnes, kg/person)...27
Figure 6-2 Recycling rates for packaging waste by countries and EU 15 from 1997 to 2001 (%) ...28
Figure 6-3 Recovery rates for packaging waste by countries and EU 15 from 1997 to 2001 (%)...28
Figure 6-4 Development of waste paper generation and collection for recycling in EU 15 (without Luxembourg) from 1990 to 2002 (Million tonnes) ...29
LIST OF TABLES
Table 2.1 Total Waste generated in the EU 2002 ...4
Table A3.1 Structural indicator on municipal waste generated (kg/person) ...37
Table A3.2 Municipal Waste generated (1000t) ...38
Table A3.3 Structural indicator on municipal waste landfilled (kg/person)...39
Table A3.4 Municipal Waste landfilled (1000t) ...40
Table A3.5 Structural indicator on municipal waste incinerated (kg/person)...41
Table A3.6 Municipal Waste incinerated (1000t) ...42
Table A4.1 Waste generated (1000 t) ...44
Table A4.2 Waste generated by sectors (1000 t) ...46
Table A4.3 Waste generated in the manufacturing industry by sub-sectors (1000 t) ...56
Table A4.4 Hazardous waste generated (1000 t)...62
Table A4.5 Hazardous waste generated by sectors (1000 t)...64
Table A4.6 Generation of waste by selected waste streams (1000 t) ...70
Table A4.7 Municipal waste generated and collected (1000 t)...78
Table A4.8 Composition of municipal waste (1000 t) ...88
Table A4.9 Treatment and disposal of waste 2002 (1000 t)...96
Table A4.10 Treatment and disposal of non-hazardous waste from the manufacturing industry (1000 t) ....98
Table A4.11 Treatment and disposal of hazardous waste (1000 t)...102
Table A4.12 Treatment and disposal of municipal waste (1000 t)...110
Table A4.13 Incineration plants and landfill sites for hazardous and non-hazardous waste ...116
Table A5.1 Population (1000 Persons)...118
Table A5.2 Waste generated by sectors (kg/1000 EUR value added)...119
Table A5.3 Waste generated in the manufacturing industry by sub-sectors (kg/1000 EUR value added)...122
Table A5.4 Hazardous waste generated by sectors (kg/1000 EUR value added) ...126
1 Introduction
International waste statistics are collected through a question-naire developed jointly by Eurostat and the OECD which is briefly referred to as Eurostat/OECD Joint Questionnaire (JQ). The questionnaire is sent to the participating countries every second (even) year and collects annual data on waste genera-tion, waste treatment and the waste management infrastruc-ture. The JQ has so far been the only standardised source for international waste data. The JQ data build the basis for the indi-cator set on municipal waste that is part of the set of Structural Indicators designed to measure the success or failure of EU pol-icies and published every year.
Starting with 2004 as first reference year, the Waste Statistics Regulation(1) will replace the Joint Questionnaire as main data source for the EU. The Waste Statistics Regulation requires the EU Member States to report data on waste generation, waste treatment and waste treatment infrastructure for every even year. The Regulation is expected to improve data availability as well as quality and comparability of data considerably. The pub-lication of first results on the basis of the Waste Statistics Regu-lation can be expected by the beginning of 2007.
This issue is the third publication of Eurostat on the generation and treatment of waste in Europe. The time series in the text generally cover the period 1995 to 2003. For the detailed break-downs the year 2002 was selected because data for this year is both recent and fairly complete. Other data sources have been used only for the recycling of specific waste streams in chapter 6.
Although the availability and the quality of data improves from year to year it is still difficult to draw a complete and reliable picture of waste generation and treatment in Europe. Compara-bility of data has certainly benefited from the introduction of the European List of Wastes(2) (LoW) which has to be applied by EU Member States for administrative purposes since the beginning of 2002. The List of Waste has replaced the European Waste Catalogue(3). Although the European List of Wastes is not oblig-atory for the compilation of statistics most countries actually use it for statistics as well. The majority of countries use the Euro-pean classification already since several years. Some countries, however, adhered to their national catalogues until 2001. Since 2002 all countries have to use the List of Waste or, at least, have to ensure that the national catalogues still in use are compatible.
Whereas comparability of actual data has increased through the introduction of a European waste classification the repeated changes of classifications in recent years reduce the expressive-ness of time series. It is often difficult to distinguish between the influence of waste classifications and real developments.
Structure and principles of the publication
The raw data provided by the countries with the Joint Question-naire 2004 are shown in Annex 4, Tables 1 to 12(4), to this pub-lication. Eurostat did not carry out any estimations of missing
data at national level. Only the footnotes were edited in order to reduce their number and to enhance their clarity. As regards the terminology the publication refers to the definitions of the Joint Questionnaire, the most important of which are displayed in Annex 1.
Chapter 2 of the publication presents the available data on total waste generation and origin of waste by economic sectors. Esti-mates were carried out in order to produce aggregated data on the European level. Aggregates were built for the entire EU (EU 25), for the ‘old’ Member States (EU 15) and for the 10 new Member States (NMS 10) that entered the European Union on 1 May 2004. The estimation was performed based on suitable indicators in order to gain a comparable data basis. For this purpose the waste amounts by economic sectors were related to the sectorial Gross Value Added (GVA). Annex 5 contains all cal-culated indicators that were used as basis for estimations. The GVA data were downloaded from the NewCronos data server(4). A definition of the Gross Value Added is provided in Annex 1.
Chapter 3 provides a country comparison of industrial waste generation by economic sectors. To enable comparison waste generation is presented in relation to the country population (kg/person) and to the sectorial GVA (kg/1 000 EUR GVA). More detailed information is provided on the generation and treat-ment of waste from the manufacturing industry. The population data were downloaded from the NewCronos data server(4) and are included in Annex 5 of the publication.
Chapter 4 gives an overview of the generation, collection and treatment of municipal waste. The complete set of the Struc-tural Indicators on municipal waste referred to in Chapter 4 is included in Annex 3 of the publication. Chapter 5 highlights the generation and treatment of hazardous waste. Finally, chapter 6 focuses on the recycling of packaging waste and waste paper.
The graphs shown in chapters 2 to 5 include all countries whether or not they did provide suitable data on the subject. On the one hand, this shall illustrate the data availability. On the other hand, the use of the same format and country order in all graphs shall improve the clarity and readability of the figures. In all graphs, the countries are grouped by EU 15, NMS 10, Candi-date Countries and EFTA countries in order to visualise structural differences between those country groups.
The abbreviations used in the publication are explained in Annex 2 which contains also a list of the countries covered by the publication together with the two-digit country codes.
(1) Regulation (EC) No 2150/2002 of the European Parliament and of the Council of 25 November 2002 on waste statistics (OJ L 332, 09.12.2002, p.1), last amended by Regulation (EC) No 782/2005 (OJ L 131, 25.05.2005, p.26)
(2) Commission Decision 2000/532/EC of 3 May 2000 replacing Decision 94/3/EC establishing a List of Wastes (OJ L 226, 06.09.2000, p.3), last amended by Decision 2001/ 573/EC (OJ L 203, 28.07.2001, p.18)
Total Waste Generated
2 Total Waste Generated
The aim of this section is to provide an overview of the amount of total waste generated in Europe. The amounts of total waste originate from production, represented by sectors of economic activity, and from consumption, represented by municipal waste. Municipal waste mainly consists of waste collected from households, but also includes waste generated by economic activities and collected together with waste from households (e.g. commerce and trade, small businesses, office buildings, institutions).
The Joint Questionnaire asks for the total waste generated, including hazardous and non-hazardous waste, and for the breakdown by the main economic sectors. The economic sectors are classified according to the major sections of the Statistical Classification of Economic Activities in the European Commu-nity (NACE-Rev.1.1) as follows:
The category ‘other sectors’ includes fishery, the wholesale and retail trade, hotels and restaurants, the transport and communi-cation sector, financial institutions, public administration, com-munity services, and similar activities.
The figures 2-1 and 2-2 show the origin of total waste gener-ated in the year 2002 in percentages and kg/person for all coun-tries. The two diagrams include all 18 countries which reported a value for the total waste generated. Where the sum of the sectors fell below the value of the generated total, the differ-ence was assigned to ‘other economic sectors’. In addition, the figures show three countries (Spain, the Netherlands, Lithua-nia(1) that reported no generated waste total but provided data on municipal waste and on at least three economic sectors. For
these countries, the bars only represent the sum of the available sectors plus municipal waste.
The underlying raw data of the countries are available in Table 1 and Table 2 of Annex 4. The gaps in the figures illustrate that not all countries provided the required data. Whether or not the countries were able to report the generated total and the break-down by sources depends on the coverage, the methodological approach and the frequency of their national waste surveys. The main reasons for data gaps can be summarised as follows: • Some countries cover with their surveys only a part of the
economic sectors and are thus not able to report a gener-ated total.
• Some countries cover all types of waste but are not able for methodological reasons to specify the economic sector of origin. They can report a waste total but without break-down by sectors.
• Some countries have two or three-yearly survey frequencies or no regular data collection at all and may not have sub-mitted data for the year displayed in the graphs.
• A fourth possible reason for data gaps is the lack of timeli-ness of results.
These problems hamper data evaluation and have to be kept in mind when interpreting figures 2-1 and 2-2. The two diagrams include all countries which reported at least on three economic sectors. Where the sum of the sectors fell below the value of the total waste generated, the difference was assigned to ‘other economic sectors’. If a figure for total waste generated was not available (Spain, the Netherlands and Lithuania), the bars only represent the sum of the available sectors plus municipal waste. Detailed information on the availability of data by countries can be retrieved from the raw data shown in Table 2 of Annex 4. The figures show that data availability is higher in the new Member States than in EU 15 countries. The figures contain data from 8 of the 15 old Member States. The other 7 countries did not submit data for 2002 or reported only on one or two economic sectors for the reasons mentioned above. In contrast, data are available from 8 of the 10 new Members and from 3 of the 4 Candidate Countries.
Most of the countries provided data on the manufacturing industry (15-37) and on the aggregate of energy production (40) and water purification & distribution (41). In a majority of those countries, these two positions together with the municipal waste represent more than half of the total waste generated. The proportions of the sectors agriculture and forestry (01-02) and mining and quarrying (10-14) show the highest variation Main findings:
• Waste generation in EU 25 is estimated for 2002 at about 1.3 billion tonnes. This figure includes waste from the manufac-turing industry (427 million tonnes), from energy production and water supply (127 million tonnes), from the construction sector (510 million tonnes), and municipal waste (241 million tonnes).
• The estimated amount excludes waste from agriculture, forestry and fishery (01, 02, 05), from mining and quarrying (10-14), and from the service and public sector (50-93). For these sectors a valid estimate is currently not possible.
Sector NACE Rev1.1 Division Code
Agriculture and forestry 01 – 02
Mining and quarrying 10 – 14
Manufacturing industry 15 – 37
Energy production & Water
purification and distribution(a)
(a) Note that waste generation by the sectors energy production (NACE di-vision 40) and water purification and distribution (41) is addressed sepa-rately in the Joint Questionnaire. However, for the purposes of the publication the two divisions were aggregated because the data on the Gross Value Added were not available separately for the two sectors
40 - 41
Construction 45
Other sectors 05, 50-93
among the countries. Particularly in those countries with very high overall amounts per person (Finland, Sweden, Bulgaria and Romania), one of these two sectors dominates the overall value. For some countries the proportion of municipal waste appears to be over represented. This is most likely due to aspects of cov-erage and to problems with the assignment of waste to the gen-erating sources. In the case of Latvia, for instance, the figure on municipal waste includes also non-hazardous wastes from industry, and in Iceland more than half of the municipal waste
originates from commerce and trade, small businesses, office buildings etc.
Legend of Figure 2-1 and of Figure 2-2:
Figure 2-1 Origin of total waste generated by economic sectors and country for 2002 (%)
Figure 2-2 Origin of total waste generated by economic sectors and country for 2002 (tonnes/person)
Other economic sectors - incl. non spec. Agriculture and forestry (01-02) Mining and quarrying (10-14) Construction (45)
Energy Production (40) and Water Purification & Distribution (41) Manufacturing industry (15-37)
Municipal waste 0% 10% 20% 30% 40% 50% 60% 70% 80% 90% 100% Be lgiu m De nm ark Ge rm
any Gre ece Sp ain Fra nce Irela
nd Italy
Luxe mb
ou rg
Ne the
rlan ds
Au stri
a
Po rtug
al
Fin lan
d
Sw ede
n
Un ited
Kin gdo
m
Cze ch
Re pub
lic
Est onia
Cyp rus
Latv ia
Lith uan
ia
Hu nga
ry Ma lta Po lan d Slo ven ia Slo vaki a Bu lga ria Cro atia Ro ma nia Turk
ey Ice lan d No rwa y Sw itze
rlan d 17,5 0 1 2 3 4 5 6 7 8 9 10 11 12 13 Be lgiu m De nm ark Ge rm
any Gre ece Sp ain Fra nce Ire lan d
Italy
Luxe mb
ourg
Ne the
rla nds
Au stri
a
Po rtu
gal Fin
lan d
Sw ede
n
Un ited
Kin gdo
m
Cze ch
Re pub
lic
Est onia
Cyp rus
Latv ia
Lith ua
nia
Hu nga
ry Ma lta Po lan d Slo ven ia Slo vaki a Bu lga ria Cro atia Ro ma nia Tu rke y Ice lan d No rwa y Sw itze
rlan d
tonnes /
Total Waste Generated
In order to provide aggregates on the European level, the lack of data on sectoral waste generation made it necessary to close data gaps by estimates. For this purpose the indicator ‘waste generated per GVA’ was used. This approach is based on the assumption that economic growth within an economic sector will result in an increase (or decrease) of waste generation according to a sector-specific ratio.(1)
The analysis of available data showed that valid estimates on the generated totals for EU aggregates were only possible for the three economic sectors manufacturing industry (15-37), energy production / water supply (40-41) and construction (45). The estimated totals for EU 25, EU 15 and NMS 10 in 2002 are shown in Table 2.1.
For the sectors agriculture and forestry (01-02), mining and quarrying (10-14) and the ‘other sectors’ the data basis was too weak to estimate EU totals. Hence, the respective figures in Table 2.1 represent only the sum of the available raw data and do not cover all countries.
Furthermore, an estimation was carried out for hazardous waste generation. This estimate was based on the hazardous waste total reported by the countries, and includes hazardous waste from all economic sectors and hazardous municipal waste. Data gaps were closed using the indicator ‘hazardous waste total/ 1 000 EUR GVA’.
Table 2.1 Total waste generated in the EU 2002
s: Eurostat estimate of the generated totals ; covers all countries of the respective EU aggregate
Table 2.1 presents the estimated EU totals by sectors (marked with ‘s’ for Eurostat estimate) and the sum of the available data for those sectors for which estimates were not possible. Results are given in 1 000 tonnes, in kg/person and in kg/1 000 EUR GVA.
For EU 25 the waste total generated by the manufacturing industry in 2002 is estimated at 427 million tonnes (944 kg/per-son). The waste arising related to population is similar in EU 15 and NMS 10 countries and amounted to 922 kg/person and 1 054 kg/person respectively. In relation to the Gross Value Added waste generation is more than four times higher in NMS 10 than in EU 15.
Energy production and water supply accounted in 2002 for about 127 million tonnes (281 kg/person) of waste in EU 25. Waste generation per person and per valued added was clearly higher in the NMS 10 than in the EU 15 countries. In the new Member States generation amounts to 502 kg/person com-pared to 237 kg/person in EU 15.
About 510 million tonnes of waste (1 126 kg/person) were gen-erated by the construction sector. With regard to construction waste the data indicate a significant difference between old and new Member States. Measured as waste per GVA the EU 15 generate double the amount of the NMS 10 countries. Expressed as waste per person the arising in EU 15 (1 321 kg/ person) is about ten times higher than that of the new Member States (135 kg/person). The big discrepancy not only reflects real differences in construction activites, but also differences in cov-erage of contruction waste streams between old and new Member States.
Together with the municipal waste the EU waste arising in 2002 amounted to 1.3 billion tonnes, not including waste from agri-culture and forestry, mining and quarrying and ‘other sectors’. Of this amount, 1.16 billion tonnes were generated by EU 15 countries and 150 million tonnes by the new Member States. The generated total including the agricultural and the mining sector would certainly be considerably higher. A valid estimate
(1) With the given data on waste generation and the sectoral value added growth at constant prices (as available in NewCronos database) the indicator ‘waste per Gross Value Added (GVA)’ was calculated for every economic sector, country and year. For the years with lacking data the indicator was estimated by linear best fit on the basis of indicators from previous and/or following years. Estimators for waste generation then were calculated according to the equation: ‘waste generated = indicator * sectoral value added’. Where this approach was not feasible because none of the required data were available, average data from comparable countries were used to fill in data gaps. These estimations have been used only for the assessment of aggregates in Table 2.1. No estimates for a specific country or sector are presented in this report. The calculated indicators are shown Tables 2 to 4 in Annex 5
1 2 3 4 5 6 7 8 9
Waste total (hazardous and non-hazardous waste) by sectors
Level
Agriculture and forestry (01-02)a)
Mining and quarrying
(10-14)a)
Manu-facturing
industry (15-37)
Energy Prod. (40), Water Purification &
Distribution (41)
Construction
(45) Other(a)
(a) Sum of available data, i.e. based on a limited number of countries (EU 25: NACE 01-02: 6 countries; NACE 10-14: 13; Other: 15) Municipal
waste
Sum of columns 3, 4,
5 and 7(b)
(b) Sum of estimated aggregates, including NACE divisions 15-37, 40, 41, 45 and municipal waste; excluding NACE divisions 01-02, 05, 10-14, 50-93
Hazardous waste total(c)
(c) Covers hazardous waste from all economic sectors plus hazardous municipal waste. On account of the wider coverage the hazardous waste total is no subset of the sum in column 8
1 000 t
EU 15 23 000 258 106 348 796 s 89 760 s 499 947 s 9 535 217 164 s 1 155 666 46 748 s
NMS 10 5 935 42 646 78 695 s 37 516 s 10 058 s 7 794 23 586 s 149 856 11 603 s
EU 25 28 935 300 753 427 491 s 127 276 s 510 005 s 17 329 240 750 s 1 305 522 58 351 s
kg/person
EU 15 61 682 922 s 237 s 1 321 s 25 574 s 3 054 124 s
NMS 10 79 571 1 054 s 502 s 135 s 104 316 s 2 007 155 s
EU 25 64 664 944 s 281 s 1 126 s 38 531 s 2 882 129 s
kg/1 000 EUR value added (at current prices)
EU 15 141 3 533 221 s 547 s 1 062 s 1 440 - - 6 s
NMS 10 432 12 606 952 s 2 642 s 411 s 52 699 - - 29 s
for these sectors, however, is not possible on the basis of the available data.
The total of hazardous waste generated in 2002 is estimated at 58.4 million tonnes (129 kg/person) for EU 25, of which 46.7
Industrial Waste
3 Industrial Waste
3.1 Waste Generation by Economic
Sectors
The following figures present the waste generation for the main economic sectors on country level. The amounts represent the generated total of the sectors including hazardous and non-haz-ardous waste. The raw data for the graphs submitted by the countries in the Joint Questionnaire are included in Table 2 of Annex 4.
To enable comparison between the countries the generated quantities are standardised by division through a) the Gross Value Added of the respective economic sectors and b) the number of inhabitants of the respective country. The figures cover the period from 1999 to 2002 in order to increase the availability of data and to visualise trends in waste generation. Furthermore, the deviations between different years for individ-ual countries indicate to a certain degree the stability and the reliability of data.
As outlined earlier, not all countries are able to break down their total waste generation by economic sectors as required by the Joint Questionnaire. Nevertheless, all countries were included in the figures in order to illustrate the availability of data. Thus, the graphs provide an impression of the data basis for the estima-tions made to yield the estimated aggregates shown in Table 2.1 in the previous chapter. In general, the figures on waste gener-ation per Gross Value Added show more gaps than those with amounts per person as in some cases no sector-specific GVA-data were available.
The presentations are limited to the sectors mining/quarrying, manufacturing industry, energy production/water supply, and construction. A country comparison for waste from agriculture and forestry was omitted due to the poor data availability. Country comparisons on municipal waste are provided in Chapter 4.
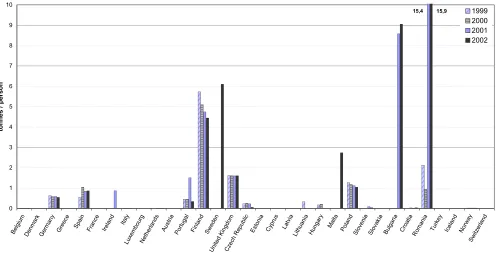
Figures 3-1 and 3-2 show the waste amounts generated by mining and quarrying activities. It is obvious form the graphs that data availability for the mining sector is poor. The reported amounts vary extremely between the countries in both presen-tations. The reasons for the variation are manifold. The waste arising depends primarily on the economic importance of the
mining and quarrying sector in the country, but also on the type of the extracted minerals and on the technology used. However, the variation may also result from differences in definitions and survey methodology which can have a strong impact on the reported amounts.
Figure 3-2 shows that in 2002 the waste arising per person was highest in Romania, Bulgaria, Finland and Sweden with values ranging from 4 450 kg/person up to nearly 16 000 kg/person. In these four countries mining and quarrying is the main waste generating sector (see also figure 2-1). Most of the other coun-tries generated less than 1 600 kg/person in 2002. As shown in Table 2.1, the average generation for EU 25 on the basis of available data amounted to 664 kg/person (NMS 10: 571 kg/ person; EU 15: 682 kg/person).
Figure 3-1 gives a similar picture for the GVA-related amounts. As pointed out in chapter 2 the available data are too poor to give an estimate on the EU generation total.
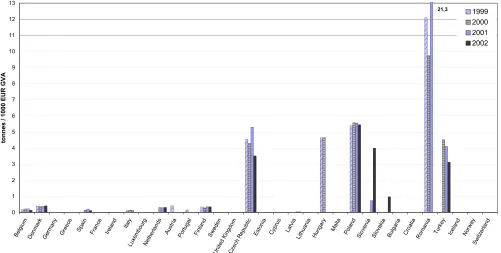
The figures 3-3 and 3-4 display the waste amounts generated by the manufacturing industries by country. The two graphs show different characteristics. Figure 3-3 indicates that waste genera-tion per valued added is generally higher in the New Member States and the Candidate Countries. The highest values in 2002 are reported by Romania, Poland and the Slovak Republic (> 1 500 kg/1 000 EUR GVA). In EU 15 all countries fell below 500 kg/1 000 EUR GVA in 2002. For some countries like Fin-land, the Czech Republic, and Poland the figures per GVA indi-cate a steady decline of waste generation in comparison to the production output.
The figures on waste per person show no general differences between old and new Members. The highest waste arising is reported by Finland and Sweden with values over 2 000 kg/ person in 2002. The high amounts result form the strong wood, pulp and paper industry in these two countries. Most other countries generated between 300 and 1 500 kg/person. The EU 25 average amounted to 944 kg/person with an arising of 1 054 kg/person in the new Member States generating and 922 kg/person in EU 15.
The breakdown of waste generation by sub-sectors and the treatment of the non-hazardous waste from the manufacturing industry is discussed in more detail in section 3.2.
Main findings:
• Data on industrial waste are most solid for the manufacturing industry. Waste generation in 2002 ranged in most countries between 300 and 1 500 kg/person (EU 25: 944 kg/person), and was highest in Finland and Sweden with values over 2 000 kg/person.
• Main waste generating sub-sectors within the manufacturing industry are the manufacture of basic metal products (NACE 27), of food, beverages, tobacco (15-16), of non-metallic mineral products (26) and of wood and wood products (20).
• Waste generation by the sector energy production / water supply is higher in the new Member States and Candidate Coun-tries than in the old Member States. For 2002, EU 15 counCoun-tries report amounts of up to 300 kg/person whereas in NMS 10 and Candidate Countries the sector accounted for up to 900 kg/person.
Figure 3-1 Waste generated by the mining and quarrying sector (10–14) by countries from 1999 to 2002 (tonnes/1000 EUR GVA)
Figure 3-2 Waste generated by the mining and quarrying sector (10–14) by countries from 1999 to 2002 (tonnes/person) 645 0 10 20 30 40 50 60 70 80 90 100 110 120 Be lgiu m De nm ark Ge rm
any Gre ece Sp ain Fra nce Irela
nd Italy
Luxe mb
ou rg
Ne the
rlan ds
Au stri
a
Po rtug
al
Fin lan
d
Sw ede
n
Un ited
Kin gdo
m
Cze ch
Re pub
lic
Est onia
Cyp rus
Latv ia
Lith uan
ia
Hu nga
ry Ma lta Po lan d Slo ven ia Slo vaki a Bu lga ria Cro atia Ro ma nia Turk
ey Ice lan d No rwa y Sw itze
rlan d
tonnes /
1000 EUR G
V A 1999 2000 2001 2002 15,4 15,9 0 1 2 3 4 5 6 7 8 9 10 Be lgiu m De nm ark Ge rm
any Gre ece Sp ain Fra nce Ire lan d Ita ly Lu xem bo urg Ne the rla nds
Au stri a Po rtu ga l Fin lan d Sw ed en Un ited Kin gdo
m Cze ch Re pu blic Est
onia Cyp
rus Latv
[image:13.595.53.553.387.640.2]Industrial Waste
Figure 3-3 Waste generated by the manufacturing industry (15–37) by countries from 1999 to 2002 (tonnes/1000 EUR GVA)
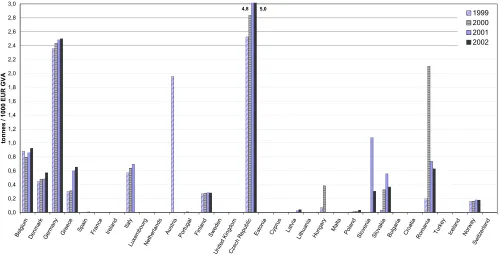
Figure 3-4 Waste generated by the manufacturing industry (15–37) by countries from 1999 to 2002 (tonnes/person) Waste generation by energy production and water supply is
shown in figures 3-5 and 3-6. The two sectors are presented together as data on the Gross Value Added are not available separately for both sectors. In general, the waste quantities of both sectors are clearly dominated by energy production waste. Waste from water supply accounts on average for about 10 % of the amount generated by energy production. Both graphs indicate a clearly higher relative waste generation in new Member States and Candidate Countries than in EU 15. Proba-ble reasons are the type of energy sources used and the effi-ciency of energy production.
Waste generation per value added is quite homogenous in the old Member States for which data are available, ranging between 132 and 426 kg/1 000 EUR GVA. Generated amounts and variation of data are considerably higher in the new Member States and in the Candidate Countries. The Czech Republic, Hungary, Poland, Slovenia and Turkey report amounts between 3 000 and 6 000 kg/1 000 EUR GVA. Extremely high amounts of about 21 000 kg/1 000 EUR are reported by Roma-nia. 0,0 0,5 1,0 1,5 2,0 2,5 Be lgiu m De nm ark Ge rm
any Gre ece Sp ain Fra nce Irela
nd Italy
Luxe mb
ourg
Ne the
rlan ds
Au stri
a
Port uga
l
Fin lan
d
Sw ede
n
Un ited
Kin gdo
m
Cze ch
Re pub
lic
Est onia
Cyp rus
Latv ia
Lith uan
ia
Hu nga
ry Ma
lta Pola
nd Slo ven ia Slo vaki a Bu lga ria Cro atia Ro ma nia Turk
ey Ice lan d No rwa y Sw itze
rlan d
tonnes / 1000 E
UR GV A 1999 2000 2001 2002 0,0 0,3 0,6 0,9 1,2 1,5 1,8 2,1 2,4 2,7 3,0 3,3 Be lgiu m De nm ark Ge rm
any Gre ece Sp ain Fra nce Irela
nd Italy
Luxe mb
ou rg
Ne the
rlan ds
Au stri
a
Po rtug
al
Fin lan
d
Sw ede
n
Un ited
Kin gdo
m
Cze ch
Re pub
lic
Est onia
Cyp rus
Latv ia
Lith uan
ia
Hu nga
ry Ma lta Po lan d Slo ven ia Slo vaki a Bu lga ria Cro atia Ro ma nia Turk
ey Ice lan d No rwa y Sw itze
The picture of waste generation per person is similar. Waste arising in the old Member States ranges between 36 kg/persons and 300 kg/person. Amounts are higher in most new Member States and Candidate Countries with values up to 900 kg/
person in 2002 in Slovenia. Averages for 2002 are 281 kg/ person for the EU 25, 502 kg/person for the new Member States and 237 kg/person for the EU 15.
[image:15.595.50.551.139.392.2]Figure 3-5 Waste generated by the sectors energy production (40) and water supply (41) by countries from 1999 to 2002 (tonnes/EUR GVA)
Figure 3-6 Waste generated by the sectors energy production (40) and water supply (41) by countries from 1999 to 2002 (tonnes/person) The data on waste generated by the construction sector are
dis-played in figures 3-7 and 3-8. The figures show a broad variation that makes it difficult to draw general conclusions. It has to be considered that data on waste from the construction sector are sensitive to issues of waste definitions, survey coverage and
the countries covers, for instance, non-contaminated excavated soil, or demolition waste that is reused at the construction site may influence the reported figures considerably. Finland, for example, explicitly notes that their data on construction waste exclude 30.5 million tonnes of surplus soil and stones. For
Fin-21,3 0 1 2 3 4 5 6 7 8 9 10 11 12 13 Be lgiu m De nm ark Ge rm
any Gre ece Sp ain Fra nce Irela
nd Italy
Luxe mb
ou rg
Ne the
rlan ds
Au stri
a
Po rtug
al
Fin lan
d
Sw ede
n
Un ited
Kin gdo
m
Cze ch
Re pub
lic
Est onia
Cyp rus
Latv ia
Lith uan
ia
Hu nga
ry Ma lta Po lan d Slo ven ia Slo vaki a Bu lga ria Cro atia Ro ma nia Turk
ey Ice lan d No rwa y Sw itze
rlan d
tonnes /
1000 EUR G
V A 1999 2000 2001 2002 2 0,0 0,1 0,2 0,3 0,4 0,5 0,6 0,7 0,8 0,9 1,0 Be lgiu m De nm ark Ge rm
any Gre ece Sp ain Fra nce Irela
nd Italy
Luxe mb
ou rg
Ne the
rlan ds
Au stri
a
Po rtug
al
Fin lan
d
Sw ede
n
Un ited
Kin gdo
m
Cze ch
Re pub
lic
Est onia
Cyp rus
Latv ia
Lith uan
ia
Hu nga
ry Ma lta Po lan d Slo ven ia Slo vaki a Bu lga ria Cro atia Ro ma nia Turk
ey Ice lan d No rwa y Sw itze
Industrial Waste
5 900 kg/person instead of the 273 kg/person displayed in figure 3-8.
The per person values in figure 3-8 indicate that waste genera-tion by the construcgenera-tion sector is considerably higher in EU 15 (1 321 kg/person) than in NMS 10 (135 kg/person) and the Can-didate Countries. The reported figures are highest in Germany and Austria (referring to the 1999 figure) with amounts of 3 000 kg/person and more. The other EU 15 countries report
[image:16.595.50.552.187.443.2]amounts between 270 kg/person (Finland) and about 1 000 kg/ person (Belgium) for 2002. For EU 15 the available figures indi-cate an increase of waste generation by the construction sector in most of the countries. The highest arising for NMS 10 is reported by the Czech Republic with about 700 kg/person. However, the data of the new Member States and the Candi-date Countries on construction waste are sketchy and make it difficult to draw general conclusions.
[image:16.595.52.550.484.735.2]Figure 3-7 Waste generated by the construction industry (45) by countries from 1999 to 2002 (tonnes/1000 EUR GVA)
Figure 3-8 Waste generated by the construction industry (45) by countries from 1999 to 2002 (tonnes/person) 4,8 5,0 0,0 0,2 0,4 0,6 0,8 1,0 1,2 1,4 1,6 1,8 2,0 2,2 2,4 2,6 2,8 3,0 Be lgiu m De nm ark Ge rm
any Gre ece Sp ain Fra nce Irela
nd Italy
Luxe mb
ou rg
Ne the
rlan ds
Au stri
a
Po rtug
al
Fin lan
d
Sw ede
n
Un ited
Kin gdo
m
Cze ch
Re pub
lic
Est onia
Cyp rus
Latv ia
Lith uan
ia
Hu nga
ry Ma lta Po lan d Slo ven ia Slo vaki a Bu lga ria Cro atia Ro ma nia Turk
ey Ice lan d No rwa y Sw itze
rlan d
tonnes /
1000 EUR G
V A 1999 2000 2001 2002 0,0 0,4 0,8 1,2 1,6 2,0 2,4 2,8 3,2 3,6 Be lgiu m De nm ark Ge rm
any Gre ece Sp ain Fra nce Irela
nd Italy
Luxe mb
ou rg
Ne the
rlan ds
Au stri
a
Po rtug
al
Fin lan
d
Sw ede
n
Un ited
Kin gdo
m
Cze ch
Re pub
lic
Est onia
Cyp rus
Latv ia
Lith uan
ia
Hu nga
ry Ma lta Po lan d Slo ven ia Slo vaki a Bu lga ria Cro atia Ro ma nia Turk
ey Ice lan d No rwa y Sw itze
3.2 Manufacturing Industry
3.2.1 Origin of Waste from the
Manufacturing Industry by
Sub-sectors
In addition to the waste generation on sector-level discussed so far, the JQ collects data on the manufacturing industry in more detail. This includes data on waste generation by manufacturing sub-sectors on the one hand, and data on recovery and disposal of the non-hazardous waste fraction on the other. The raw data on waste generation by sub-sectors are included in Table 3 of Annex 4, the data on the treatment of waste in Table 10 of Annex 4.
The analysis of data on the country level revealed, that data on waste generation by sub-sectors for the year 2002 related to GVA were only available for five countries. Thus, it was abstained from presenting these figures. However, a country comparison regarding the origin of waste from manufacturing industry is possible for 12 countries, which is presented in figure 3-9. The sub-sectors covered in the JQ again follow the structure of the NACE nomenclature as follows:
In figures 3-9 and 3-10 all countries with detailed data on sub-sectors were plotted, but only those sub-sub-sectors are shown in the figure with a share of more than 10 % of the total waste
generated in the manufacturing industry. Sub-sectors of a smaller share were included in the position ‘other manufactur-ing industries’. Where the sum of the sub-sectors fell below the section total, the difference was assigned to ‘other manufactur-ing industries’.
Figures 3-9 and 3-10 illustrate that the sub-sectors basic metal industries (NACE 27) and food, beverages, tobacco (15-16) are represented most often as significant sources of waste within the manufacturing industries of the various countries. Base metal industries contribute a particularly high share of waste in Poland, Romania and Bulgaria. The sub-sector food, beverages and tobacco is most important in Iceland (waste from fish processing and slaughterhouses) and in the Netherlands.
The sub-sectors non-metallic mineral products (26) and wood and wood products (20) are represented less often, but if so, they are one of the most important waste generating sub-sec-tors. The manufacture of non-metallic mineral products gener-ates a significant share of waste in Croatia, Spain and Portugal. High percentages of waste from the wood industry are reported by Latvia and Sweden. Sweden furthermore reports high amounts of waste from the pulp and paper industry. Wood, and pulp and paper industries are also the predominant waste pro-ducers within the manufacturing industry in Finland which is not included in the graphs as no data for 2002 are available.
3.2.2 Treatment and Disposal of
Non-hazardous Waste from the
Manufacturing Industry
Figure 3-11 and figure 3-12 show how non-hazardous waste from the manufacturing industry (15-37) is managed in the countries. Figure 3-11 illustrates the share of treatment opera-tions, whereas figure 3-12 gives the treated quantities per inhabitant. The presentations distinguish between landfilling, incineration, recycling and composting. Incineration encom-passes the incineration of waste with and without energy recov-ery. Recovery and disposal operations that were not specified in the Joint Questionnaires are summarised under the heading ‘other treatment’.
The graphs illustrate the variations of waste management sys-tems. The new EU Member States and the Candidate Countries still report higher landfill rates than most of the old Member States, for which data were available. The lowest landfill rates of about 10 % or less are reported by the Netherlands, Sweden and Switzerland. Particularly high recycling rates of over 60 % are achieved by the Netherlands, Denmark, and the Czech Republic.
Sub–Sector NACE Rev1.1 Division Code
Food, beverages, tobacco
industry 15 - 16
Textile industries 17 - 18
Leather industries 19
Wood and wood products 20
Paper and paper products 21
Printing and publishing 22
Refineries, etc 23
Chemical industries 24
Rubber and plastics 25
Non-metallic mineral products 26
Basic metal industries 27
Fabricated metal products, machinery, electrical, optical and transport equipment
28 - 35
Industrial Waste
[image:18.595.53.553.117.433.2]Legend of Figure 3-9 and of Figure 3-10:
Figure 3-9 Waste generated by the manufacturing industry (15-37) by countries and sub-sectors for 2002 (%)
Figure 3-10 Waste generated by the manufacturing industry (15-37) by countries and sub-sectors for 2002 (tonnes/person)
Other Manufacturing industries Paper and Paper Products (21)
Fabricated Metal Products, Machinery (28-35) Chemical industries (24)
Non-metallic Mineral Products (26) Wood and Wood Products (20) Food, Beverages, Tobacco (15-16) Basic Metal industries (27)
0% 10% 20% 30% 40% 50% 60% 70% 80% 90% 100% Be lgiu m De nm ark Ge rm
any Gre ece Sp ain Fra nce Ire lan d Ita ly
Luxe mb
ourg
Ne the
rla nds
Au stri
a
Po rtu
gal Fin lan d Sw ed en Un ited Kin gdo
m Cze ch Re pu blic Est on ia Cyp rus
Latv ia Lith ua nia Hu ng ary Ma lta Po lan d Slo ven ia Slo vaki a Bu lga ria Cro atia Ro ma nia Tu rke y Ice lan d No rwa y Sw itze rla nd 0,0 0,2 0,4 0,6 0,8 1,0 1,2 1,4 1,6 1,8 2,0 2,2 Be lgiu m De nm ark Ge rm
any Gre ece Sp ain Fra nce Irela
nd Italy
Luxe mb
ourg
Ne the
rla nds
Au stri
a
Po rtu
gal Fin
lan d
Sw ede
n
Un ited
Kin gdo
m
Cze ch
Re pub
lic Est on ia Cyp rus La tvia Lith ua nia Hu nga
ry Ma lta Po lan d Slo ven ia Slo vaki a Bu lga ria Cro atia Ro ma nia Turk
ey Ice lan d No rwa y Sw itze
rlan d
[image:18.595.51.554.485.735.2]Legend of Figure 3-11 and of Figure 3-12:
Figure 3-11 Recovery and disposal of non-hazardous waste from the manufacturing industry (15-37) by countries for 2002 (%)
Figure 3-12 Recovery and disposal of non-hazardous waste from the manufacturing industry (15-37) by countries for 2002 (tonnes/person)
Other treatment Composting Recycling
Incineration (with and without energy recovery) Landfilling 0% 10% 20% 30% 40% 50% 60% 70% 80% 90% 100% Be lgiu m De nm ark Ge rm
any Gre ece Sp ain Fra nce Ire lan d
Italy
Luxe mb ou rg Ne the rla nds
Au stri a Po rtu ga l Fin lan d Sw ede
n Un ited Kin gd om Cze ch Re pu blic Est on ia Cyp rus
Latv ia
Lith uan
ia Hu ng ary Ma lta Po lan d Slo ven ia Slo vaki a Bu lga ria Cro atia Ro ma nia Tu rke y Ice lan d No rwa y Sw itze
rlan d 0,0 0,3 0,5 0,8 1,0 1,3 1,5 1,8 2,0 2,3 2,5 Be lgiu m De nm ark Ge rm
any Gre ece Sp ain Fra nce Irela nd Italy
Lu xem
bou rg
Ne the
rla nds
Au stri
a
Po rtu
gal Fin
lan d
Sw ede
n Un ited Kin gd om Cze ch Re pu blic Es ton ia Cyp rus
Latv ia
Lith uan
ia Hu ng ary Ma lta Po lan d Slo ven ia Slo vaki a Bu lga ria Cro atia Ro ma nia Turk
ey Ice lan d No rwa y Sw itze
rlan d
[image:19.595.53.550.453.709.2]Municipal Waste
4 Municipal Waste
4.1 Generation and Treatment in the
European Union
The Eurostat/OECD Joint Questionnaire asks for the generation, treatment and disposal of municipal waste. As stated in the def-initions of the Joint Questionnaire, municipal waste includes household waste and similar waste from commerce and trade, small businesses, offices and institutions (mixed waste and sep-arately collected fractions). The definition also includes street sweeping, content of litter containers, market cleansing waste, yard and parks waste, and bulky waste (see Annex 1).
The JQ data on generation and treatment of municipal waste are used to calculate the indicator set on municipal waste. The municipal waste indicators are part of the Structural Indicators designed to measure the success or failure of EU policies on an annually basis. The set consists of the three indicators ‘municipal waste generated’, ‘municipal waste landfilled’ and ‘municipal
waste incinerated’ expressed as amount in kg per person and year. The municipal waste indicators for the years 1995 to 2003 build the basis for the overview of waste generation and treat-ment given in this section (4.1) and in section 4.2.1. The com-plete set of indicators is included in Annex 3 of this publication and can also be found on the Eurostat website. The more detailed presentations on municipal waste collection and treat-ment in the sections 4.2.2 and 4.3 are based on the JQ data shown in Annex 4, Table 7 (municipal waste generation and col-lection), Table 8 (composition of municipal waste) and Table 12 (treatment and disposal of municipal waste).(1)
[image:20.595.58.516.461.724.2]Figure 4-1 presents the development of municipal waste gener-ation and treatment for EU 25 from 1995 to 2003. The graph shows that municipal waste generation in this period has con-stantly been growing. The arising has increased by 39 million tonnes (19 %) from 204 million tonnes (457 kg/person) to 243 million tonnes (534 kg/person) which corresponds to an average yearly increase of about 2 %.
Figure 4-1 Generation and treatment of municipal waste in EU 25 from 1995 to 2003 (Million tonnes) Main findings:
• From 1995 to 2003 municipal waste generation in EU 25 has constantly grown by about 2 % per year from 204 million tonnes (457 kg/person) in 1995 to 243 million tonnes (534 kg/person) in 2003. Generation is higher in the old Member States with 574 kg/person compared to 312 kg/person in the new Member States.
• The landfilled total has decreased in the same period by about 10 % from 131.4 million tonnes in 1995 to 118.5 million tonnes in 2003 on account of increased incineration and recycling rates. In 2003, 48.8 % of the municipal waste generated was landfilled, 17.3 % were incinerated and 33.9 % were recycled or treated otherwise.
(1) As the municipal waste indicators are derived from the JQ data; the indicators are in principle identical with the corresponding raw data shown in Table 7 and Table 12 of Annex 4. However, some deviations occur since data validation for indicators and JQ data have been carried out at different times, and estimations were used to close data gaps in the indicator time series
0 25 50 75 100 125 150 175 200 225 250 275
1995 1996 1997 1998 1999 2000 2001 2002 2003
Million tonnes
Landfilling is still the main option for the disposal of municipal waste. In 2003, nearly half of the generated total (48.8 %) was landfilled. The landfilled totals, however, have shown a slight but constant decrease in recent years. The municipal waste land-filled has been reduced by 12.9 million tonnes (9.8 %) from 131.4 million tonnes in 1995 to 118.5 million tonnes in 2003. This is the result of increased separate collection and recycling, and of the steady rise of incineration (thermal treatment and energy recovery). Incineration has increased by 11.5 million tonnes or 38 % respectively in the reference period, and accounted in 2003 for 41.9 million tonnes (17 %) of the treated waste. Recycling and other treatment operations have risen by
40 million tonnes to 82.3 million tonnes and thus nearly doubled in the same time.
[image:21.595.69.510.222.483.2]The comparison of old and new Member States in figure 4-2 shows that the overall growth of municipal waste generation results from the development in the old EU Member States. Waste generation increased in EU 15 by 23 % from 482 kg/ person to 577 kg/person within the reference period. In con-trast, the data suggest a slightly decreasing trend in the new Member States since 1999. In 2003, generation amounted to 312 kg/person in NMS 10 as compared to 334 kg/person in 1995.
Figure 4-2 Generation of municipal waste in the European Union from 1995 to 2003 (kg/person) 300
350 400 450 500 550 600
1995 1996 1997 1998 1999 2000 2001 2002 2003
kg /
person
EU 15 NMS 10 EU 25
0 50 100 150 200 250 300 350
1995 1996 1997 1998 1999 2000 2001 2002 2003
kg / per
son
[image:21.595.60.514.278.768.2]Municipal Waste
Figure 4-3 shows the development of the structural indicators for landfilling and incineration in the European Union specified by old and new Member States. It illustrates that the per person amounts of municipal waste going to landfills are quite similar in NMS 10 and EU 15. Considerable differences exist with regard to waste incineration. Whereas in EU 15 more than 100 kg/person were incinerated in 2003 the respective amounts in the new Member States are still low ranging at about 12 kg/ person.
4.2 Generation and Collection by
Countries
[image:22.595.49.550.335.590.2]4.2.1 Generation by Countries
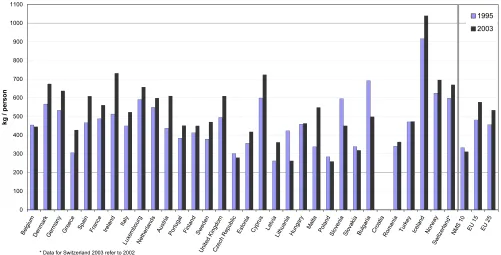
Figure 4-4 shows the indicators on municipal waste generated by countries for the year 2003. To indicate the development in recent years figure 4-4 compares the arisings in 1995 and 2003. The generated totals in 2003 vary considerably between coun-tries ranging from 260 kg/person in Poland to 1 040 kg/person
in Iceland. With the exception of Belgium, all EU 15 countries report considerable higher amounts for 2003 than for 1995. The same applies to the EFTA states Iceland, Norway and Switzer-land. In the new Member States and the Candidate Countries the development differs from country to country. Clear increases are reported by Malta, Latvia, Cyprus and Estonia. Most other countries report declines in municipal waste gener-ation that are highest in Bulgaria, Slovenia and Lithuania.
4.2.2 Origin of Municipal Waste and Type
of Collection
The Eurostat/OECD Joint Questionnaire asks for the amounts of generated and collected municipal waste. In countries where not the whole population is served by municipal waste collection systems the generated amounts will be higher than the collected ones. Hence, figures on municipal waste collected presented in the following may deviate from the generated amounts for indi-vidual countries and years. The raw data for this section are available in Table 7 of Annex 4.
Figure 4-4 Municipal waste generation by countries and the European Union for 1995 and 2003 (kg/person) The reported amounts for municipal waste generation and
col-lection depend on the colcol-lection systems established in the countries. Differences between individual countries exist in par-ticular with regard to the degree to which waste from com-merce, trade, shops and administration is covered by municipal waste collection and co-collected with waste from households. This is illustrated by figure 4-5 and figure 4-6. Both graphs show the amount of the collected municipal waste specified by origin, differentiating between waste from households, waste from commerce and trade, and waste from municipal services.
The share of waste from households ranges for most countries between 60 % and 90 % depending on the amount of other waste collected under the responsibility of the municipality. A few countries are above or below this range. In Iceland, for
example, municipal waste includes a high share of commercial waste which might explain the high municipal waste arising reported in figure 4-4.
The percentage of commercial waste in municipal waste ranges for most countries between 10 % and 35 %. In a few countries the share of commercial waste is as high or even higher than the waste from households (Estonia, Finland, Iceland). The share of waste from municipal services generally falls below 10 %.
However, when interpreting the data, it has to be considered that some countries are not able to determine exactly the share of waste from different sources that are collected by the same collection system. Hence, the figures give only a rough image of the situation.
0 100 200 300 400 500 600 700 800 900 1000 1100
Be lgiu
m
De nm
ark
Ge rm
any Gre
ece Sp
ain Fra
nce Ire
lan d
Ita ly
Luxe mb
ourg
Ne the
rlan ds
Au stri
a
Po rtu
gal Fin
lan d
Sw ed
en
Un ited
Kin gd
om
Cze ch
Re pu
blic Est
onia Cyp
rus Latv
ia
Lith uan
ia
Hu ng
ary Ma
lta Po
lan d
Slo ven
ia
Slo vaki
a
Bu lga
ria Cro
atia
Ro ma
nia Tu
rke y
Ice lan
d
No rwa
y
Sw itze
rla nd*
NM S1
0
EU 15
EU 25
kg /
person
1995 2003
Legend of Figure 4-5 and 4-6:
[image:23.595.53.552.445.695.2]Figure 4-5 Municipal waste collected by origin and by countries for 2002 (%)
Figure 4-6 Municipal waste collected by origin and by countries for 2002 (kg/person) Another view on municipal waste collection is presented in
figure 4-7 which shows the collected amounts by type of collec-tion, distinguishing between traditional collection (door-to-door collection of mixed household or similar waste in bags or bins),
and special wastes (e.g. refrigerators). The figures reflect the organisation of municipal waste collection and the stage of development of separate collection.
The share of separate collection varies considerably between
Not specified
From street and market cleaning, yards, litter containers, etc
From commerce and trade, small businesses, office buildings, institutions From households 0% 10% 20% 30% 40% 50% 60% 70% 80% 90% 100% Be lgiu m De nm ark Ge rma ny Gre ece Sp ain Fra nce Ire lan d Italy
Lu xem bo urg Ne the
rlan ds
Au stri
a
Po rtug
al
Fin lan
d
Sw ede
n
Un ited
Kin gdo
m
Cze ch
Re pub
lic
Est onia
Cyp rus
La tvia
Lith uan
ia
Hu nga
ry Ma lta Po lan d Slo ven ia Slo vaki a Bu lga ria Cro atia Ro ma nia Tu rke y Ice lan d No rwa y Sw itze
rlan d 0 100 200 300 400 500 600 700 800 900 1000 1100 Be lgiu m De nm ark Ge rma ny Gre ece Sp ain Fra nce Ire lan d Italy
Luxe mb
ourg
Ne the
rlan ds
Au stri
a
Po rtug
al
Fin lan
d
Sw ede
n
Un ited
Kin gdo
m
Cze ch
Re pub
lic
Est onia
Cyp rus
Latv ia
Lith uan
ia
Hu nga
ry Ma lta Po lan d Slo ven ia Slo vaki a
Bulg aria
Cro atia Ro ma nia Tu rke y Ice lan d No rwa y Sw itze
rlan d
kg /
Municipal Waste
lished in Western Europe and the Scandinavian countries with a share of 30 % to 46 % in Denmark, Germany, the Netherlands, Finland, Sweden and Switzerland. Between 15 % to 30 % of the municipal waste are collected separately in France, Ireland, Italy, Estonia, Slovenia and Norway. In some of the new Member States separate collection systems are in the process of being built up and figures are still low or not available. The share of bulky waste collection accounts mostly for up to 10 % of the collected total.
A few countries with well established separate collection systems have reduced the share of traditional collection to about 50 % of the municipal waste or even below (Denmark, Ger-many, the Netherlands and Switzerland).
[image:24.595.57.549.216.456.2]Legend of Figure 4-7
Figure 4-7 Municipal waste collected by type of collection and by countries for 2002 (%) Figure 4-8 and figure 4-9 present a more detailed look on the
separately collected materials and quantities. Although data are incomplete the graph shows that paper, glass and organic mate-rials account for the biggest share in separate collection. Sepa-rately collected quantities amount up to 160 kg/person for waste paper and 40 kg/person for glass waste. The quantities of separately collected plastics and metals are mostly below 5 kg/ person with the exception of a few countries.
Of major interest with regard to the implementation of Directive 1999/31/EC on the landfill of waste is the reduction of biode-gradable waste going to landfills by separate collection of
organic materials. The quantities reported by the countries refer mainly to the separate collection of food and garden waste by bio-bins but may also include green waste from parks, cemeter-ies or other origin.
Of the 32 countries represented in the graph 13 did report figures on separate collection of organic waste. The highest amounts of separately collected organic waste are reported by Denmark, the Netherlands and Switzerland. These countries diverted in 2002 about 100 to 120 kg/person of biodegradable municipal waste from landfills. Germany, France, Italy and Estonia collected between 30 and 50 kg/person.
Not specified
Separate collection of waste fraction Collection of bulky waste
Traditional collection
0% 10% 20% 30% 40% 50% 60% 70% 80% 90% 100%
Be lgiu
m
De nm
ark
Ge rma
ny
Gre ece
Sp ain
Fra nce
Irela nd Italy
Luxe mb
ourg
Ne the
rlan ds
Au stri
a
Port uga
l
Fin lan
d
Sw ede
n
Un ited
Kin gdo
m
Cze ch
Re pub
lic
Est onia
Cyp rus
Latv ia
Lith uan
ia
Hu nga
ry Ma
lta
Po lan
d
Slo ven
ia
Slo vaki
a
Bu lga
ria Cro
atia
Ro ma
nia Turk
ey
Ice lan
d
No rwa
y
Sw itze
Legend of Figure 4-8 and 4-9
Figure 4-8 Separate collection of municipal waste by materials and countries for 2002 (%)
Figure 4-9 Separate collection of municipal waste by materials and countries for 2002 (kg/person)
Other Organic material Metal Plastic Glass Paper 0% 10% 20% 30% 40% 50% 60% 70% 80% 90% 100% Be lgiu m De nm ark Ge rm
any Gre ece Sp ain Fra nce Irela
nd Italy
Luxe mb
ou rg
Ne the
rlan ds Au stri a Po rtu
gal Fin
lan d
Sw ede
n
Un ited
Kin gdo
m Cze ch Re pu blic Est
onia Cyp
rus Latv
ia
Lith uan
ia Hu ng ary Ma lta Po lan d Slo ven ia Slo vaki a Bu lga ria Cro atia Ro ma nia Turk
ey Ice lan d No rwa y Sw itze
rlan d 0 50 100 150 200 250 300 350 Be lgiu m De nm ark Ge rm an y Gre ece Sp ain Fra nce Ire lan d Italy
Lu xem
bou rg Ne the rla nd s Au stri a Po rtu ga l Fin lan d Sw ed en Un ite dK ing do m Cze ch Re pu blic Est on ia Cy pru s La tvia Lith uan
ia Hu ng ary Ma lta Po lan d Slo ven ia Slo va kia Bu lga ria Cro atia Ro ma nia Tu rke y Ice lan d No rwa y Sw itze
rlan d
kg / per
[image:25.595.51.551.453.720.2]Municipal Waste
4.3 Treatment and Disposal of
Municipal Waste
Figure 4-11 and figure 4-10 show how municipal waste is managed in the countries. Figure 4-11 gives the quantities per inhabitant whereas figure 4-10 shows the percentage of treat-ment operations. The raw data for the graphs are included in Table 12 of Annex 4. The presentations distinguish between landfilling, incineration, recycling and composting. Incineration encompasses the incineration of waste with and without energy recovery. Recovery and disposal operations that were not speci-fied in the Joint Questionnaires are summarised under the heading ‘other treatment’.
The graphs highlight the differences of national waste manage-ment systems and strategies. The new EU Member States and the Candidate Countries still rely very much on the disposal of municipal waste on landfills. With the exception of the Czech Republic and the Slovak Republic all new Member States and Candidate Countries report landfill rates of 80 % or more. This applies also to the old EU Members Greece and Ireland.
By far the lowest landfill rates are achieved by Belgium, Denmark and the Netherlands. The three countries have reduced the share of waste going to landfills to 12 % or less of their municipal waste total. This is achieved through a mix of incineration, recycling and composting. Denmark is the country that relies most on incineration with an incineration rate of 56 %.
Recycling has gained an important role in nearly all EU 15 coun-tries, and accounts for the treatment of up to 33 % (Germany) of the municipal waste total. The figures also show that com-posting contributes considerably to waste management in several countries like Belgium, Denmark, Germany, Spain, France, Italy and the Netherlands. Between 13 % to 24 % of municipal waste are treated by composting in these countries, the composted amounts ranging between 71 kg/person in France and 147 kg/person in the Netherlands.
[image:26.595.59.550.355.596.2]Legend of Figure 4-10
Figure 4-10 Recovery and disposal of municipal waste by countries for 2002 (%)
Other treatment Composting Recycling
Incineration (with and without energy recovery) Landfilling
0% 10% 20% 30% 40% 50% 60% 70% 80% 90% 100%
Be lgiu
m
De nm
ark
Ge rm
an y
Gre ece
Sp ain
Fra nce
Ire lan
d Italy
Luxe mb
ourg
Ne the
rlan ds
Au stri
a
Po rtu
gal
Fin lan
d
Sw ed
en
Un ited
Kin gdo
m
Cze ch
Re pub
lic
Est onia
Cyp rus
La tvia
Lith ua
nia
Hu nga
ry Ma
lta
Po lan
d
Slo ven
ia
Slo vaki
a
Bu lga
ria
Cro atia
Ro ma
nia Tu
rke y
Ice lan
d
No rwa
y
Sw itze
Legend of Figure 4-11
Figure 4-11 Recovery and disposal of municipal waste by countries for 2002 (kg/person)
Other treatment Composting Recycling
Incineration (with and without energy recovery) Landfilling
0 100 200 300 400 500 600 700 800 900 1000
Be lgiu
m
De nm
ark
Ge rm
any Gre
ece Sp
ain Fra
nce Irela
nd Italy
Lu xem
bou rg
Ne the
rla nds
Au stri
a
Po rtu
gal Fin
lan d
Sw ede
n
Un ited
Kin gd
om
Cze ch
Re pu
blic Est
on ia
Cyp rus
Latv ia
Lith uan
ia
Hu ng
ary Ma
lta
Po lan
d
Slo ven
ia
Slo vaki
a
Bu lga
ria
Cro atia
Ro ma
nia Tu
rke y
Ice lan
d
No rwa
y
Sw itze
rlan d