1
Financial Centres’ Competitiveness and Economic Convergence: Evidence from the EU Regions
Marta Degl’Innocenti
1, Roman Matousek
2, Nickolaos G. Tzeremes
31Corresponding Author. University of Southampton, Southampton Business School, Highfield, Southampton, SO17 1BJ, United Kingdom. Tel. +44 23 8059 8093, Fax +44 23 8059 3844, E-mail address: m.deglinnocenti@soton.ac.uk.
2
Kent Business School, the University of Kent, Canterbury, Kent, CT2 7NZ, United Kingdom, Tel. +44 (0)1227 82 7465, Fax 44 (0)1227 8271111, E-mail address: R.Matousek@kent.ac.uk.
3University of Thessaly, Department of Economics, 28th October street, 78, 38333, Volos, Greece, Tel. +30 2421 074911, Fax +30 2421074772, E-mail address: bus9nt@econ.uth.gr.
Acknowledgements
We would like to thank Professor Jessie Poon and the three anonymous reviewers for their helpful and constructive comments on an earlier version of our manuscript. Any remaining errors are solely the authors’ responsibility.
Abstract
This study analyses the gaps in financial centres’ competitiveness and their impact on regional economic convergence in 23 EU Member States during the period of the Global Financial Crisis (GFC). In particular, we explore the economic convergence and divergence patterns among regions from two different perspectives across the selected EU Member States and within each country. From a methodological viewpoint, we apply a fully non-parametric framework to the club convergence model and address the endogeneity problem between financial centres’ competitiveness and regional economic convergence. Our results show that the large and internationally-oriented financial centres experienced a diverging trend in terms of the competitiveness of financial centres’ business environment during the peak of the crisis. We also find evidence that the convergence of financial centres reduces regional economic inequalities between the regions where financial centres are located. In contrast, the increase in the competitiveness of financial centres only serves to widen existing inequalities at the national level. Finally, we examine and discuss the impact of competitiveness drivers of financial centres on the convergence pattern of EU regions.
2 The process of economic convergence across European Union (EU) Member States and regions has attracted considerable attention from researchers and policymakers in the last two decades. A number of recent studies have contributed to academic discussions on economic convergence and growth patterns in the EU (see Ezcurra et al., 2009; Le Gallo and Dall’Erba, 2008; López-Bazo et al., 1999; Petrakos et al., 2005; Tselios et al., 2012). The common thread that runs through all these studies is that EU regions display significant and persistent disparities. Such findings raise questions as to whether the convergence process is achievable in the near future within EU regions and consequently within Member States.
Drawing on the regional convergence theory (López-Bazo et al., 1999), this study explores the convergence process within EU regions during the period of the Global Financial Crisis (GFC) by extending the previous empirical research on financial development and economic growth (e.g. Aghion et al., 2005; Henderson et al., 2013; Petrakos et al., 2005, 2011). The contribution of this paper can be summarised as follows. First, we advance the current research on financial development and regional studies by analysing the effect of financial centres’ competitiveness on interregional economic dynamics. Current empirical research has not extensively investigated the influence of global financial centres on the convergence trend of EU regions. Up until now, contemporary studies have analysed only individual financial centres (Amsterdam, London and Frankfurt) in the period before the GFC (Poon, 2003; Engelen, 2007; Engelen and Grote, 2009; Klagge and Martin, 2005; Karreman and Van der Knaap, 2009).i Instead, the period that we examine spans from 2008 to 2012. In this way, we contribute to the understanding of regional growth dynamics and policies during the ‘shock period’ of the GFC.
Second, we investigate how financial centres’ competitiveness explains the trend of economic convergence (divergence) at national and regional levels. In particular, one part of our analysis focuses on the effect of financial centres on the economic convergence of the regions in which the financial centres are located. Another part investigates the effect of financial centres’ development on regional inequality levels within countries. We also discuss and examine the factors that drive the convergence of economic performance of regions where financial centres are located.
3 The structure of the paper is as follows: Section 2 discusses the convergence of the European financial centres; Section 3 describes the database and methodology; Section 4 discusses the empirical findings; Section 5 sets out our conclusions and outlines directions for further research.
2. Financial Centres and Economic Regional Convergence
The economic convergence and integration of European regions have been recently addressed in several studies, for example, Ezcurra and Rapun, 2005; Ezcurra et al., 2009; Le Gallo and Dall’Erba, 2008; Petrakos et al., 2005; 2009; Tselios et al., 2012, among others. In particular, the high variability of economic resources and the uneven geographical growth within European countries has drawn a lot of attention. The main research questions are aimed at understanding regional growth patterns and to what extent regional economic dissimilarities are intrinsically structural, or rather cyclical. This is an important issue because the catch-up process has not always been deemed effective or fast enough, even though the European Commission has promoted European economic integration through several key policy initiatives (the Single Market, Monetary Union, and, more recently, through the European Regional Development Fund, the Cohesion Fund, and the European Social Fund).
In addition, opposite dynamics appear to prevail for national and regional economies in Europe, namely a converging trend at the national level and a diverging trend at the regional level. As some authors have emphasised (Longhi and Musolesi, 2007; Petrakos et al., 2011), the main driver of this paradox can be traced to the development of metropolitan areas. The New Economic Geography (NEG) developed by Krugman (1981, 1991) can explain part of the above mentioned paradox. In particular, the NEG accounts for the existence of a diverging trend in the process of economic integration in Europe. The reason is that the combination of agglomeration forces and market size creates the conditions in which leader regions can develop and grow, and it predicts the process of geographical agglomeration of production, high quality resources, and services in specific locations. The rationale is that agglomeration economies on the local allocation of resources favour the polarisation of regions into different ‘clubs’: poor peripheral regions and rich central-core regions. In this process, metropolitan areas have played a pivotal role, as they are strategic nodes of the modern economy because they offer high-level innovation services and a large labour market with a wide range of specialised qualifications (Longhi and Musolesi, 2007). These are all conditions that are crucial for both the stability and viability of firms. Large metropolitan areas therefore attract an increasing number of firms and tend to absorb resources from the surrounding areas.
In this context of increasing metropolisation, our first research question is based on whether the competitiveness of financial centres can contribute to explain the opposite trends between national and regional
economies. Our investigation is motivated by the fact that financial centres are well-integrated in metropolitan areas
4 almost imperative for financial institutions to be close to the clients. A tight spatial proximity to financial institutions located in international financial centres appears, in fact, to still facilitate the process of knowledge creation and dispersion (Engelen 2007; Faulconbridge et al., 2007). This is crucial for conducting profitable trades despite the advancement in information and communication technology (ICT) and the consequent reduction of the costs of communication and trading across space. Our hypothesis is, therefore, that the convergence of competitiveness of financial centres could help to explain the two opposite dynamics (regional economic convergence and divergence) at the European level. However, the way through which financial centres affect the regional economic convergence trends is not straightforward, especially during periods of financial turmoil.
On the one hand, a structural convergence of European financial centres can increase the international business cycle correlations of European regions and therefore could lead to convergence in per capita income. This view is consistent with Wacziarg (2001), who suggests that structural sector convergence within regions can lead to convergence in their per capita income. In this case, we argue that the increasing appeal of a financial centre can contribute to explaining the catch-up process of regional economies. However, we maintain that peripheral regions in a certain country can further lose their competitiveness because of a sort of draining process of capital and technological resources towards the regions where financial centres are located. Financial centres have been widely recognised to work as catalysts for labour forces, business, specialised corporate services and major financial institutions, and to promote technical innovation (Cassis, 2007). While regions where financial centres are located have a greater capacity to attract businesses and human resources, peripheral regions do not exert the same appeal. The distance from advanced regions can in fact discourage location decisions by firms operating mainly in national and international markets (Limao and Venables, 2001). As a result, this outlook could explain the uneven spatial distribution of economic and financial firms and services and explain the existence of different regional clubs.
5 are located. However, such an impact depends on the connectivity and specialisation of financial centres. European global financial centres (such as London, Frankfurt, Luxemburg and Paris) rely more on global and international relations with, for example, each other rather than on their national city systems (Z/Yen Group, 2010). Instead, second and third-tier financial centres are more orientated on the transnational and local businesses, and act primarily as producer service centres, rather than dealing with large-scale and global financial transactions (Lee et al., 1993). This makes second and third-tier financial centres less exposed to financial crises, which in turn would suggest that these latter financial centres can diverge from their growth pattern at a slower rate compared to financial centres that are more connected to each other.
A second question that emerges here is what factors contribute to the attractiveness of financial centres and, in turn, what explains the regional convergence at the European level and regional divergence at the national level. This issue is important because there are still relevant dissimilarities among financial centres, such as local financial regulations, corporate governance practices, and the business environment (Klagge and Martin, 2005; Karreman and Van der Knaap, 2009). In particular, previous studies have extensively investigated the organisational structure of the European financial system and the factors that contribute to the success of the stock exchange and financial market, and richness of local economies. While economic theory has traditionally attributed regional difference between financial centres to initial endowments (such as reputation, openness to foreign banks and accessibility (Jones, 1992), comparative advantages do not provide enough explanation for the spatial concentration of activity in specific financial centres with similar production structures. Financial centres benefit from a combination of agglomeration forces and market size to attract more businesses and financial services firms, high quality human resources, and services (Grote, 2008). Agglomeration mechanisms allow financial centres to improve their competitiveness through economies of scale, increasing inter-sectoral linkages, technological spillovers, and reduced transaction and transportation costs. Furthermore, Thrift (1994) and Porteous (1999), and more recently Faulconbridge et al. (2007), have emphasised that regulations and administrative procedures clearly matter for the spatial distribution of financial activities. The Bund-future market offers a clear example of the importance of regulation. In particular, due to the prevention of derivatives trading in Germany until 1990, the Bund-future market was initially traded and regulated in London even though it was primarily based on German federal bonds (Laulajainen, 2001). Subsequently, as a result of the re-regulation process, the Bund-future market moved to Frankfurt because of the advantages of the German electronic trading system, especially its cost-efficiency (Faulconbridge et al., 2007). Other examples in this regard are Luxembourg and Dublin, who appeal to hedge funds and other money managers because of their competitive fiscal systems.
6 tend to compensate lower economies of scale and reduce asymmetric information provided by nationally-oriented firms with a higher focus on specific financial products or services (Karreman and Van der Knaap, 2009). This can favour an in-depth knowledge of supplier and costumers, which is important to conduct complex and sophisticated trades. Aside from market characteristics, the attractiveness of financial centres is also determined by the local institutional, social, and environmental settings (Engelen et al., 2010; Gertler, 2010; Karreman and Van der Knaap, 2009). In fact, these factors exert a pervasive influence on the economy as a whole as they influence the business objectives and conduct of firms, managers, investors, and workers through an ensemble of formal regulations, and legislation as well as informal societal norms (Gertler, 2004). The existence of an advanced environmental and institutional setting, together with the attraction of high-skill labour and innovation, are all factors that can specifically increase the success of financial centres and favour the agglomeration of financial services. As a result, the combination of all these factors will give rise to higher regional economic growth rates over time and further enlarge the gap between more and less advanced regions where financial centres are located. Arguably, as the relevant literature suggests (for example, Crescenzi and Giua, 2016; Crescenzi and Rodríguez-Pose, 2011; Petrakos et al., 2005, 2011), structural socio-economic conditions in terms of productive structure, labour market, innovative capacity, and infrastructural endowment act as important determinants of regional economic growth. In particular, more advanced regions – where financial centres are typically located – can better benefit from higher economies of scale, agglomeration economies, higher level of innovation, more skilled human resources, and a more advanced market structure, compared to less advanced regions (Petrakos et al., 2011). While the attractiveness of financial centres is affected by regulatory, institutional and technological environments, financial centres are not merely passive recipients of the geography of uneven development (Lee et al., 1993). They in fact contribute themselves to the development and growth of the economic context wherein they operate. This reciprocal effect generates a potential endogeneity issue that is typical of the economic growth-financial development relationship (for example, Aghion et al., 2005; Henderson et al., 2013). This issue needs to be fully addressed from a methodological viewpoint.
3. Data and Methodology
3.1Data sample
7 education, and the flexibility of the labour market; business environment measures the regulation system (e.g. tax rates, levels of corruption, economic freedom and the ease of doing business); market access includes the level of securitisation, volume and value of trading in equities and bonds, and the number of firms engaged in the financial service sector; infrastructure takes into consideration the cost and availability of buildings and office space; and finally, general competitiveness refers to the overall competitiveness of the city and quality of life.
The uniqueness of the database is that the GFCI indexii incorporates all the essential aspects identified by the economic geography literature to be important for productivity growth, agglomeration economies and increasing returns, such as a skilled and flexible labour market, access to capital, infrastructure efficiency and quality, transportation costs, and regulatory and institutional settings. We collect data for these five key indicators from the Global Competitiveness Index (GFI) Database provided by the World Economic Forum.iii Based on the reports produced by the Z/Yen Group, the GFI displays a high correlation with the GFCI. Furthermore, it encompasses the most relevant and recurrent (listed as an important source for the GFCI for at least three years) sources of competitiveness at the country level for financial centres. We consider as drivers of the economic convergence/divergence of European regions the following indices of the GFI database: infrastructure (infrastructure); higher education and training, and labour market efficiency (people); market size and goods market efficiency (market access); business sophistication, innovation, institutions, macroeconomic environment and technological readiness (business environment), health and primary education (overall competitiveness).
We then assess the level of welfare in terms of regional GDP per capita at the NUTS3 level. We collected the data on GDP per capita from Eurostat. Our sample covers the period 2008–2012. We exclude the City of London from our sample. Clark (2002) and Faulconbridge (2004) show that London has a different type of financial system compared to continental Europe. It has a high volume of institutional and pension fund assets, privileged interchange with the US, diversification, and different services and product ranges. London acts as an outlier in our sample because it shows a very high rating and GDP compared to respectively the other European financial centres and regions.
Table 1 reports the descriptive statistics of the GFCI gaps, drivers of competitiveness and instruments used to address the endogeneity issue. Table 1 clearly indicates a wide heterogeneity GDP per capita within the European regions. It also shows that the GFCI is highly volatile, which means that it differs considerably across individual financial centres.
Insert Table 1 about here
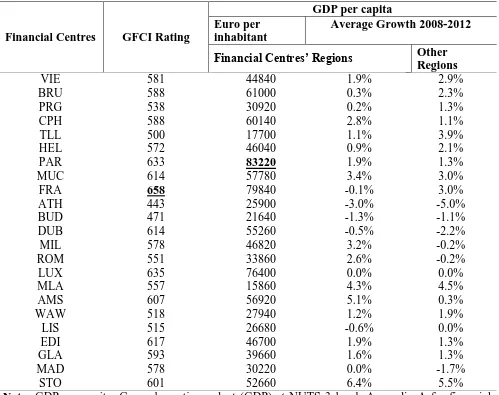
8 leading financial centre, which also provides specialist business services for transnational firms (Taylor et al., 2014). It is well-known globally, and presents a rich environment of different types of financial service institutions (Z/Yen Group, 2010). Table 2 reports the average GDP per capita from 2008 to 2012 for the NUTS3 level regions where financial centres are located. Paris is the leading centre in terms of GDP per capita. Table 2 also shows the average growth of GDP for the regions where the financial centres are located and those of all the other regions (in average terms) within a country.
Insert Table 2 about here
3.2 Methodological approach
The methodological approach refers to the notion of a club that can be traced back to Baumol (1986). This framework examines the long-run growth determined by different tendencies in regional patterns of growth and convergence.
Differing from previous studies, we extend the club convergence model proposed by Chatterji and Dewhurst (1996) by applying for the first time a local linear non-parametric technique (Li and Racine 2004, 2007). The majority of previous studies on club convergence use parametric estimation in order to examine the non-linear specification of convergence clubs with a few exceptions (Ezcurra et al., 2009). Our approach is more flexible as it does not require several necessary assumptions, such as the relationship form between the estimated initial and final gap, the existence of equilibria points, as well as monotonicity, concavity and homogeneity. Furthermore, the data directly determines the shape of the relationship between initial gaps and final gaps, and consequently the speed and size of convergence/divergence. We describe the main steps to replicate our analysis as follows.
We start by formalising the technology gap between a leading region and other regions, following Chatterji (1992) and Chatterji and Dewhurst (1996). Specifically,
I
andF
are the initial and final period under investigation. The GDP per capita in a final year
GDPPCi F,
can then be represented as:, ,
i
f
i F i I
GDPPC e GDPPC , (1)
where
GDPPCi I,
is the natural logarithm of GDP per capita in the initial period. Then taking the logarithms and solving for
fi , the growth rate over a specific period can be estimated as fi GDPPCi F, GDPPCi I, . The GDP per capita gaps between leading region (L) and another region i (i=1,..,N) can then be expressed as:, , ,
L F L I L I
GDPPC GDPPC
bGDPPC , (2), , ,
i F i I i I
GDPPC GDPPC
bGDPPC . (3)9
GDPPCL F, GDPPCi F,
1 b GDPPC
L I, GDPPCi I,
, (4) Equation (4) can be re-written as:, ,
i F i I
GGDPPC
GGDPPC , (5)where
1 b
and 𝐺𝐺𝐷𝑃𝑃𝐶𝑖 represents the gap between the leading regions and the other regions’ GDP per capita levels. Following the same procedure, we also construct two other gaps: (i) between financial centres’ rating levels (GRAT); and (ii) between the GDP per capita levels of the regions where a financial centre is located and those of other regions within the same country (WGGDPPC). For the calculation of WGGDPPC, we consider all regions at the NUTS3 level in each country.We then apply the local linear non-parametric regression (Li and Racine 2004, 2007) that takes the following form:iv
, , , 1,..., ,
i F i I i
GGDPPC m GGDPPC u i n (6)
, , , 1,..., .
i F i I i
GRAT m GRAT u i n (7)
Equation (6) refers to the club convergence-divergence of GDP per capita gaps (GGDPPC) using the local linear estimator, whereas equation (7) analyses the club convergence-divergence of financial centres’ rating gaps (GRAT). In equations (6) and (7) 𝑚(∙) represents the unknown smooth function that can be interpreted as the conditional mean of the dependent variable given the independent variable, whereasuidenotes the disturbances. We also use the local linear estimator to investigate the effect of financial centres’ rating gaps (GRAT) on: (i) the regions’ GDP per capita gaps (GGDPPC) in which the financial centres are located; and (ii) the GDP per capita gaps of the regions where a financial centre is located and the other regions within the same country (WGGDPPC). These equations take the following form:
, 1,..., ,i i i
GGDPPC m GRAT u i n (8)
, 1,..., .i i i
WGGDPPC m GRAT u i n (9)
10 Regardless, of this potential advantage and as a further robustness check, we apply a probability transition matrix (inter alia Hammond and Thompson, 2002; Pittau and Zelli, 2006; Quah, 1996) in order to examine the probability of divergence/convergence of GRAT, GGDPPC, and WGGDPPC. As a first step of the analysis we separate the estimated gaps (i.e. GRAT, GGDPPC and WGGDPPC) into four states representing four discrete states (i.e. from State 1: lower gaps to State 4: largest gaps) over the period 2008–2012 (see Appendix C for details).
As discussed in the literature review, there can be an endogeneity issue between financial centres’ competitiveness and regional economic convergence. Such an issue should be tackled by the non-parametric regression analysis. As pointed out by Frölich (2007) non-parametric approaches permit a better treatment of the effect of heterogeneity (over the parametric specifications) since the local linear estimator gives the value of the regression function at a given point by using neighbouring observations. As a result, it minimises possible endogeneity problems that can affect the relationship between the financial centres’ gaps and regional economic gaps. We also address the endogeneity problem by running a non-parametric instrumental variable regression. This is important because the vast majority of the previous empirical investigations do not include endogenous regressors in their non-parametric regression analysis. In particular, by following Horowitz (2011), we employ a methodological framework that directly incorporates the instrumental variables into the estimation. This framework is based on a local polynomial kernel regression. Specifically, the applied estimator allows – under the presence of instrumental variables – 𝑚 in equations (8) and (9) to be defined as a Fredholm equation of the first kind, which is the solution to an ill-posed inverse problem.v This enables us to directly address the endogeneity issues without imposing any functional form on, and linearity between, the variables. For the choice of the instrument variables to be included in our model, we follow the procedure introduced recently by Henderson et al. (2013). They propose a rigorous and innovative approach to select appropriate instrumental variables in a non-parametric regression framework. As a result, we first regress the potential instruments on the regional economic gaps by employing a local linear least square regression (Li and Racine, 2007). We then select only the variables that are not related to the dependent variable (regional economic gap, see equations 8 and 9). A further step of our analysis is to examine the correlation of the selected instruments with the endogenous regressors and we use them as instrumental variables in the non-parametric IV regression. After applying the described procedure, consistent with Henderson et al. (2013), we use the following instruments: Deposit Money Bank Assets/ (Deposit Money + Central) Bank Assets (DBACBA); Deposit Money Bank Assets/GDP (DBAGDP); Private Credit by Deposit Money Banks/GDP (PCRDGDP); and Bank Deposits/GDP (BDGDP).
4. Empirical Results
11 In this subsection we discuss the results that we obtain for the club convergence of our sample of EU23 financial centres. In particular, we assess how various global financial centres (such as Frankfurt, Luxemburg and Paris), and second and third-tier financial centres were differently affected by the GFC. This analysis also allows us to better understand whether the reduction of economic regional inequalities where financial centres are located is explained by a loss of competitiveness by top-tier financial centres, rather than to the catch-up process of second and third-tier financial centres.
Insert Figure 1.a-b about here
Figure 1 shows the convergence of the GFCI index (Subfigure 1.a) and GDP per capita between the regions where the financial centres are located (Subfigure 1.b) in 2008 compared to 2012. In Subfigure 1.a, we see that there are two clubs of financial centres in Europe, which indicates the existence of multi-equilibria points. Specifically, the first club encompasses the financial centres that have the highest GFCI, such as Frankfurt, Luxemburg, Paris, Dublin, Edinburgh and Munich, and those with a mid-high level GFCI. The group of leading financial centres in terms of competitiveness, that includes Dublin, Edinburgh, Luxembourg, Paris, shows a diverging pattern from Frankfurt over the period 2008-2012. In a borderline position between the first and second club, there are the financial centres in western Europe with a mid-high GFCI, such as Amsterdam, Stockholm, Copenhagen, Munich, Glasgow, Helsinki and Vienna. Among themthe Nordic financial centres, Helsinki, Copenhagen and Stockholm, converge toward the top club.
The second club includes the financial centres in western Europe (such as Milan, Rome, Madrid and Brussels) that have a transnational profile. These centres maintain a leading position with respect to the other Eastern and Western financial centres such as Lisbon and Athens. Several eastern European financial centres, such as Warsaw, Prague, Budapest and Tallinn exhibit a slow increase in competitiveness during the period 2008-2012. The existence of multiple clubs among the financial centres aligns with the findings of Poon (2003) who shows that the global system of world financial and capital centers (WFCC) was characterized by different tiers over the period 1980-1998. Moreover, our findings suggest that regardless the increased trend of competitiveness among the cross-country regions in which the financial centres are located, there are still consistent intra-country regional discrepancies. This is due to the fact that industrial production and financial activities have been mainly concentrated in the capital cities in which the financial centres are located. This finding aligns with the view by Klagge and Martin (2005), who argue that financial markets operate in a non-neutral way across space-economy. This suggests that the concentration of capital markets in a specific region has a detrimental effect on the allocation of funds and resources in respect to the other (non-central) regions.
12 suggested by previous studies (for example, Le Gallo and Dall’Erba, 2008). This finding confirms that there is a persistent inequality within European regions with two convergence clubs within the wealthier EU regions. Among the second club of rich regions, Brussels and Dublin show a diverging trend from the leading centres. In contrast, Stockholm, Amsterdam, but also Munich appear to catch up with the richer regions in terms of both competitiveness, as seen earlier, and welfare. Furthermore, it is evident that the financial crisis has slowed the economic growth of the majority of financial centres. In contrast, we find that the regions of Frankfurt, Paris and Luxemburg, where the top European centres are located, grew at a constant rate over the entire period. These results are consistent with several empirical studies (Corrado et al., 2005), which state that economic convergence is more likely to happen for highly developed economies.
A third club consists of the western European regions that exhibit a decreasing trend compared to the leading regions. A diverging trend is also evident for low-productivity eastern regions, such as Tallinn, Budapest, Warsaw and Prague. This in turn suggests the existence of a persistent trend rather than a cyclical trend for some eastern European economies. The dynamics of financial centres’ inequalities during the examined short-term period appear to slow down regions’ economic growth prospects.
Insert Table 3 about here
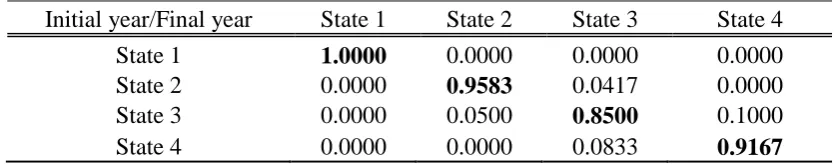
Table 3 presents the average of annual transition matrices over the GFC for the three gap-categories and the four states.vi Specifically, Panel A presents the different states of the financial centres’ rating gaps. The diagonal elements indicate the probability of countries remaining in the same state over the examined period, whereas the off-diagonal elements indicate the probability of movement across states. It is evident that financial centres with lower financial rating gaps (State 1) and higher rating gaps (State 4) are more likely to stay in the same state rather than move to a higher state (State 2) or lower state (State 3), respectively. Instead, financial centres in State 2 or 3 have a higher probability of either converging to (move towards a lower state) or diverging from leading financial centres (move towards a higher state)vii. In a similar manner, Panel B of Table 3 examines the movements of GDP gaps among the different EU regions in which the financial centres are located, while Panel C analyses the movements of GDP gaps between the region where a financial centre is located and the other regions in the same country Finally, Panel C suggests that there is not a high probability that within country regions’ GDP gaps will not change from their initial state during the examined period. The results from the above analysis complement and verify our previous findings, suggesting different convergence/divergence clubs among the regions and the financial centres.
13 This section addresses our first research question, namely whether the convergence of competitiveness of financial centres could help to explain the two opposite dynamics (economic regional convergence and divergence) at the European level.
In particular, Figure 2 examines the effect of the convergence of the financial centres’ ratings gaps (GRAT) on the regional inequality measured in terms of GDP per capita (GGDPPC) of the regions in which the financial centres are located.viii
Insert Figure 2.a-b about here
Subfigure 2.a shows the results for the non-parametric regression (Li and Racine, 2007) (red dash-dotted line). To take into account the possible endogeneity issue between the GFCI rating‘s gaps (GRAT) and the gaps in terms of GDP per capita between the regions where financial centres are located (GGDPPC) we also run a non-parametric instrumental variable regression (Horowitz, 2011) (blue dashed-line). Our findings suggest that an increase of the gaps of financial centres’ rating levels (GRAT) has a positive effect on the in-terms GDP per capita gap between the regions where financial centres are located (GGDPPC), as indicated by the increasing non-parametric line.A similar trend is also confirmed by the non-parametric instrumental variable regression. These two findings provide strong support for the fact that the competitiveness of financial centres contributes to explain the economic converging trends of the regions where financial centres are located.However, this relationship appears to follow a non-linear pattern especially when we focus on the non-parametric instrumental variable regression (dashed line).
Subfigure 2.b. focuses on the relationship between the GFCI rating’s gaps (GRAT) and the gaps in terms of GDP per capita between the regions where financial centres are located and the other regions within the same country (WGGDPPC). In a similar manner, our findings suggest that WGGDPPC decreases as the GRAT increases, which indicates that an increase in financial centres’ competitiveness contributes to the enlargement of existing inequalities between regions within countries (WGGDPPC). Furthermore, we note that in this case the line of the non-parametric instrumental variable regression has a remarkable curvilinear pattern. Overall, this result shows that financial centres also contribute to determine the diverging trend between regions at the national level. This would suggest that the regions where financial centres are located attract resources from more peripheral regions in this way enlarging their existing gap with them. Poor regions therefore become poorer, while rich regions can reinforce their prevailing position. This finding again verifies the non-neutrality hypothesis described previously. It means that the allocation of resources is concentrated only on the regions in which the financial markets are located (Klagge and Martin, 2005).
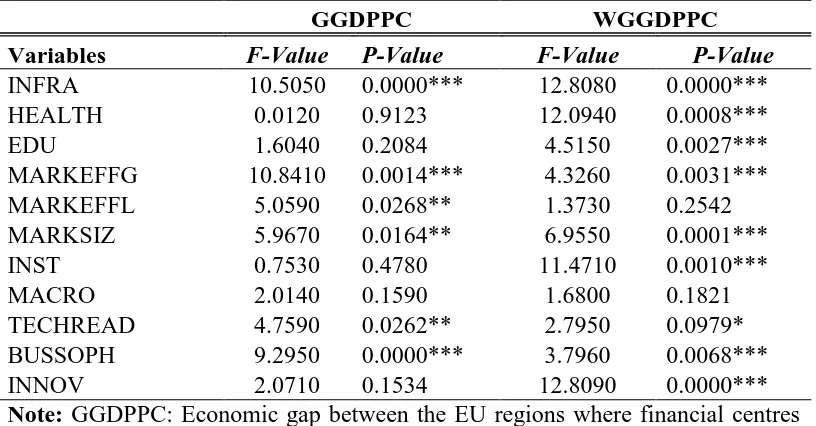
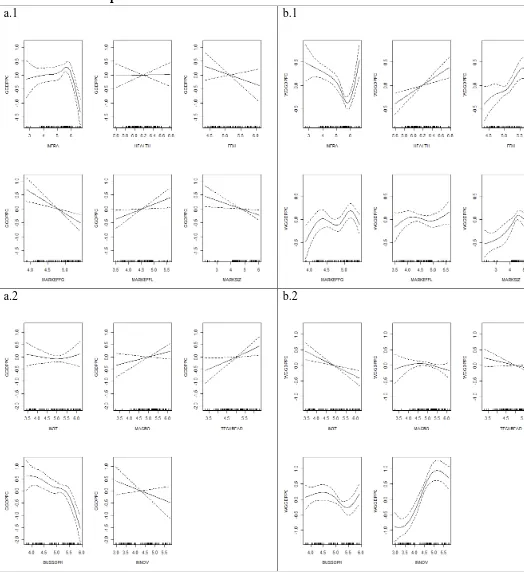
14 where we examine the impact of competitiveness drivers on WGGDPPC and GGDPPC. In addition, Figure 3 displays how WGGDPPC and GGDPPC change for the effect of the increase of each competitiveness source of the GFCI.
Insert Table 4 about here
Insert Figure 3.a-b about here
From Table 4, we observe that the competitiveness drivers of the GFCI exhibit a contrary impact on WGGDPPC and GGDPPC. This is plausible since the GFCI exerts a diverging impact on WGGDPPC and GGDPPC. As depicted in Subfigure 3.a.1-2, our results provide evidence that infrastructure (INFRA), goods market efficiency (MAREFFG), market size (MARKSIZ) and business sophistication (BUSSOPH) contribute to the economic catch-up process of regions where financial centres are located. These findings provide further scatch-upport for existing studies (for example, Petrakos et al. 2011) that find similar sources to be important factors for economic growth, especially in the case of wealthier regions. These regions are more likely to benefit from agglomeration economies, positive externalities and a high-skilled labour force. As a result, they grow faster and tend to accelerate their interregional divergence pattern with respect to less wealthy regions. When looking at the role of key drivers of WGGDPPC (Subfigure 3.b.1-2), we find that infrastructure (INFRA); health and primary education (HEALTH); higher education and training (EDU); goods market efficiency (MARKEFFG); market size (MARKSIZ); institutional quality (INST); technological readiness (TECHREAD); business sophistication (BUSSOPH); and innovation (INN) have a highly significant impact (Table 3). Consistent with previous studies (Crescenzi and Giua, 2016; Crescenzi and Rodríguez-Pose, 2011; Petrakos et al., 2005, 2011), our findings confirm the importance of structural socio-economic conditions, such as market forces, policy factors and infrastructural endowment for regional economic convergence. In particular, we find that the quality of transport, electricity and telephony infrastructure (INFRA), ix high levels of efficiency of the institutions (INST) (in terms of adequate property rights, low undue influence, government efficiency and security), ITC use, technological adoption (TECH READ), and business sophistication (BUSSOPH) reduce regional disparities within a country. In contrast, market size and efficiency, health and primary education, and capacity of innovation appear to enlarge the interregional gaps within a country (WGGDPPC). In line with Crescenzi (2005)’s argument, freely available technological knowledge (such as TECHREAD) can favour convergence among regions, while innovative activities acquired through education, R&D investment and other innovation activities (such as INN) can lead to regional disparities, due to the accumulation of knowledge in wealthier regions. This can therefore explain the contrasting trend between TECH READ and INN.
15 and are therefore less capable of competing in more integrated markets. An open market, MARKEFFG and MARKSIZ, can thus contribute to the catch-up process of regions where financial centres are located on an international basis, but at the same time can harm the economic converge process within a country.
5 Concluding Remarks
It is evident that the development of financial centres’ is a result of a dynamic competitive process, which is expressed through the creation of hierarchical tendencies among the regions and the capital cities in which they are located (Poon, 2003). To this extent this paper brings further insights on the role of financial centres on the creation of the opposite convergence dynamics that appear to prevail at the national and regional economies in Europe. In particular, we examine the role of financial centres in the creation of this opposite trend from different perspectives. Firstly, we analyse the economic converging process of the regions where financial centres are located at the cross-country level. Secondly, we investigate the converging process among the regions where financial centres are located and all the other regions in the same country. From a methodological viewpoint, we extend the club convergence model proposed by Chatterji (1992) and Chatterji and Dewhurst (1996) by applying for the first time a local linear non-parametric technique (Li and Racine 2004, 2007).
Our results provide evidence that Frankfurt has consolidated its position among the leading financial centres Luxemburg, Paris, Dublin in continental Europe. This finding is consistent with Poon (2003), who shows the increased hierarchical tendencies among financial centres but also fragmentation and differentiation among top tier financial centres. Furthermore, we find that the reduction of the gaps of financial centres’ competitiveness sharpens the inequalities between the regions where these financial centres are located and the other regions within the same country. This result is consistent with ‘non-neutrality’ view of Klagge and Martin (2005, p.387), based on which the
relationship between finance and the real economy is non-neutral. This means that the spatial structure of the
financial system can lead to a geographical bias for resource and investment allocation. In return, the regions and cities where financial are located absorb investments and skilled labour from the other regions. Thus they grow in a disanalogous mode from the other regions within the same country. As a result, this can initiate a diverging process between the leading regions/ cities in which the financial centres are located and the rest of the country’s regions/cities.
16 sophistication, and infrastructure can speed up the convergence process between the regions where financial centres are located and the other regions within the same country. Particularly, the importance of institutions and infrastructure on minimizing regional divergence is also highlighted by Petrakos et al. (2005) and Tselios et al. (2012), suggesting that institutional arrangements alongside with an efficient allocation of infrastructural investments can enhance the convergence process among regions. Finally, our findings remain the same also when we control for potential endogeneity problems between the competitiveness of financial centres and the regional economic convergence/divergence.
Some key limitations should be considered when interpreting these results. The adopted convergence model does not clearly allow us to identify whether the gap is driven by leading or lagging regions. We are also aware of the fact that there are other characteristics of leading and lagging regions alongside specific growth mechanisms that could affect the converging/diverging patterns between regions. These factors are not incorporated in to our analysis and can include factors such as R&D expenditure, patent intensity, productivity growth, spillover effects, and European Funds (Crescenzi, 2005; Crescenzi and Giua, 2016; Le Gallo and Dall’Erba, 2008; Petrakos et al., 2005, 2011). Furthermore, national factors can explain the regional within-country convergence/divergence only when these factors also reflect those of the regions where financial centres are located. Finally, our analysis solely focuses on the period of the GFC. Nevertheless our findings still provide relevant policy considerations We state that policy interventions that aim to maximise the sources of competitiveness of the GFCI may penalise the regional economic catch-up of less advanced regions. This can occur when resources, e.g., investments and labour, are centralized towards more advanced regions in which the financial centres are typically located. Therefore it is crucial that interventions for regional development take into account both the international needs and pressures of the regions where financial centres are located along with the needs of more peripheral regions. The increase in the competitiveness of financial centres might require to counterbalance the aggregation of financial services in a specific location with a network of financial institutions and services dedicated to the support and stimulation of the local regional demand and economies. In this context, regional development policies can play a pivotal role in reducing the divergence phenomenon. As suggested by Klagge and Martin (2005), these policies could focus on the decentralization of financial systems with a further enhancement of regional local clusters and local capital markets in terms of institutions, networks and agents.
17 The paper can be further extended in several directions. One might focus on possible spill-over effects between regions by collecting additional data at the regional level to examine the convergence pattern of EU regions. Alternatively, an additional extension of our study might explore the ways through which resources move between regions to better understand the factors underlying the regional economic dynamics. This will also provide indications for further interventions to alleviate poverty and unemployment levels between regions. Finally, Brexit is likely to alter the existent equilibrium and competitiveness of EU financial centres. Therefore it would be of great interest to analyse how Brexit could affect the regional economic dynamics in continental Europe.
Acknowledgements
We would like to thank Professor Jessie Poon and the three anonymous reviewers for their helpful and constructive comments on an earlier version of our manuscript. Any remaining errors are solely the authors’ responsibility
References
Aghion P, Howitt P and Mayer-Foulkes D (2005) The Effect of Financial Development on Convergence: Theory and Evidence. The Quarterly Journal of Economics 120 (1): 173–222.
Amin A and Thrift N (1992) Neo-Marshallian nodes in global networks. International Journal of Urban and Regional Research 16: 571-587.
Baumol W (1986) Productivity growth, convergence and welfare: what the long-run data show. American Economic Review 76(5): 1072–85.
Cassis Y (2007) Capitals of Capital. A History of International Financial Centres, 1780–2005 (Cambridge University Press: Cambridge).
Chatterji M (1992) Convergence clubs and endogenous growth. Oxford Review of Economic Policy 8(4): 57–69. Chatterji M and Dewhurst H (1996) Convergence clubs and relative economic performance in Great Britain: 1977–
1991. Regional Studies 30(1): 31–40.
Clark GL (2002) London in the European financial services industry: locational advantages and product complementarities. Journal of Economic Geography 2(4): 433–53.
Corrado L, Martin R and Weeks M (2005) Identifying and interpreting regional convergence clusters across Europe. The Economic Journal 115: C133–C160.
18 Crescenzi R and Giua M (2016) The EU cohesion policy in context: does a bottom-up approach work in all regions?
Environment and Planning A. Forthcoming, doi: 10.1177/0308518X16658291.
Crescenzi R and Rodríguez-Pose A (2011) Reconciling top-down and bottom-up development policies. Environment and Planning A 43(4): 773–780.
Dell’Ariccia G, Detragiache E, and Rajan R (2008) The real effect of banking crises. Journal of Financial Intermediation 17(1): 89–112.
Daniels P (2002) Services and Metropolitan Development (London: Routledge).
Engelen E (2007) Amsterdamned'? The uncertain future of a financial centre. Environment and Planning A 39: 1306 -1324.
Engelen E and Grote MH (2009) Stock exchange virtualisation and the decline of second-tier financial centres—the cases of Amsterdam and Frankfurt. Journal of Economic Geography 9: 679–96.
Engelen E, Konings M and Fernandez R (2010) Geographies of Financialization in Disarray: The Dutch Case in Comparative Perspective. Economic Geography 86(1): 53–73.
Ezcurra R and Rapún M (2006) Regional disparities and national development revisited: The case of Western Europe. European Urban and Regional Studies 13(4): 355–369.
Ezcurra R, Iraizoz B and Pascual P (2009) Total factor productivity, efficiency, and technological change in the European regions: a non-parametric approach. Environment and Planning A 41: 1152–70.
Faulconbridge JM (2004) London and Frankfurt in Europe’s evolving financial centre network. Area 36(3): 235– 244.
Faulconbridge J, Engelen E, Hoyler M and Beaverstock J (2007) Analysing the changing landscape of European financial centres: the role of financial products and the case of Amsterdam. Growth and Change 38: 285–309. French S, Leyshon A and Thrift N (2009) A very geographical crisis: the making and breaking of the 2007–2008
financial crisis. Cambridge Journal of Regions, Economy and Society 2 (2): 287–302.
Frölich M (2007) Nonparametric IV estimation of local average treatment effects with covariates. Journal of Econometrics 139: 35–75.
Gertler M S (2004) Manufacturing Culture: The Institutional Geography of Industrial Practice (Oxford University Press: Oxford).
Gertler MS (2010) Rules of the game: the place of institutions in regional economic change. Regional Studies 44(1): 1–15.
Grote MH (2008) Foreign banks’ attraction to the financial centre Frankfurt—an inverted ‘U’-shaped relationship.
Journal of Economic Geography 8: 239–58.
19 Hammond GW and Thompson E (2002) Mobility and modality trends in US state personal income. Regional Studies
36(4): 375-387.
Hayfield T and Racine JS (2008) Nonparametric Econometrics: The np Package. Journal of Statistical Software
27(5): 1–32.
Henderson DJ, Papageorgiou C and Parmeter CF (2013) Who benefits from financial development? New methods, new evidence. European Economic Review 63: 47–67.
Horowitz J L (2011) Applied nonparametric instrumental variables estimation. Econometrica 79(2): 347-394. Hurvich CM, Simonoff JS and Tsai CL (1998) Smoothing parameter selection in nonparametric regression using an
improved Akaike information criterion. Journal of the Royal Statistical SocietyB 60: 271–93. Jones G (1992) Multinational and international banking (Edward Elgar: Aldershot).
Karreman B and van der Knaap B (2009) The financial centres of Shanghai and Hong Kong: competition or complementarity? Environment and Planning A 41: 563–80.
Klagge B and Martin R (2005) Decentralized versus centralized financial systems: is there a case for local capital markets? Journal of Economic Geography 5: 387–421.
Kroszner RS, Laeven L and Klingebiel D (2007) Banking crises, financial dependence, and growth. Journal of Financial Economics 84(1): 187–228.
Krugman P (1981) Trade, accumulation and uneven development. Journal of Development Economics 8(2): 149– 161.
Krugman P (1991) Increasing returns and economic geography. Journal of Political Economy 99(3): 483-499. Laulajainen R (2001) End of geography at exchanges? Zeitschrift für Wirtschaftsgeographie 45(1): 1–14.
Lee R and Schmidt-Marwede U (1993) Interurban competition? Financial centres and the geography of financial production. International Journal of Urban and Regional Research 17: 492 – 515.
Le Gallo J and Dall’Erba S (2008) Spatial and sectoral productivity convergence between European regions, 1975– 2000. Papers in Regional Science 87(4): 505–25.
Li Q and Racine J (2004) Cross-validated local linear nonparametric regression. Statistica Sinica 14: 485–512. Li Q and Racine J (2007) Nonparametric Econometrics: Theory and Practice (Princeton University Press: Princeton,
NJ).
Limao N and Venables A (2001) Infrastructure, geographical disadvantage and transport costs. World Bank Economic Review 15(3): 451–479.
Longhi C and Musolesi A (2007) European cities in the process of economic integration: Towards structural .convergence. Annals of Regional Science 41: 333–351.
20 Petrakos G, Kallioras D and Anagnostou A (2011) Regional convergence and growth in Europe: Understanding
patterns and determinants. European Urban and Regional Studies 18: 375–391.
Petrakos G, Rodríguez-Pose A and Rovolis A (2005) Growth, integration, and regional disparities in the European Union. Environment and Planning A 37(10): 1837–55.
Pittau M G and Zelli R (2006). Empirical evidence of income dynamics across EU regions. Journal of Applied Econometrics 21(5): 605-628.
Porteous D (1999) The development of financial centres: Location, information externalities and path dependency. In Money and the space economy, ed. R. Martin, 95–114. Chichester: Wiley.
Poon JP (2003) Hierarchical tendencies of capital markets among international financial centers. Growth and Change 34(2): 135-156.
Quah D T (1996). Empirics for economic growth and convergence. European Economic Review 40(6): 1353-1375. Rodríguez-Pose A and Fratesi U (2004) Between development and social policies: the impact of European Structural
Funds in Objective 1 regions. Regional Studies 38: 97–113.
Taylor PJ, Derudder B, Faulconbridge J, Hoyler M and Ni P (2014) Advanced Producer Service Firms as Strategic Networks, Global Cities as Strategic Places. Economic Geography 90(3): 267–91.
Tselios V, Rodríguez-Pose A, Pike A, Tomaney J and Torrisi G (2012) Income inequality, decentralisation, and regional development in Western Europe. Environment and Planning A 44(6): 1278-1301.
Thrift N J (1994) On the social and cultural determinants of international financial centres: The case of the City of London. In Money, power and space, ed. S. Corbridge, R.L. Martin, and N.J. Thrift, 327–355. Oxford: Blackwell. Wacziarg R (2001) Structural convergence. mimeo Stanford University.
Wójcik D (2013) The dark side of NY-LON: financial centres and the global financial crisis. Urban Studies 50(13): 2736–275.
Wood SN (2000) Modelling and smoothing parameter estimation with multiple quadratic penalties. Journal of the Royal Statistical Society: Series B (Statistical Methodology) 62(2): 413-428.
Wood SN (2004) Stable and efficient multiple smoothing parameter estimation for generalized additive models.
Journal of the American Statistics Association 99: 673-686.
Wood SN (2006) Generalized additive models: an introduction with R. Chapman & Hall/CRC Texts in Statistical Science press.
21
Table 1: Descriptive Statistics
Variable Mean Std. Dev. Min Max
GRAT 85 60 0 262
GGDPPC 38090 19277 0 70500
WGGDPPC 20706 12999 0 61372
DBACBA 98.874 1.466 93.928 99.992
DBAGDP 130.748 65.327 1.163 245.128
PCRDGDP 102.298 66.738 8.883 237.584
BDGDP 85.954 74.208 1.470 394.598
INFRA 5.228 0.894 2.770 6.650
HEALTH 6.186 0.232 5.592 6.758
EDU 5.129 0.482 4.351 6.094
MARKEFFG 4.815 0.427 3.884 5.495
MARKEFFL 4.511 0.504 3.505 5.600
MARKSIZ 4.722 0.966 2.159 6.016
INST 4.920 0.814 3.444 6.182
MACRO 5.026 0.571 3.290 6.083
TECHREAD 5.068 0.686 3.294 6.288
BUSSOPH 4.988 0.600 3.792 5.935
INNOV 4.290 0.779 2.979 5.756
22
Table 2. GFCI and GDP per Capita: average over the period 2008-2012
Financial Centres GFCI Rating
GDP per capita Euro per
inhabitant
Average Growth 2008-2012
Financial Centres’ Regions Other
Regions
VIE 581 44840 1.9% 2.9%
BRU 588 61000 0.3% 2.3%
PRG 538 30920 0.2% 1.3%
CPH 588 60140 2.8% 1.1%
TLL 500 17700 1.1% 3.9%
HEL 572 46040 0.9% 2.1%
PAR 633 83220 1.9% 1.3%
MUC 614 57780 3.4% 3.0%
FRA 658 79840 -0.1% 3.0%
ATH 443 25900 -3.0% -5.0%
BUD 471 21640 -1.3% -1.1%
DUB 614 55260 -0.5% -2.2%
MIL 578 46820 3.2% -0.2%
ROM 551 33860 2.6% -0.2%
LUX 635 76400 0.0% 0.0%
MLA 557 15860 4.3% 4.5%
AMS 607 56920 5.1% 0.3%
WAW 518 27940 1.2% 1.9%
LIS 515 26680 -0.6% 0.0%
EDI 617 46700 1.9% 1.3%
GLA 593 39660 1.6% 1.3%
MAD 578 30220 0.0% -1.7%
STO 601 52660 6.4% 5.5%
23
Table 3. Estimated average of annual transition matrixes for 2008-2012
A. Financial centers’ rating gaps-GRAT
B. GDP gaps - between regions (GGDPPC)
C. GDP gaps - within regions (WGGDPPC)
Initial year/Final year State 1 State 2 State 3 State 4
State 1 1.0000 0.0000 0.0000 0.0000
State 2 0.0000 0.9583 0.0417 0.0000
State 3 0.0000 0.0500 0.8500 0.1000
State 4 0.0000 0.0000 0.0833 0.9167
Note: State1= Smaller Gap (1st Quartile) to State 4 =Larger gap (4th Quartile); GRAT: Financial centres’ rating gaps; GGDPPC: Economic gap between the EU regions where financial centres are located; WGGDPPC: Economic gap between the region where a financial centre is located and the other regions in the same country.
Initial year/Final year State 1 State 2 State 3 State 4
State 1 0.7708 0.1458 0.0833 0.0000
State 2 0.2292 0.5000 0.1875 0.0833
State 3 0.0000 0.4250 0.5500 0.0250
State 4 0.0000 0.0000 0.1042 0.8958
Initial year/Final year State 1 State 2 State 3 State 4
State 1 0.7917 0.2083 0.0000 0.0000
State 2 0.2083 0.7500 0.0417 0.0000
State 3 0.0000 0.0500 0.9500 0.0000
24
Table 4: F-statistics and estimated p-values of the nonparametric regressions
GGDPPC WGGDPPC
Variables F-Value P-Value F-Value P-Value
INFRA 10.5050 0.0000*** 12.8080 0.0000***
HEALTH 0.0120 0.9123 12.0940 0.0008***
EDU 1.6040 0.2084 4.5150 0.0027***
MARKEFFG 10.8410 0.0014*** 4.3260 0.0031***
MARKEFFL 5.0590 0.0268** 1.3730 0.2542
MARKSIZ 5.9670 0.0164** 6.9550 0.0001***
INST 0.7530 0.4780 11.4710 0.0010***
MACRO 2.0140 0.1590 1.6800 0.1821
TECHREAD 4.7590 0.0262** 2.7950 0.0979*
BUSSOPH 9.2950 0.0000*** 3.7960 0.0068***
INNOV 2.0710 0.1534 12.8090 0.0000***
25
Appendix A: Financial Centres
ABBREVIATION FINANCIAL CENTRE
AMS Amsterdam
ATH Athens
BRU Brussels
BUD Budapest
CPH Copenhagen
DUB Dublin
EDI Edinburgh
FRA Frankfurt
GLA Glasgow
HEL Helsinki
LIS Lisbon
LUX Luxembourg
MAD Madrid
MLA Malta
MIL Milan
MUC Munich
PAR Paris
PRG Prague
ROM Rome
STO Stockholm
TLL Tallinn
VIE Vienna
WAW Warsaw
Appendix B: The drivers of financial centres’ competitiveness
ABBREVIATION DESCRIPTION
INFRA Infrastructure
HEALTH Health and primary education
EDU Higher education and training
MARKEFFG Goods market efficiency
MARKEFFL Labour market efficiency
MARKSIZ Market size
INST Institutions
MACRO Macroeconomic environment
TECHREAD Technological readiness
BUSSOPH Business sophistication
26
Appendix C: Diachronical representation of the different states of the estimated gaps
Note: State1= Smaller Gap (1st Quartile) to State 4 =Larger gap (4th Quartile); GRAT=Financial center rating gaps, GGDPPC: Economic gap between the EU regions where financial centres are located; WGGDPPC: Economic gap between the region where a financial centre is located and the other regions in the same country.
GRA T 08 GRA T 09 GRA T 10 GRA T 11 GRA T 12 GGDPC P08 GGDPC 09 GGDPC 10 GGDPC 11 GGDPC 12 WGGDPP C 08 WGGDPP C 09 WGGDPP C 10 WGGDPP C 11 WGGDPP C 12
AMS 1 2 2 2 1 2 2 2 2 1 3 3 3 3 4
ATH 4 4 4 4 4 4 4 4 4 4 1 1 1 1 1
BRU 2 2 2 3 2 1 1 1 1 2 4 4 4 4 4
BUD 4 4 4 4 4 4 4 4 4 4 2 2 2 2 2
CPH 2 2 3 2 2 1 1 1 1 1 3 3 4 4 3
DUB 1 1 1 2 3 1 2 2 2 2 4 4 4 4 4
EDI 2 3 3 2 2 2 2 3 3 2 4 4 3 3 3
FRA 1 1 1 1 1 1 1 1 1 1 4 4 4 4 4
GLA 1 1 1 1 2 3 3 3 3 3 2 2 2 2 2
HEL 3 3 3 2 2 2 2 2 2 2 2 2 2 2 2
LIS 4 4 4 4 4 4 4 4 4 4 2 2 2 2 2
LUX 1 1 1 1 1 1 1 1 1 1 1 1 1 1 1
MAD 3 2 2 3 3 3 3 3 3 3 1 1 1 1 1
MIL 3 3 2 3 3 2 2 2 2 2 3 3 3 3 3
MLA 2 3 3 4 4 4 4 4 4 4 1 1 1 1 1
MUC 2 1 1 1 1 2 1 1 1 1 4 4 4 4 4
PAR 1 1 1 1 1 1 1 1 1 1 4 4 4 4 4
PRG 4 4 4 3 3 3 3 3 3 3 3 3 3 2 2
ROM 3 3 2 3 3 3 3 3 3 3 1 1 1 1 1
STO 2 2 2 1 1 2 2 2 2 2 2 2 2 3 3
TLL 4 4 4 4 4 4 4 4 4 4 1 1 1 1 1
VIE 3 2 3 2 2 3 3 2 2 3 2 2 2 2 2
27
Figure 1: Convergence clubs for financial centres and EU regions where they are located
a
b
28
Figure 2: The impact of financial centres’ rating gap on the economic gaps of European regions
a
b
29
Figure 3: Non-parametric regressions between GDP gaps and the main drivers of financial centres’ competitiveness
Note: The plots have been constructed applying non-parametric additive regressions with tensor smoother products (Wood, 2000, 2004, 2006). GGDPPC: Economic gap between the EU regions where financial centres are located; WGGDPPC: Economic gap between the region where a financial centre is located and the other regions in the same country. Appendix B for the other abbreviations.
a.1 b.1
30
Endnotes
i To our knowledge the only study that examines the tiers of world financial centres in terms of their evolving
hierarchical tendencies is the one conducted by Poon (2003).
ii Data on the GFCI Index is retrieved from http://www.zyen.com/research/gfci.html. Access date 20/03/2015. iii Data retrieved from http://reports.weforum.org/global-competitiveness-report-2015-2016/downloads/
(10/09/2016). The GFCI provides a complete dataset for all the countries where financial centres are located over the period of our analysis. All the indexes range from 1 (worst score) to 7 (best score).
iv In our local linear estimator, we use a second-order Gaussian kernel and a bandwidth (smoothing parameter)
introduced by Hurvich et al. (1998), which is based on the Akaike information criterion (AIC). According to Li and Racine (2004, 2007) the particular bandwidth chosen is the most suitable since it has extremely good finite sample properties and performs better with small samples.
v A Fredholm equation of the first kind is an integral equation named by the mathematician Erick Ivan Fredholm.
In order to explain in a general form an ‘ill-posed’ inverse problem let Θ be a nonlinear operator. Then, according to the mathematician Hadanard the inverse problem of solving Θ(𝑥) = 𝑚 is ‘well-posed’ if it satisfies the following conditions: (a) solution exists for any 𝑚; (b) the solution is unique; and (c) the inverse mapping 𝑚 ↦ 𝑥 is continuous. If any of these conditions are not met, then the inverse problem is said to be ‘ill-posed’ (Hall and Horowitz; 2005).
vi For the construction of the transition matrixes the integrated ‘R’-‘markovchain’ package has been applied. For
details please see https://cran.r-project.org/web/packages/markovchain/index.html access date 15/03/2017.
vii Financial centres of State 2 have a 22% probability of converging with the financial centres of State 1, whereas,
there is an 18% probability to move to a higher state (State 3) and diverge from the rest of the group. In contrast, financial centres of State 3 have a 42% probability of moving to State 2 over the examined period, signifying a convergence tendency.
viii We employed a local constant estimator and a cross-validated bandwidth selection using the method described
by Hurvich et al., (1998). We also used the ‘R’- ‘np’ package (Hayfield and Racine, 2008).
ix INFR has a reverse effect on WGGDPPC for a very high score (more than 6). After that threshold it appears to
reduce GGDPPC and instead increase WGGDPPC.