Kinetics of HIV-1 Latency Reversal Quantified on the Single-Cell Level
Using a Novel Flow-Based Technique
G. Martrus,aA. Niehrs,aR. Cornelis,aA. Rechtien,a,bW. García-Beltran,cM. Lütgehetmann,dC. Hoffmann,e,fM. Altfelda
Department of Virus Immunology, Heinrich Pette Institute, Leibniz Institute for Experimental Virology, Hamburg, Germanya; University Medical Center Hamburg-Eppendorf, 1st Department of Medicine, Hamburg, Germanyb; Ragon Institute of MGH, MIT, and Harvard, Cambridge, Massachusetts, USAc; Department of Microbiology, Virology and Hygiene, University Medical Center Hamburg-Eppendorf (UKE), Hamburg, Germanyd; ICH Study Center, Hamburg, Germanye; Department of Medicine II, University of Schleswig-Holstein, Campus Kiel, Kiel, Germanyf
ABSTRACT
HIV-1 establishes a pool of latently infected cells early following infection. New therapeutic approaches aiming at diminishing
this persisting reservoir by reactivation of latently infected cells are currently being developed and tested. However, the
reactiva-tion kinetics of viral mRNA and viral protein producreactiva-tion, and their respective consequences for phenotypical changes in infected
cells that might enable immune recognition, remain poorly understood. We adapted a novel approach to assess the dynamics of
HIV-1 mRNA and protein expression in latently and newly infected cells on the single-cell level by flow cytometry. This
tech-nique allowed the simultaneous detection of
gagpol
mRNA, intracellular p24 Gag protein, and cell surface markers. Following
stimulation of latently HIV-1-infected J89 cells with human tumor necrosis factor alpha (hTNF-
␣
)/romidepsin (RMD) or HIV-1
infection of primary CD4
ⴙT cells, four cell populations were detected according to their expression levels of viral mRNA and
protein.
gagpol
mRNA in J89 cells was quantifiable for the first time 3 h after stimulation with hTNF-
␣
and 12 h after stimulation
with RMD, while p24 Gag protein was detected for the first time after 18 h poststimulation. HIV-1-infected primary CD4
ⴙT cells
downregulated CD4, BST-2, and HLA class I expression at early stages of infection, proceeding Gag protein detection. In
conclu-sion, here we describe a novel approach allowing quantification of the kinetics of HIV-1 mRNA and protein synthesis on the
sin-gle-cell level and phenotypic characterization of HIV-1-infected cells at different stages of the viral life cycle.
IMPORTANCE
Early after infection, HIV-1 establishes a pool of latently infected cells, which hide from the immune system. Latency reversal
and immune-mediated elimination of these latently infected cells are some of the goals of current HIV-1 cure approaches;
how-ever, little is known about the HIV-1 reactivation kinetics following stimulation with latency-reversing agents. Here we describe
a novel approach allowing for the first time quantification of the kinetics of HIV-1 mRNA and protein synthesis after latency
reactivation or
de novo
infection on the single-cell level using flow cytometry. This new technique furthermore enabled the
phe-notypic characterization of latently infected and
de novo
-infected cells dependent on the presence of viral RNA or protein.
O
ne major obstacle toward an effective human
immunodefi-ciency virus type 1 (HIV-1) cure is the establishment of a pool
of long-lived latently infected cells early after infection (
1
). Using
the rhesus macaque model of simian immunodeficiency virus
(SIV) infection, it was recently shown that latent reservoirs could
be seeded as early as 3 days after SIV exposure and before the
detection of viremia in blood (
2
). The vast majority of cells
in-fected with HIV-1 will die as a consequence of the infection or will
be eliminated by the immune system. A minority of infected cells,
however, turns into latently infected resting cells. These cells can
either be reactivated and release
de novo
HIV-1 particles (
3
) or
persist and homeostatically proliferate as long-lived memory T
cells (
4
,
5
). While current antiretroviral treatments (ARTs) can
efficiently suppress HIV-1 replication and have dramatically
im-proved the life expectancy and life quality of infected individuals,
ART cannot eradicate the latent viral reservoir.
Several different biological processes have been described to
maintain latency in HIV-1-infected cells. Host transcription
fac-tors (TFs) such as nuclear factor kappa light-chain enhancer of
activated B cells (NF-
B) have multiple binding sites in the 5
=
long
terminal repeat (LTR) of the HIV-1 genome, and their binding has
been demonstrated to be necessary to initiate HIV-1 transcription
(
6
). Sequestration of these TFs in the cytoplasm is one of the
mechanisms enabling viral latency (
7
). Another described HIV-1
latency mechanism involves histone deacetylase
(HDAC)-medi-ated epigenetic silencing (
8
). During latency establishment,
HDAC molecules are recruited toward the 5
=
LTR of HIV-1 (
9
,
10
)
and therefore maintain the LTR in a repressed state (
11
). Several
HDAC inhibitors (HDACis) targeting HDAC molecules have
been tested for their ability to reactivate latently HIV-1-infected
cells, including vorinostat, panobinostat, entinostat, and
ro-midepsin (RMD). These HDACis proved to efficiently induce
HIV-1 expression in latently infected resting CD4
⫹T cells from
HIV-1-infected individuals (
8
,
12
,
13
). RMD, a drug that has
been used for the treatment of peripheral T-cell lymphoma,
Received20 July 2016 Accepted21 July 2016
Accepted manuscript posted online27 July 2016
CitationMartrus G, Niehrs A, Cornelis R, Rechtien A, García-Beltran W,
Lütgehetmann M, Hoffmann C, Altfeld M. 2016. Kinetics of HIV-1 latency reversal quantified on the single-cell level using a novel flow-based technique. J Virol
90:9018 –9028.doi:10.1128/JVI.01448-16.
Editor:G. Silvestri, Emory University
Address correspondence to M. Altfeld, [email protected].
Copyright © 2016, American Society for Microbiology. All Rights Reserved.
on November 7, 2019 by guest
http://jvi.asm.org/
was also shown to be an effective HIV-1 latency reversal drug
in
vivo
by mediating histone H3 acetylation through the
inhibi-tion of HDACs (
14–16
). Cytokines also play a role in HIV-1
latency reactivation. Specifically, human tumor necrosis factor
alpha (hTNF-
␣
), a proinflammatory cytokine, has been
de-scribed as an activator of latently HIV-1-infected cells (
17
) by
enhancing NF-
B translocation toward the nucleus and
bind-ing to the HIV-1 LTR, resultbind-ing in new rounds of HIV-1
repli-cation (
18–20
).
Although HIV-1 latency reactivation has been extensively
studied (
1
), several important aspects remain unknown, including
the kinetics and extent of viral mRNA and viral protein
produc-tion following reactivaproduc-tion on the single-cell level. Currently,
sev-eral assays are being used to measure and quantify viral reservoirs
and HIV-1 reactivation, including digital-droplet PCR (
21
), the
Tat/Rev-induced limiting-dilution assay (TILDA) (
22
), and viral
outgrowth assays (
23
). While these assays have shown good
sen-sitivity, one limiting factor is the lack of phenotypic
characteriza-tion of cells that reactivate HIV-1 replicacharacteriza-tion. In contrast to those
methods, flow cytometry allows staining for surface markers and
intracellular molecules at the single-cell level. Here we describe a
novel flow cytometry-based technique used to quantify and
dif-ferentiate between HIV-1-infected cell populations producing
only viral mRNA, viral mRNA and proteins, and viral proteins
alone. This assay furthermore allowed the quantification of HIV-1
reactivation kinetics in latently infected cells and their
conse-quences for surface molecule expression.
MATERIALS AND METHODS
Cell lines and reagents.MT-4 cells (a lymphocytic laboratory-stable cell line) and J-Lat full-length cells (clone 10.6) were obtained through the
NIH AIDS Research and Reference Reagent Program (24–26). The J89 cell
line (a Jurkat cell line infected with HIV-1) was a kind gift from David N.
Levy (27). J89 and J-Lat cells (28) were maintained in RPMI 1640L
-glu-tamine medium (Gibco, Carlsbad, CA, USA) supplemented with 10% heat-inactivated Superior fetal bovine serum (FBS) (Biochrom, Berlin, Germany). HEK 293T cells were obtained from the American Type Cul-ture Collection (ATCC) (Manassas, VA, USA) and were grown with Dul-becco’s modified Eagle medium (DMEM) (Sigma-Aldrich, Munich, Ger-many) supplemented with 10% heat-inactivated FBS.
Recombinant hTNF-␣(Peprotech, Rocky Hill, NJ, USA) was
pre-pared at a final concentration of 10g/ml according to the manufacturer’s
instructions. RMD (Selleck Chemicals, USA) was diluted at a concentra-tion of 1 mM, and the final concentraconcentra-tion used in cell cultures was 5 nM. AMD3100 octahydrochloride hydrate (Sigma-Aldrich, Munich,
Ger-many) was used at final concentrations of 20g/ml and 100g/ml, as
indicated.
The following purified antibodies were used for cell line-based stain-ing and/or blockstain-ing assays: anti-CD3 phycoerythrin (PE)-CF594 (clone UCHT1; BD Horizon), anti-CD4 BV711 (clone RPA-T4; BioLegend), pan-HLA-I complex Pacific Blue (clone W6/32; BioLegend), anti-BST-2 PE (clone RS38E; BioLegend), and anti-HIV-1 core antigen in PE and fluorescein isothiocyanate (FITC) (clone KC57; Beckman Coulter).
Healthy cohort PBMCs and CD4ⴙT cells.Peripheral blood mono-nuclear cells (PBMCs) were obtained from the blood of healthy donors from the Healthy Cohort Hansestadt Hamburg (HCHH), approved by the Ethical Committee of the Universitätsklinikum Hamburg-Eppendorf. PBMC purification was performed by using Biocoll (Biochrom, Berlin, Germany), and PBMCs were maintained in R10 medium (RPMI plus 10% heat-inactivated FBS).
CD4⫹T cells from healthy donors were isolated by using the EasySep
human CD4⫹T-cell enrichment kit (Stemcell, Cologne, Germany)
ac-cording to the manufacturer’s instructions. CD4⫹T cells were counted
and prepared in R10 medium at a final concentration of 1⫻106cells/ml.
CD4⫹T cells were stimulated with Dynabeads Human T-Activator CD3/
CD28 (Thermo Fisher Scientific, Carlsbad, CA, USA) and 100 U/ml of interleukin-2 (IL-2) (Peprotech, Rocky Hill, NJ, USA) and maintained for
3 days at 37°C in 5% CO2.
HIV-1 stock production.An HIV-1 NL4-3 plasmid (pNL4-3) was obtained through the NIH AIDS Reagent Program, Division of AIDS,
NIAID, NIH, from Malcolm Martin (29). HIV-1 NL4-3 strains were
pro-duced by transfecting HEK293T cells with 20g of pNL4-3 with
Lipo-fectamine 2000 (Thermo Fisher Scientific, Carlsbad, CA, USA) according to the manufacturer’s recommendations. The first viral stock was col-lected at 72 h posttransfection and used to infect MT-4 cells. The final viral stock was recovered by centrifugation at 96 h postinfection from the su-pernatant of MT-4 cells, filtered, and aliquoted. Virus titration allowing
the calculation of the tissue culture dose for 50% infectivity (TCID50) per
milliliter of virus stock was performed in MT-4 cells according to a
pre-viously described protocol (30).
CD4ⴙT-cell infection.CD4⫹T cells were infected with the HIV-1 stock at a multiplicity of infection (MOI) of 0.02. Briefly, cell pellets were
spinoculated at 1,200⫻gfor 2 h at 37°C together with the appropriate
amount of the HIV-1 stock. After 2 h, cells were resuspended at a final
concentration of 1⫻106cells/ml in RPMI medium supplemented with
10% FBS plus 100 U/ml of IL-2. Infected CD4⫹T cells were left for 72 h in
an incubator at 37°C. Uninfected controls were spinoculated with me-dium only and later treated identically to the infected samples.
J89/J-Lat cell reactivation.J89 and J-Lat cells were prepared at a final
concentration of 1⫻106cells/ml in RPMI medium supplemented with
10% FBS, and 2.5 ml of cells was seeded per well of a 6-well plate. At 1 h 30 min, 3 h, 6 h, 12 h, 18 h, 24 h, 36 h, and 48 h, cells were stimulated with
hTNF-␣or RMD at final concentrations of 10 ng/ml and 5 nM,
respec-tively.
PrimeFlow RNA assay.The PrimeFlow RNA assay (Affymetrix Inc.) was performed according to the manufacturer’s recommendations, in-cluding minor modifications, and used the branched-DNA technology to amplify the signal from the respective mRNA of interest. Cells of interest were centrifuged, and the respective supernatant was cryopreserved for subsequent analysis of virus production. As a modification from the orig-inal manufacturer’s protocol, incubation of the PBMC samples with the RNA probes was done for 3 h instead of 2 h at 40°C, and subsequent incubations with Pre-Amp, Amp, and the label probes were done for 2 h instead of 1 h 30 min, as longer incubations increased the mRNA signal.
Finally, cells were washed twice, resuspended in 200l of storage buffer,
and analyzed by using a BD LSRFortessa instrument. A p24 Gag enzyme-linked immunosorbent assay (ELISA) to quantify HIV-1 p24 antigen lev-els in the cell culture supernatants was performed according to the man-ufacturer’s recommendations (GeneScreen HIV-1 Ag assay; Bio-Rad).
The cytotoxicity of RMD (5 nM) and hTNF-␣(10 ng/ml) was assessed in
Jurkat cells at 48 h and 36 h poststimulation. Staining for live/dead cells was performed by using ZombieAqua (BioLegend, Germany) and showed
no toxicity for hTNF-␣and minimal cytotoxicity for RMD (⬍7%).
Real-time PCR.In addition, HIV-1 cellular mRNA was quantified via real-time PCR. Briefly, HIV-1 mRNA was extracted from J89 cells by using the High Pure RNA isolation kit (Roche Diagnostics, Germany). HIV RNA and glyceraldehyde-3-phosphate dehydrogenase (GAPDH) ex-pression levels were analyzed by using the LightCycler480 II system (Roche, Mannheim, Germany). For HIV-1 RNA detection, the Artus HI Virus-1 Rotor-Gene reverse transcription-PCR (RT-PCR) kit (Qiagen, Hilden, Germany) was used according to the manufacturer’s recommen-dations, with minor modifications. GAPDH expression was analyzed by using QuantiFast one-step RT-PCR for detection of viral RNA and an
internal control (QuantiFast pathogen RT-PCR⫹IC kit; Qiagen) and the
primer-and-probe set for GAPDH (TaqMan Gene Expression assay Hs99999905_m1; Life Technologies, Carlsbad, CA) according to the
man-ufacturer’s recommendations, using 5l of a 1:1,000 dilution of “dilution
buffer” eluant (Qiagen, Hilden, Germany). In parallel, the same samples
on November 7, 2019 by guest
http://jvi.asm.org/
were processed, and a PrimeFlow assay was performed to correlate both measurements.
Blocking of reinfection of J89 cells.In order to test whether the single p24 protein-positive population observed by using the PrimeFlow RNA
assay on reactivated J89 cells was due tode novoinfection of J89 cells,
blocking-of-reinfection experiments were performed. At the same time
point at which J89 cells were reactivated with hTNF-␣ (10 ng/ml),
AMD3100, a drug that inhibits the CXCR4-viral protein interaction and
therefore blocks HIV-1 entry (31), was added to the cell culture at two
different final concentrations: 20g/ml and 100g/ml. Subsequently, a
PrimeFlow RNA assay was performed as described above.
H3K9 acetylation status.J89 cells were stimulated for 24 h, and a PrimeFlow RNA assay was performed as described above. For Western blot analysis, viral mRNA/p24 protein-double-negative and -double-pos-itive J89 cells were sorted on a FACS-Fusion instrument. Proteins were extracted by using cell extraction buffer (Life Technologies, Germany). The samples were loaded onto an SDS-PAGE gel (4 to 12% gel) and transferred onto a polyvinylidene difluoride (PVDF) membrane. The membranes were blocked with 5% low-fat dried milk in Tris-buffered saline for 1 h and incubated overnight with primary antibodies, including anti-histone H3 (acetyl K9) antibody (Abcam, Germany) and histone 3 primary antibody (Cell Signaling Technologies, Germany). The corre-sponding secondary antibody was added, and the signal was developed by using the SuperSignal West Femto Maximum Sensitivity substrate (Life Technologies, Germany).
Analysis and statistics.All flow cytometry data were analyzed with FlowJo software (v10.1), and statistical analyses were performed by using GraphPad Prism (v5).
RESULTS
Simultaneous quantification of viral mRNA and proteins
fol-lowing HIV-1 latency reversal.
In order to quantify viral
reacti-vation of latently HIV-1-infected cells, we initially used the J89 cell
line containing a single, integrated, transcriptionally silenced copy
of the full HIV-1 genome (
27
). The integrated provirus contains
the gene for enhanced green fluorescent protein (EGFP) cloned
downstream of
nef
that can be used as a marker for HIV-1
expres-sion upon stimulation of the LTR. The J89 cell line was selectively
subcloned from a pool of HIV-1 89ENG-infected Jurkat cells to
identify a cell line with a low basal level of EGFP expression (
27
).
In order to visualize different stages of HIV-1 reactivation from
mRNA expression to virus production, viral replication in J89
cells was reactivated with two different stimuli, hTNF-
␣
and the
HDACi RMD. J89 cells were stimulated over time periods ranging
from 1 h 30 min to 36 h (for RMD) and from 1 h 30 min to 48 h
(for hTNF-
␣
) (
Fig. 1
). Using a flow cytometry-based assay
allow-ing combined stainallow-ing of intracellular mRNAs and proteins
(PrimeFlow RNA assay), HIV-1 p24
gagpol
mRNA, intracellular
p24 Gag protein, and cell surface protein levels were
simultane-ously quantified on the single-cell level. The mRNA of interest was
targeted by a set of probes against
gag-pol
areas and was stained by
using Alexa Fluor 750. Unstimulated cells (0 h) were used as a
control for HIV-1 baseline replication in J89 cells.
Following 3 h of stimulation of J89 cells with 10 ng/ml
hTNF-
␣
, a small population of
gagpol
mRNA-single-positive cells
(1.7%) was detectable by flow cytometry, which increased over
time to up to 27.4% at 18 h. At 18 h, the viral mRNA-positive
(mRNA
⫹) cell population shifted toward a population of cells that
was simultaneously expressing
gagpol
mRNA and p24 Gag protein
(5.2%) (
Fig. 2A
and
B
). This viral mRNA/protein-double-positive
population further expanded over time. At the last time point, at
48 h poststimulation, the percentage of viral
mRNA-single-posi-tive cells decreased to
⬍
3% within the J89 population, indicating
that the first stages of HIV-1 reactivation were completed. The
viral mRNA/protein-double-negative population representing
J89 cells that did not reactivate HIV-1 in response to hTNF-
␣
was
on average
⬍
15% of the total population at that time point (
Fig.
2A
and
B
).
Compared to hTNF-
␣
treatment, stimulation of J89 cells with
RMD resulted in a slow induction of HIV-1 mRNA production,
and at 12 h poststimulation, only 4.4% of J89 cells were positive
for
gagpol
mRNA (
Fig. 3A
and
B
). The proportion of viral
mRNA-single-positive cells quickly increased subsequently to 25.2% at 18
h poststimulation. At this time point, as also observed for hTNF-
␣
stimulation, the viral mRNA/protein-double-positive cell
popu-lation became apparent (4.9%) (
Fig. 3A
and
B
). RMD induction of
HIV-1 replication in J89 cells reached its peak at 36 h
poststimu-lation, with 50% viral mRNA/protein-double-positive J89 cells;
however, even at this time,
⬃
40% of J89 cells did not reactivate
HIV-1 (
Fig. 3B
). RMD stimulation resulted in significant cell
tox-icity at later time points, not allowing an assessment at later time
points following stimulation (data not shown). RMD has been
shown to affect the acetylation status of H3K9 in treated cells
(
32
,
33
). Indeed, RMD treatment resulted in acetylated H3K9
(H3K9ac) upregulation at 24 h poststimulation in
double-nega-tive cells compared to unstimulated J89 cells, which was increased
in cells that reactivated HIV-1 (
Fig. 4
). These results suggested that
RMD affected the H3K9 acetylation status of J89 cells and, to a
greater extent, in cells that were producing HIV-1.
Both RMD and hTNF-
␣
stimulation of J89 cells also resulted in
the production of novel HIV-1 particles detectable in the cell
cul-ture supernatant by a p24 Gag ELISA. The amount of p24 Gag in
the supernatant increased exponentially after 18 h of stimulation
FIG 1Outline of reactivation assay to determine HIV-1 latency reversal kinetics. J89 cells were stimulated either with hTNF-␣(10 ng/ml) at time points ranging from 1 h 30 min to 48 h or with RMD (5 nM) at time points ranging from 1 h 30 min to 36 h. As a control, unstimulated cells were used. The expression levels of viral mRNA, viral protein, and cell surface markers were quantified by using the PrimeFlow RNA assay.
on November 7, 2019 by guest
http://jvi.asm.org/
[image:3.585.96.493.73.169.2]0h
1h30 3h 6h 12 h
18h 24h 36h 48h
0 20 40 60 80 100 mRNA-prot- mRNA+prot-mRNA+prot+
time after stimulation (hrs)
%
o
f J89 cel
ls
A
B
C
D
E
mR NA -pro t-mR NA +pro t-mR NA +pro t+ 0.0 0.2 0.4 0.6 0.8 1.0 * * CD4 M F I r e la ti v e t o m RNA -p rot-0 100 200 300
0 20 40 60 80
R square = 0.94 P value = 0.001
0hrs 6hrs 12hrs 18hrs 24hrs 48hrs
viral mRNA RT-PCR (relative to mRNA GAPDH)
v ir a l m R N A P r im e F lo w R N A A s s a y ( % ) 0h 1h30 3h
6h 12h
18h 24h 36h 48h
102 103 104 105 106 107
time after stimulation (hrs)
p2 4 a nt ig e n ( pg /m l) 0,42 0,42 0,37 98,8 0
-103 103 104 105 0 -103 103 104 105 0,80 0,75 0,22 98,2 0
-103 103 104 105 0 -103 103 104 105 2,16 0,59 0,20 97,0 0
-103 103 104 105 0 -103 103 104 105 9,38 0,40 0,10 90,1 0
-103 103 104 105 0 -103 103 104 105 22,1 0,81 0,13 76,9 0
-103 103 104 105 0 -103 103 104 105 31,0 3,91 0,41 64,7 0
-103 103 104 105 0 -103 103 104 105 32,7 8,88 0,73 57,7 0
-103 103 104 105 0 -103 103 104 105 11,1 49,2 5,79 33,9 0
-103 103 104 105 0 -103 103 104 105 2,97 80,0 5,63 11,4 0
-103 103 104 105 0
-103 103 104 105
p24 protein p24 protein p24 protein
p24 protein p24 protein p24 protein
p24 protein p24 protein
HIV-1 probe HIV-1 probe HIV-1 probe
HIV-1 probe HIV-1 probe HIV-1 probe
HIV-1 probe HIV-1 probe
0hrs 1hr30 3hrs
6hrs 12hrs 18hrs
24hrs 36hrs
p24 protein
HIV-1 probe
48hrs
on November 7, 2019 by guest
http://jvi.asm.org/
until the experiment endpoint at 48 h (
Fig. 2C
and
3C
), matching
the presence of p24 Gag-positive cells observed with the
Prime-Flow RNA assay and suggesting a fast release of virus.
Further-more, the amount of cellular viral mRNA quantified by real-time
PCR strongly correlated with the amount of viral cellular mRNA
measurable by PrimeFlow RNA assay (
R
2of 0.94 and
P
value of
⬍
0.005 for hTNF-
␣
;
R
2of 0.99 and
P
value of
⬍
0.001 for RMD),
demonstrating that both techniques were comparable in the
mea-surement of viral mRNA levels (
Fig. 2D
and
3D
).
Of note, a fourth population of J89 cells expressing only p24
Gag protein was detectable at late stages (starting at 24 h)
follow-ing reactivation with hTNF-
␣
and RMD (
Fig. 2A
and
3A
). To test
whether the appearance of this fourth population that was positive
only for HIV-1 p24 Gag protein was due to newly incoming p24
Gag resulting from reinfection of J89 cells that did not reactivate
viral replication, or, rather, late stages of HIV-1 production
with-out detectable viral mRNA, we performed a reinfection-blocking
experiment. AMD3100, a CXCR4 antagonist that competes with
HIV-1 for infection (
31
), was added to J89 cells simultaneously
with hTNF-
␣
stimulation during 24 h, and a PrimeFlow RNA
assay was performed. The addition of AMD3100 did not reduce
the proportion of the viral protein-single-positive population
(
Fig. 5A
), suggesting that this population was not the result of
incoming p24 Gag protein due to
de novo
infection. To confirm
this result, a second set of experiments was performed by using
J-Lat cells. J-Lat cells are Jurkat cells infected with a full-length
HIV-1 genome bearing a frameshift in
env
and therefore
produc-ing incomplete viral particles that cannot infect new cells (
28
).
These cells were stimulated for 24 h and 48 h as described above
for J89 cells. As shown in
Fig. 5B
, stimulation with hTNF-
␣
or
RMD induced an accumulation of p24 Gag
protein-single-posi-tive J-Lat cells, further demonstrating that this population was not
due to reinfection but rather was the result of late stages of viral
reactivation when viral RNA had already disappeared.
Assessment of the impact of HIV-1 latency reversal on cell
surface marker expression.
As the PrimeFlow RNA assay also
allows the detection of cell surface markers, CD4 expression levels
on J89 cells following HIV-1 reactivation using RMD and hTNF-
␣
were measured. Twenty-four hours after stimulation with
hTNF-
␣
, CD4 expression was significantly downmodulated in the
viral mRNA/protein-double-positive cell population compared
to the double-negative population, as previously described (
P
⬍
0.05) (
27
) (
Fig. 2E
). Of note, this downmodulation was already
quantifiable and significant in the
gagpol
mRNA single-positive
population, as reflected by a 30% decrease of the CD4 mean
fluo-rescence intensity (MFI) (
P
⬍
0.05) (
Fig. 2E
). RMD treatment,
similarly to hTNF-
␣
treatment, also led to a statistically significant
decrease of CD4 expression levels on the cell surface of the
single-positive
gagpol
mRNA population compared to nonactivated cells
(
P
⬍
0.005), and this decrease was even more pronounced in the
double-positive viral mRNA/protein population (
P
⬍
0.05) (
Fig.
3E
). Taken together, the PrimeFlow RNA assay enabled the
simul-taneous assessment of viral reactivation kinetics and cell surface
expression in latently HIV-1-infected J89 cells on the single-cell
level.
Detection of HIV-1 mRNA and protein production on the
single-cell level in primary CD4
ⴙT cells following
in vitro
in-fection.
To determine whether the PrimeFlow RNA assay also
allowed the detection of HIV-1 infection in primary cells, CD4
⫹T
cells isolated from three HIV-1-negative individuals were
acti-vated with anti-CD3/28 beads and IL-2 over 3 days and infected by
using an NL4-3 virus. To detect viral mRNA and/or viral protein,
the PrimeFlow RNA assay was performed at 24 h, 48 h, and 72 h
postinfection. As shown in
Fig. 6A
, viral
gagpol
mRNA and p24
Gag protein were detectable in
in vitro
-infected cells by as early as
24 h postinfection, indicating that HIV-1 infection can be traced
in primary cells by using this method. In line with data from
pre-vious studies (
34
,
35
), HIV-1
⫹populations within CD4
⫹T cells
exhibited reduced expression levels of CD4, BST-2, and HLA class
I molecules (
Fig. 6B
and
C
). In all donors analyzed, the effect was
already present at an early stage of viral replication (single-positive
gagpol
mRNA
⫹populations) and increased in viral
mRNA/pro-tein-double-positive populations (
Fig. 6A
). The analysis of CD4
expression levels at the surface of infected cells allowed the
differ-entiation of three different populations of CD4
⫹T cells (CD4
neg,
CD4
dim, and CD4
bright) at day 3 postinfection, as depicted in
Fig.
6B
. As expected, the amount of CD4 surface expression declined
as viral mRNA/protein production increased, and HIV-1
replica-tion (measured by viral mRNA and protein producreplica-tion) was
tak-ing place almost exclusively within the CD4
negpopulation (
Fig. 6C
and
D
). In contrast, no viral RNA or protein was detectable in the
CD4
brightpopulation, and viral mRNA and protein expression
patterns differed significantly between CD4
neg, CD4
dim, and
CD4
brightT-cell populations (
Fig. 6C
and
D
). Similarly,
assess-ment of HLA class I and BST-2 expression levels on the surface of
HIV-1-infected CD4
⫹T cells also revealed the presence of distinct
populations (
Fig. 6B
and
C
). This resulted in statistically different
viral mRNA/protein expression levels between the different
pop-ulations based on either HLA class I expression or BST-2
expres-sion (
Fig. 6D
).
Taken together, these data demonstrate that the use of the
PrimeFlow RNA assay enables the evaluation of HIV-1 mRNA
and protein production on the single-cell level in primary CD4
⫹T
cells infected with HIV-1 and the differentiation of surface protein
expression between cells expressing HIV-1 proteins and cells
ex-pressing only HIV-1 mRNA.
FIG 2hTNF-␣stimulation of J89 cells. J89 cells were activated with hTNF-␣(10 ng/ml) at time points ranging from 1 h 30 min to 48 h. A PrimeFlow RNA assay was performed at the indicated time points following stimulation. (A) Representative data showing the kinetics of the viral mRNA-single-positive population, the viral mRNA/protein-double-positive population, and the viral protein-single-positive population. (B) Data from three independent replicates show that the double-negative population decreased over stimulation time, while at 3 h, the viral mRNA single-positive population started to be detectable, reaching its peak at 18 h poststimulation and decreasing to almost undetectable levels by 48 h poststimulation. The viral mRNA/protein-double-positive population was first detectable at 12 h poststimulation and increased up to maximum levels of 80% (as a median) at 48 h poststimulation. (C) Measurement of p24 antigen levels in stimulated J89 cell supernatants with a p24 ELISA (Bio-Rad). Unstimulated cells were used as a background control (0 h). Experiments were performed in
triplicates, and the horizontal bars are representative of medians⫾standard deviations. (D) Parallel measurement of viral mRNA levels by real-time PCR and a
PrimeFlow RNA assay on stimulated J89 cells at the indicated time points showed a statistically significant correlation (R2⫽0.94;P⬍0.005). (E) CD4 expression in J89
cells was measured at 24 h poststimulation (n⫽3), after hTNF-␣treatment (10 ng/ml). Data evaluated with a Wilcoxon signed-rank test indicated that CD4 levels were
already downregulated at the viral mRNA⫹stage (P⬍0.05), and CD4 downregulation increased with increasing viral protein production (P⬍0.05).
on November 7, 2019 by guest
http://jvi.asm.org/
0,74 0,24
0,26 98,8
0
-103 103 104 105 0
-103 103 104
105 0,52 0,24
0,33 98,9
0
-103 103 104 105 0
-103 103 104
105 0,80 0,30
0,23 98,7
0
-103 103 104 105 0 -103 103 104 105 1,48 0,45 0,16 97,9 0
-103 103 104 105 0 -103 103 104 105 4,10 0,91 0,11 94,9 0
-103 103 104 105 0 -103 103 104 105 20,4 3,76 0,081 75,8 0
-103 103 104 105 0 -103 103 104 105 26,6 22,1 0,88 50,4 0
-103 103 104 105 0
-103 103 104
105 3,46 38,1
2,65 55,8
0
-103 103 104 105 0
-103 103 104 105
p24 protein p24 protein p24 protein
p24 protein p24 protein p24 protein
p24 protein p24 protein
HIV-1 probe HIV-1 probe HIV-1 probe
HIV-1 probe HIV-1 probe HIV-1 probe
HIV-1 probe HIV-1 probe
p24 protein
HIV-1 probe
0 50 100 150 200 250 0 20 40 60 0hrs 12hrs 18hrs 24hrs 36hrs
R square = 0.99 P value < 0.001
v iral mRNA RT-PCR (re lativ e to mRNA GAPDH)
v ir a l m R N A P ri m e F lo w RNA As s a y ( % ) mRN A-p ro t-mRN A+pr ot-mR NA +prot + 0.0 0.2 0.4 0.6 0.8 1.0 * * C D 4 M F I r e la ti v e to m R N A -p ro t-0h
1h30 3h 6h 12 h
18h 24h 36h
0 20 40 60 80 100 mRNA-prot- mRNA+prot-mRNA+prot+
time after stimulation (hrs)
%
o
f J89 cel
ls
0h
1h30 3h 6h 12 h
18h 24h 36h
1000 10000 100000 1000000
time after stimulation (hrs)
p2 4 a n ti g e n ( p g /m l)
0hrs 1hr30 3hrs
6hrs 12hrs 18hrs
24hrs 36hrs non-infected Jurkats
A
B
C
D
E
Q1 0,039 Q2 1,26E-3 Q3 0,25 Q4 99,7 0-103 103 104 105 0
-103 103 104 105
on November 7, 2019 by guest
http://jvi.asm.org/
DISCUSSION
Current treatment approaches cannot eradicate HIV-1 infection,
and a persistent pool of latently HIV-1-infected cells provides a
permanent source of viremia, representing a major obstacle to
HIV-1 cure attempts. Here we describe a novel approach based on
fluorescence
in situ
hybridization to quantify HIV-1 reactivation
kinetics on the single-cell level by flow cytometry, enabling the
identification of different cell populations according to their
ex-pression of viral mRNA and viral proteins and characterization of
their surface molecule expression depending on the stage of
HIV-1 reactivation. By using an HIV-1 latency cell line model,
faster kinetics of HIV-1 reactivation were observed for hTNF-
␣
than for RMD, and hTNF-
␣
also reactivated a larger subset of the
latently infected J89 cells. Fluorescence
in situ
hybridization by
flow cytometry furthermore enabled the simultaneous
character-ization of surface marker expression on latently infected cells
de-pending on viral reactivation kinetics and showed
downregula-tion of CD4 expression levels. Moreover, by using a
de novo
infection model of HIV-1 in primary CD4
⫹T cells, CD4, BST-2,
and HLA class I expressions in relation to viral replication on the
single-cell level were visualized, demonstrating early and rapid
downregulation of these surface molecules.
In recent years, new techniques have focused on quantifying
HIV-1 reservoirs and characterizing virus-producing cells (
21–
23
). Detailed studies of viral reactivation kinetics are essential for
understanding both the mechanisms of viral suppression by
anti-viral drugs and the mechanisms leading to HIV-1 reactivation in
latently infected cells (
36
). The major strength of the fluorescence
in situ
hybridization assay (PrimeFlow RNA assay) used here is the
ability to simultaneously and specifically quantify intracellular
vi-ral mRNA and protein expression levels as well as the expression
of cell surface molecules by flow cytometry on the single-cell level.
This approach allowed the distinction of cells expressing only viral
mRNA from cells producing viral proteins following HIV-1
la-tency reversal and the consequences for cell surface molecule
ex-pression. Similarly, by using an
in vitro
model in which primary
CD4
⫹T cells from healthy donors were infected with HIV-1,
fluorescence
in situ
hybridization enabled the distinction and
fur-ther characterization of viral mRNA- and protein-expressing cell
populations.
By analyzing the HIV-1 reactivation kinetics in J89 cells, we
observed that hTNF-
␣
acted faster than RMD in inducing HIV-1
mRNA expression. Moreover, and in line with previously
re-ported results, RMD exhibited higher toxicity than hTNF-
␣
(
37
).
Interestingly, hTNF-
␣
induced HIV-1 latency reactivation in J89
cells more efficiently than did RMD. The distinct mechanisms of
action between hTNF-
␣
and RMD might account for the
differ-ences observed in the kinetics and extent of HIV-1 latency
reacti-vation in J89 cells. hTNF-
␣
acts by triggering intracellular signals
that stabilize the NF-
B transcription factor, allowing nucleus
translocation. Once in the nucleus, NF-
B can bind to the HIV-1
LTR region and promote HIV-1 transcription (
38
,
39
). In
con-trast, the RMD mechanism of action is focused on inhibiting
HDACs that repress the HIV-1 LTR and help to initiate viral
tran-scription (
15
). The ability to measure and quantify HIV-1
reacti-vation kinetics on the single-cell level will be critical not only for
the evaluation of latency-reversing drugs but also for
understand-ing the mechanisms by which these drugs act.
Fluorescence
in situ
hybridization by flow cytometry provided
the ability to quantify the levels of viral mRNA and protein
pro-duction simultaneously with cell surface marker expression on
latency cell models and infected primary cells. During HIV-1
in-fection, CD4, the main entry receptor for HIV-1, has been shown
to be downregulated by the viral Nef, Vpu, and gp120 envelope
proteins (
40
,
41
). CD4 downregulation enhances viral replication,
potentially by protecting virus-producing cells from cytotoxicity
related to superinfection events (
39
). As described previously by
Kutsch et al. (
27
), treatment of J89 cells with hTNF-
␣
led to the
downregulation of the CD4 receptor at the cell surface at the stage
of viral protein production. Furthermore, hTNF-
␣
and RMD
treatment already induced CD4 downmodulation in the
gagpol
mRNA-single-positive population before the detection of p24 Gag
FIG 3RMD stimulation of J89 cells. J89 cells were activated with RMD (5 nM) at time points ranging from 1 h 30 min to 36 h. A PrimeFlow RNA assay was performed at the indicated time points following stimulation. (A) Representative data showing the kinetics of the viral mRNA-single-positive population, the viral mRNA/protein-double-positive population, and the viral protein-single-positive population. (B) Analysis of viral mRNA and viral protein production over time in J89 cells stimulated with RMD (5 nM) in three independent replicates. The double-negative population decreased over time with stimulation, while at 6 h, the single-positive viral mRNA population already started to be detectable, reaching its peak at 18 h to 24 h poststimulation and decreasing by 36 h poststimulation. The viral mRNA/protein-double-positive population was first measurable at 12 h poststimulation and increased up to maximum levels of 56% (as a mean) at 36 h poststimulation. Uninfected Jurkat cells were included as a control. (C) Measurement of p24 antigen levels in supernatants of stimulated J89 cells with a p24 ELISA (Bio-Rad). Unstimulated cells were used as a background control (0 h). Experiments were performed in triplicates, and the horizontal bars
are representative of medians⫾standard deviations. (D) Parallel measurement of viral mRNA by real-time PCR and a PrimeFlow RNA assay on stimulated J89
cells at the indicated time points showed a statistically significant correlation (R2⫽0.99;P⬍0.001). (E) CD4 expression in J89 cells was measured at 24 h
poststimulation (n⫽3), after RMD treatment (5 nM). Data evaluated with a Wilcoxon signed-rank test indicated that CD4 levels were already downregulated
at the viral mRNA⫹stage (P⬍0.005), and CD4 downregulation increased with increasing viral protein production (P⬍0.05).
0hrs mRNA
-p24-H3K9ac
H3
17kDa
3
1
Median intensity
H3K9ac/H3
17kDa
24hrs mRNA
-p24-24hrs mRNA+p24+
FIG 4Western blot analysis of H3K9 acetylation status upon RMD treatment. J89 cells were stimulated for 24 h with RMD (5 nM). Viral mRNA/protein-double-negative and -double-positive populations were sorted, total protein was extracted, and Western blotting targeting H3K9ac and total H3 was per-formed. Quantification was performed by using ImageQuant TL software.
on November 7, 2019 by guest
http://jvi.asm.org/
[image:7.585.44.286.71.243.2]protein, in line with the early production of Nef protein. Similarly,
in vitro
HIV-1 infection of primary CD4
⫹T cells resulted in the
downregulation of CD4, as well as BST-2 and HLA class I
mole-cules, from the cell surface as soon as
gagpol
mRNA was detectable
in infected cells. Overall, the combined quantification of levels of
intracellular viral mRNA and proteins with surface markers
al-lowed the assessment of the kinetics of changes in cell surface
markers in relation to viral replication on the single-cell level.
Further studies will need to investigate whether fluorescence
in
situ
hybridization by flow cytometry can be used to detect viral
mRNA in primary samples from HIV-1-infected individuals and
therefore measure latent reservoirs in different cell subsets after
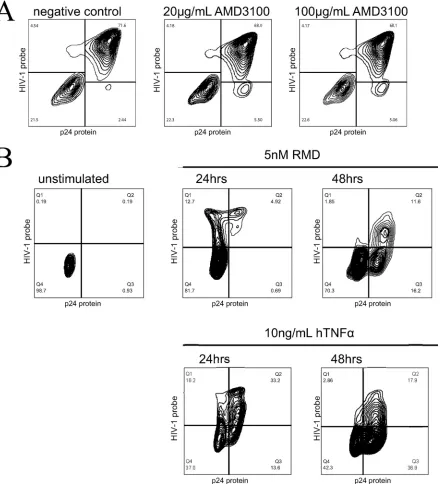
FIG 5The single-positive protein population is not the result of new rounds of HIV-1 infection. (A) hTNF-␣was used at a final concentration of 10 ng/ml to
stimulate J89 cells for 24 h simultaneously with 20g/ml AMD3100 or 100g/ml AMD3100 or without AMD3100 (negative control). A PrimeFlow RNA assay
was performed to distinguish the double-negative population, the viral mRNA-single-positive population, the viral mRNA/protein-double-positive population, and the protein-single-positive population. No blocking of the p24 protein-single-positive population was observed in the presence of the CXCR4 inhibitor
AMD3100. (B) J-Lat latency reactivation. RMD at a final concentration of 5 nM and hTNF-␣at a final concentration of 10 ng/ml were used to stimulate 2.5⫻
106J-Lat cells at two time points, 24 h and 48 h. Unstimulated cells were used as a control. A PrimeFlow RNA assay was performed as described in the text to
distinguish four populations: the double-negative population, the viral mRNA-single-positive population, the viral mRNA/protein-double-positive population, and the protein-single-positive population.
on November 7, 2019 by guest
http://jvi.asm.org/
[image:8.585.76.516.68.552.2]Q1 3,23 Q2 11,4 Q3 1,01 0
-103 103 104 105
Comp-FITC-A :: p24
103 104 105
Comp-APC-A :: probe
Q1 12,3 Q2 87,7 Q3 1,88E-3 Q4 0,020 0
-103 103 104 105 0
-103 103 104
105 Q1
2,01 Q2 1,50 Q3 1,59 Q4 94,9 0
-103 103 104 105 0
-103 103 104
105 Q1
1,87 Q2 0,77 Q3 0,81 Q4 96,6 0
-103 103 104 105 0 -103 103 104 105 Q1 7,52 Q2 92,5 Q3 0 Q4 4,47E-3 0
-103 103 104 105 0
-103 103 104
105 Q1
2,69 Q2 3,12 Q3 0,85 Q4 93,3 0
-103 103 104 105 0
-103 103 104
105 Q1
2,66 Q2 1,73 Q3 1,32 Q4 94,3 0
-103 103 104 105 0 -103 103 104 105 Q1 10,6 Q2 89,4 Q3 0 Q4 9,93E-4 0
-103 103 104 105 0
-103 103 104
105 Q1
7,18 Q2 6,12 Q3 0,63 Q4 86,1 0
-103 103 104 105 0
-103 103 104
105 Q1
1,21 Q2 0,81 Q3 1,32 Q4 96,7 0
-103 103 104 105 0 -103 103 104 105 CD4 HLA-ABC BST2 marker negative marker dim marker positive p24 protein HIV-1 probe p24 protein HIV-1 probe p24 protein HIV-1 probe p24 protein HIV-1 probe p24 protein HIV-1 probe p24 protein HIV-1 probe p24 protein HIV-1 probe p24 protein HIV-1 probe p24 protein HIV-1 probe
D
CD4 neg CD4 dim CD4 pos 0.001 0.01 0.1 1 10 100 % o f CD3 + c e ll s
HLA neg HLA dim HLA pos 0.001 0.01 0.1 1 10 100 % o f CD3 + c e ll s
BST2 neg BST2 dim BST2 pos 0.001 0.01 0.1 1 10 100
viral mRNA- viral mRNA+ p24-viral mRNA+ p24+
% o f CD3 + c e ll s CD4+ 56,1 CD4dim 32,9 CD4neg 5,98 HLA+ 57,7 HLAdim 36,6 HLAneg 6,40 BST2 + 53,4 BST2 dim 34,4 BST2 -5,67
CD4 HLA-AB BST2
B
C
mRNA-prot- mRNA+prot- mRNA+prot+ 0.1 1 10 24hrs 48hrs 72hrs % o f CD3 + c e ll s
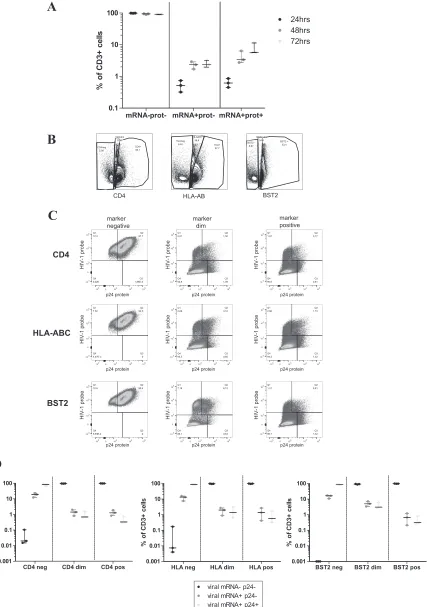
FIG 6Cell surface levels of BST-2, HLA class I, and CD4 in the mRNA-negative and protein-negative, the mRNA⫹protein-negative, and mRNA⫹
protein-positive CD4⫹T-cell populations. CD4⫹T cells isolated from three healthy donors were activated for 3 days with anti-CD3/28 beads and IL-2 (100 U/ml) and
then infected at an MOI of 0.02 with NL4-3 virus. (A) Fluorescencein situhybridization was performed at 24 h, 48 h, and 72 h postinfection to quantify levels of
viral mRNA and viral protein production (B) The expression levels of BST-2, HLA-ABC, and CD4 at 72 h post-HIV-1 infection showed the presence of three populations for each marker: negative, dim, and positive. (C) Representative plot from one donor displaying the expression levels of viral mRNA and protein in the negative, dim, and positive populations for HLA-ABC, CD4, and BST-2 at 72 h postinfection. HIV-1 replication was almost exclusively restricted to the negative populations. (D) Viral mRNA and protein expression from three independent donors at 72 h postinfection according to the above-described gating
strategy (shown inFig. 6B). All the differences calculated with a Wilcoxon signed-rank test were statistically significant (P⬍0.001).
on November 7, 2019 by guest
http://jvi.asm.org/
[image:9.585.83.510.36.643.2]reactivation. Our data indicated that the current technique will
not be sufficiently sensitive to detect the frequency of
HIV-1-in-fected cells in primary samples from HIV-1-inHIV-1-in-fected individuals
on highly active ART (HAART), in whom the frequency of
in-fected cells is much lower. However, the PrimeFlow RNA assay
allows tracing of the kinetics of HIV-1 replication using cell
mod-els and primary HIV-1-infected CD4
⫹T cells and can be used as a
tool to characterize the cell surface modifications occurring
dur-ing HIV-1 replication. One limitation of the PrimeFlow RNA
as-say is that viral mRNA is measured by a combination of primers
targeting the
gagpol
mRNA, and distinguishing between spliced
and unspliced viral mRNA is therefore not possible. To detect
spliced viral mRNA, probes would need to be designed to
specif-ically bind to the short Tat-Rev junction, such as the ones used for
TILDAs (
22
). However, the use of only two sets of primers for the
PrimeFlow RNA assay is currently not yet specific enough to
de-tect mRNA populations and therefore limits the technique to the
detection of unspliced HIV-1 RNA at this point. In conclusion,
simultaneous quantification of viral reactivation and replication
dynamics and their effects on cell surface markers on the
single-cell level is possible by using fluorescence
in situ
hybridization by
flow cytometry and represents an important novel tool to study
HIV-1 latency reversal kinetics and drug efficiency.
ACKNOWLEDGMENTS
J89 cells were kindly provided by David N. Levy (College of Dentistry, New York University, New York, NY). We acknowledge the Healthy Co-hort Hansestadt Hamburg (HCHH) from the UKE for their contribution to this study.
G.M. is supported by a GILEAD Förderprogramm Infektiologie grant. M.A. receives funding from the Deutsche Forschungsgemeinschaft (DFG), the German Center for Infection Research (DZIF), and the Leib-niz Gemeinschaft.
We have no conflicts of interest.
FUNDING INFORMATION
This work, including the efforts of G. Martrus, was funded by Gilead Förderprogramm Infektiologie. This work, including the efforts of M. Altfeld, was funded by Leibniz Gemeinschaft. This work, including the efforts of M. Altfeld, was funded by Deutsche Forschungsgemeinschaft (DFG). This work, including the efforts of M. Altfeld, was funded by Deutsches Zentrum für Infektionsforschung (DZIF).
REFERENCES
1.Deeks SG, Autran B, Berkhout B, Benkirane M, Cairns S, Chomont N, Chun T-W, Churchill M, Di Mascio M, Katlama C, Lafeuillade A, Landay A, Lederman M, Lewin SR, Maldarelli F, Margolis D, Markowitz M, Martinez-Picado J, Mullins JI, Mellors J, Moreno S, O’Doherty U, Palmer S, Penicaud M-C, Peterlin M, Poli G, Routy J-P, Rouzioux C, Silvestri G, Stevenson M, Telenti A, Van Lint C, Verdin E, Woolfrey A, Zaia J, Barré-Sinoussi F.2012. Towards an HIV cure: a global scientific strategy. Nat
Rev Immunol12:607– 614.http://dx.doi.org/10.1038/nri3262.
2.Whitney JB, Hill AL, Sanisetty S, Penaloza-MacMaster P, Liu J, Shetty M, Parenteau L, Cabral C, Shields J, Blackmore S, Smith JY, Brinkman AL, Peter LE, Mathew SI, Smith KM, Borducchi EN, Rosenbloom DIS, Lewis MG, Hattersley J, Li B, Hesselgesser J, Geleziunas R, Robb ML, Kim JH, Michael NL, Barouch DH.2014. Rapid seeding of the viral
reservoir prior to SIV viraemia in rhesus monkeys. Nature512:74 –77.
http://dx.doi.org/10.1038/nature13594.
3.Sigal A, Kim JT, Balazs AB, Dekel E, Mayo A, Milo R, Baltimore D.
2011. Cell-to-cell spread of HIV permits ongoing replication despite
antiretroviral therapy. Nature 477:95–98. http://dx.doi.org/10.1038
/nature10347.
4.Chomont N, El-Far M, Ancuta P, Trautmann L, Procopio FA, Yassine-Diab B, Boucher G, Boulassel M-R, Ghattas G, Brenchley JM, Schacker
TW, Hill BJ, Douek DC, Routy J-P, Haddad EK, Sékaly R-P.2009. HIV reservoir size and persistence are driven by T cell survival and homeostatic
proliferation. Nat Med15:893–900.http://dx.doi.org/10.1038/nm.1972.
5.Bosque A, Famiglietti M, Weyrich AS, Goulston C, Planelles V.2011. Homeostatic proliferation fails to efficiently reactivate HIV-1 latently
in-fected central memory CD4⫹T cells. PLoS Pathog7:e1002288.http://dx
.doi.org/10.1371/journal.ppat.1002288.
6.Pearson R, Kim YK, Hokello J, Lassen K, Friedman J, Tyagi M, Karn J.
2008. Epigenetic silencing of human immunodeficiency virus (HIV) tran-scription by formation of restrictive chromatin structures at the viral long terminal repeat drives the progressive entry of HIV into latency. J Virol
82:12291–12303.http://dx.doi.org/10.1128/JVI.01383-08.
7.Archin NM, Sung JM, Garrido C, Soriano-Sarabia N, Margolis DM.
2014. Eradicating HIV-1 infection: seeking to clear a persistent pathogen.
Nat Rev Microbiol12:750 –764.http://dx.doi.org/10.1038/nrmicro3352.
8.Archin NM, Bateson R, Tripathy MK, Crooks AM, Yang K-H, Dahl NP, Kearney MF, Anderson EM, Coffin JM, Strain MC, Richman DD, Robertson KR, Kashuba AD, Bosch RJ, Hazuda DJ, Kuruc JD, Eron JJ, Margolis DM.2014. HIV-1 expression within resting CD4⫹T cells after
multiple doses of vorinostat. J Infect Dis210:728 –735.http://dx.doi.org
/10.1093/infdis/jiu155.
9.Williams SA, Chen L-F, Kwon H, Ruiz-Jarabo CM, Verdin E, Greene
WC.2006. NF-kappaB p50 promotes HIV latency through HDAC
re-cruitment and repression of transcriptional initiation. EMBO J25:139 –
149.http://dx.doi.org/10.1038/sj.emboj.7600900.
10. Jiang G, Espeseth A, Hazuda DJ, Margolis DM.2007. c-Myc and Sp1 contribute to proviral latency by recruiting histone deacetylase 1 to the
human immunodeficiency virus type 1 promoter. J Virol81:10914 –
10923.http://dx.doi.org/10.1128/JVI.01208-07.
11. Keedy KS, Archin NM, Gates AT, Espeseth A, Hazuda DJ, Margolis
DM.2009. A limited group of class I histone deacetylases acts to repress
human immunodeficiency virus type 1 expression. J Virol83:4749 – 4756.
http://dx.doi.org/10.1128/JVI.02585-08.
12. Spivak AM, Bosque A, Balch AH, Smyth D, Martins L, Planelles V.
2015.Ex vivobioactivity and HIV-1 latency reversal by ingenol
diben-zoate and panobinostat in resting CD4⫹T cells from aviremic patients.
Antimicrob Agents Chemother 59:5984 –5991. http://dx.doi.org/10
.1128/AAC.01077-15.
13. Wightman F, Lu H, Solomon A, Saleh S, Harman A, Cunningham A, Gray L, Churchill M, Cameron P, Dear A, Lewin SR.2013. Entinostat is a histone deacetylase inhibitor selective for class 1 histone deacetylases and activates HIV production from latently infected primary T cells. AIDS
27:2853–2862.http://dx.doi.org/10.1097/QAD.0000000000000067.
14. Søgaard OS, Graversen ME, Leth S, Olesen R, Brinkmann CR, Nissen SK, Kjaer AS, Schleimann MH, Denton PW, Hey-Cunningham WJ, Koelsch KK, Pantaleo G, Krogsgaard K, Sommerfelt M, Fromentin R, Chomont N, Rasmussen TA, Østergaard L, Tolstrup M. 2015. The depsipeptide romidepsin reverses HIV-1 latency in vivo. PLoS Pathog
11:e1005142.http://dx.doi.org/10.1371/journal.ppat.1005142.
15. Wei DG, Chiang V, Fyne E, Balakrishnan M, Barnes T, Graupe M, Hesselgesser J, Irrinki A, Murry JP, Stepan G, Stray KM, Tsai A, Yu H, Spindler J, Kearney M, Spina CA, McMahon D, Lalezari J, Sloan D, Mellors J, Geleziunas R, Cihlar T.2014. Histone deacetylase inhibitor romidepsin induces HIV expression in CD4 T cells from patients on sup-pressive antiretroviral therapy at concentrations achieved by clinical
dos-ing. PLoS Pathog 10:e1004071. http://dx.doi.org/10.1371/journal.ppat
.1004071.
16. Saleh S, Wightman F, Ramanayake S, Alexander M, Kumar N, Khoury G, Pereira C, Purcell D, Cameron PU, Lewin SR.2011. Expression and reactivation of HIV in a chemokine induced model of HIV latency in
primary resting CD4⫹T cells. Retrovirology8:80.http://dx.doi.org/10
.1186/1742-4690-8-80.
17. Duh EJ, Maury WJ, Folks TM, Fauci AS, Rabson AB. 1989. Tumor necrosis factor alpha activates human immunodeficiency virus type 1 through induction of nuclear factor binding to the NF-kappa B sites in the
long terminal repeat. Proc Natl Acad Sci U S A86:5974 –5978.http://dx
.doi.org/10.1073/pnas.86.15.5974.
18. Griffin GE, Leung K, Folks TM, Kunkel S, Nabel GJ.1989. Activation of HIV gene expression during monocyte differentiation by induction of
NF-kB. Nature339:70 –73.http://dx.doi.org/10.1038/339070a0.
19. Okamoto T, Matsuyama T, Mori S, Hamamoto Y, Kobayashi N, Yamamoto N, Josephs SF, Wong-Staal F, Shimotohno K.1989. Aug-mentation of human immunodeficiency virus type 1 gene expression by
on November 7, 2019 by guest
http://jvi.asm.org/
tumor necrosis factor alpha. AIDS Res Hum Retroviruses5:131–138.http: //dx.doi.org/10.1089/aid.1989.5.131.
20. Cummins NW, Badley AD.2010. Mechanisms of HIV-associated
lym-phocyte apoptosis: 2010. Cell Death Dis1:e99.http://dx.doi.org/10.1038
/cddis.2010.77.
21. Henrich TJ, Gallien S, Li JZ, Pereyra F, Kuritzkes DR.2012. Low-level detection and quantitation of cellular HIV-1 DNA and 2-LTR circles using
droplet digital PCR. J Virol Methods186:68 –72. http://dx.doi.org/10
.1016/j.jviromet.2012.08.019.
22. Procopio FA, Fromentin R, Kulpa DA, Brehm JH, Bebin A-G, Strain MC, Richman DD, O’Doherty U, Palmer S, Hecht FM, Hoh R, Barnard RJO, Miller MD, Hazuda DJ, Deeks SG, Sékaly R-P, Chomont N.2015. A novel assay to measure the magnitude of the inducible viral reservoir in
HIV-infected individuals. EBioMedicine2:874 – 883.http://dx.doi.org/10
.1016/j.ebiom.2015.06.019.
23. Chun TW, Carruth L, Finzi D, Shen X, DiGiuseppe JA, Taylor H, Hermankova M, Chadwick K, Margolick J, Quinn TC, Kuo YH, Brook-meyer R, Zeiger MA, Barditch-Crovo P, Siliciano RF.1997. Quantifi-cation of latent tissue reservoirs and total body viral load in HIV-1
infec-tion. Nature387:183–188.http://dx.doi.org/10.1038/387183a0.
24. Harada S, Koyanagi Y, Yamamoto N.1985. Infection of HTLV-III/LAV in HTLV-I-carrying cells MT-2 and MT-4 and application in a plaque
assay. Science229:563–566.http://dx.doi.org/10.1126/science.2992081.
25. Larder BA, Darby G, Richman DD.1989. HIV with reduced sensitivity to
zidovudine (AZT) isolated during prolonger therapy. Science243:1731–
1734.
26. Pauwels R, De Clercq E, Desmyter J, Balzarini J, Goubau P, Herdewijn P, Vanderhaeghe H, Vandeputte M.1987. Sensitive and rapid assay on MT-4 cells for detection of antiviral compounds against the AIDS virus. J Virol
Methods16:171–185.http://dx.doi.org/10.1016/0166-0934(87)90002-4.
27. Kutsch O, Benveniste EN, Shaw GM, Levy N, Levy DN.2002. Direct and quantitative single-cell analysis of human immunodeficiency virus type 1
reactivation from latency. J Virol 76:8776 – 8786.http://dx.doi.org/10
.1128/JVI.76.17.8776-8786.2002.
28. Jordan A, Bisgrove D, Verdin E.2003. HIV reproducibly establishes a
latent infection after acute infection of T cells in vitro. EMBO J22:1868 –
1877.http://dx.doi.org/10.1093/emboj/cdg188.
29. Adachi A, Gendelman HE, Koenig S, Folks T, Willey R, Rabson A, Martin MA.1986. Production of acquired immunodeficiency syndrome-associated retrovirus in human and nonhuman cells transfected with an
infectious molecular clone. J Virol59:284 –291.
30. Pannecouque C, Daelemans D, De Clercq E.2008. Tetrazolium-based colorimetric assay for the detection of HIV replication inhibitors: revisited
20 years later. Nat Protoc3:427– 434.http://dx.doi.org/10.1038/nprot
.2007.517.
31. Hendrix CW, Collier AC, Lederman MM, Schols D, Pollard RB, Brown S, Jackson JB, Coombs RW, Glesby MJ, Flexner CW, Bridger GJ, Badel
K, MacFarland RT, Henson GW, Calandra G.2004. Safety, pharmaco-kinetics, and antiviral activity of AMD3100, a selective CXCR4 receptor
inhibitor, in HIV-1 infection. J Acquir Immune Defic Syndr37:1253–
1262.http://dx.doi.org/10.1097/01.qai.0000137371.80695.ef.
32. Luchenko VL, Litman T, Chakraborty AR, Heffner A, Devor C, Wilk-erson J, Stein W, Robey RW, Bangiolo L, Levens D, Bates SE.2014. Histone deacetylase inhibitor-mediated cell death is distinct from its
global effect on chromatin. Mol Oncol8:1379 –1392.http://dx.doi.org/10
.1016/j.molonc.2014.05.001.
33. Khromov T, Pantakani DVK, Nolte J, Wolf M, Dressel R, Engel W, Zechner U.2011. Global and gene-specific histone modification profiles
of mouse multipotent adult germline stem cells. Mol Hum Reprod17:
166 –174.http://dx.doi.org/10.1093/molehr/gaq085.
34. Cohen GB, Gandhi RT, Davis DM, Mandelboim O, Chen BK, Strominger JL, Baltimore D.1999. The selective downregulation of class I major histocompatibility complex proteins by 1 protects
HIV-infected cells from NK cells. Immunity10:661– 671.http://dx.doi.org/10
.1016/S1074-7613(00)80065-5.
35. Neil SJD, Zang T, Bieniasz PD.2008. Tetherin inhibits retrovirus release
and is antagonized by HIV-1 Vpu. Nature451:425– 430.http://dx.doi.org
/10.1038/nature06553.
36. Petravic J, Ellenberg P, Chan M-L, Paukovics G, Smyth RP, Mak J, Davenport MP.2014. Intracellular dynamics of HIV infection. J Virol
88:1113–1124.http://dx.doi.org/10.1128/JVI.02038-13.
37. Jønsson KL, Tolstrup M, Vad-Nielsen J, Kjær K, Laustsen A, Andersen MN, Rasmussen TA, Søgaard OS, Østergaard L, Denton PW, Jakobsen
MR.2015. Histone deacetylase inhibitor romidepsin inhibits de novo
HIV-1 infections. Antimicrob Agents Chemother59:3984 –3994.http:
//dx.doi.org/10.1128/AAC.00574-15.
38. Beans EJ, Fournogerakis D, Gauntlett C, Heumann LV, Kramer R, Marsden MD, Murray D, Chun T-W, Zack JA, Wender PA. 2013. Highly potent, synthetically accessible prostratin analogs induce latent
HIV expression in vitro and ex vivo. Proc Natl Acad Sci U S A110:11698 –
11703.http://dx.doi.org/10.1073/pnas.1302634110.
39. Jiang G, Dandekar S. 2015. Targeting NF-B signaling with protein kinase C agonists as an emerging strategy for combating HIV latency.
AIDS Res Hum Retroviruses31:4 –12.http://dx.doi.org/10.1089/aid.2014
.0199.
40. Chen BK, Gandhi RT, Baltimore D.1996. CD4 down-modulation dur-ing infection of human T cells with human immunodeficiency virus type 1
involves independent activities of vpu, env, and nef. J Virol70:6044 – 6053.
41. El-Far M, Ancuta P, Routy J-P, Zhang Y, Bakeman W, Bordi R, DaFonseca S, Said EA, Gosselin A, Tep T-S, Eichbaum Q, van Greve-nynghe J, Schwartz O, Freeman GJ, Haddad EK, Chomont N, Sekaly
R-P.2015. Nef promotes evasion of HIV-1 infected cells from the
CTLA-4-mediated inhibition of T cell activation. J Gen Virol96:1463–1477.http:
//dx.doi.org/10.1099/vir.0.000065.
on November 7, 2019 by guest
http://jvi.asm.org/