Ultrasensitive HIV-1 p24 Assay Detects
Single Infected Cells and Differences in
Reservoir Induction by Latency Reversal
Agents
Caroline Pereira Bittencourt Passaes,aTimothée Bruel,b,cJérémie Decalf,d,e Annie David,a Mathieu Angin,aValerie Monceaux,aMichaela Muller-Trutwin,a,c Nicolas Noel,f,g,h,iKatia Bourdic,iOlivier Lambotte,f,g,h,iMatthew L. Albert,d,e,j,k Darragh Duffy,d,j,kOlivier Schwartz,b,cAsier Sáez-Cirión,aANRS RHIVIERA Consortium
Institut Pasteur, Unité HIV, Inflammation et Persistance, Départements de Virologie et Immunologie, Paris, Francea; Institut Pasteur, Laboratoire Virus et Immunité, Département de Virologie, Paris, Franceb; Vaccine Research Institute, Creteil, Francec; Institut Pasteur, Laboratoire Immunobiologie des Cellules Dendritiques, Département d'Immunologie, Paris, Franced; Genentech, Inc., Department of Cancer Immunology, South San Francisco, California, USAe; UMR-1184, Université Paris Sud, Le Kremlin-Bicêtre, Francef; CEA, Division of Immuno-Virology, DSV/iMETI, Fontenay-aux-Roses, Franceg; Inserm U1184, Center for Immunology of Viral Infections and Autoimmune Diseases, Le Kremlin-Bicêtre, Franceh; APHP, Service de Médecine
Interne–Immunologie Clinique, Hôpitaux Universitaires Paris Sud, Le Kremlin-Bicêtre, Francei; Inserm U1223, Institut Pasteur, Paris, Francej; Institut Pasteur, Center for Translational Research, Paris, Francek
ABSTRACT The existence of HIV reservoirs in infected individuals under combined
antiretroviral therapy (cART) represents a major obstacle toward cure. Viral reservoirs are assessed by quantification of HIV nucleic acids, a method which does not dis-criminate between infectious and defective viruses, or by viral outgrowth assays, which require large numbers of cells and long-term cultures. Here, we used an ultra-sensitive p24 digital assay, which we report to be 1,000-fold more ultra-sensitive than classical enzyme-linked immunosorbent assays (ELISAs) in the quantification of HIV-1 Gag p24 production in samples from HIV-infected individuals. Results from ultrasen-sitive p24 assays were compared to those from conventional viral RNA reverse transcription-quantitative PCR (RT-qPCR)-based assays and from outgrowth assay readout by flow cytometry. Using serial dilutions and flow-based single-cell sorting, we show that viral proteins produced by a single infected cell can be detected by the ultrasensitive p24 assay. This unique sensitivity allowed the early (as soon as day 1 in 43% of cases) and more efficient detection and quantification of p24 in phytohemagglutinin-L (PHA)-stimulated CD4⫹T cells from individuals under effective cART. When seven different classes of latency reversal agents (LRA) in resting CD4⫹ T cells from HIV-infected individuals were tested, the ultrasensitive p24 assay re-vealed differences in the extent of HIV reactivation. Of note, HIV RNA production was infrequently accompanied by p24 protein production (19%). Among the drugs tested, prostratin showed a superior capacity in inducing viral protein production. In summary, the ultrasensitive p24 assay allows the detection and quantification of p24 produced by single infected CD4⫹T cells and provides a unique tool to assess early reactivation of infectious virus from reservoirs in HIV-infected individuals.
IMPORTANCE The persistence of HIV reservoirs in infected individuals under
effec-tive antiretroviral treatment represents a major obstacle toward cure. Different meth-ods to estimate HIV reservoirs exist, but there is currently no optimal assay to mea-sure HIV reservoirs in HIV eradication interventions. In the present study, we report an ultrasensitive digital ELISA platform for quantification of the HIV-1 protein p24. This method was employed to assess the early reactivation of infectious virus from
Received29 November 2016Accepted3 January 2017
Accepted manuscript posted online11 January 2017
CitationPassaes CPB, Bruel T, Decalf J, David A, Angin M, Monceaux V, Muller-Trutwin M, Noel N, Bourdic K, Lambotte O, Albert ML, Duffy D, Schwartz O, Sáez-Cirión A, ANRS RHIVIERA Consortium. 2017. Ultrasensitive HIV-1 p24 assay detects single infected cells and differences in reservoir induction by latency reversal agents. J Virol 91:e02296-16.https:// doi.org/10.1128/JVI.02296-16.
EditorGuido Silvestri, Emory University Copyright© 2017 American Society for Microbiology.All Rights Reserved. Address correspondence to Asier Sáez-Cirión, asier.saez-cirion@pasteur.fr.
C.P.B.P. and T.B. contributed equally to this article.
crossm
on November 7, 2019 by guest
http://jvi.asm.org/
reservoirs in HIV-1-infected individuals. We found that viral proteins produced by a single infected cell can be detected by an ultrasensitive p24 assay. This unprece-dented resolution showed major advantages in comparison to other techniques cur-rently used to assess viral replication in reactivation studies. In addition, such a highly sensitive assay allows discrimination of drug-induced reactivation of produc-tive HIV based on protein expression. The present study heralds new opportunities to evaluate the HIV reservoir and the efficacy of drugs used to target it.
KEYWORDS CD4⫹T cells, HIV cure, HIV reservoir, HIV-1, latency reversal agents, p24,
single cell
C
ombined antiretroviral therapy (cART) efficiently blocks HIV replication but fails to cure infection. This is due to the existence of HIV reservoirs persisting during cART that provide a source of viral rebound upon treatment discontinuation (1, 2). The persistence of these reservoirs has been associated mainly with the survival and clonal expansion of pools of long-lived infected memory CD4⫹T cells and with low-level viral replication in lymphoid tissues where cART has poor penetration (3, 4). The develop-ment of interventions to cure HIV relies on strategies that aim at controlling or eliminating the reservoirs (5–7). In this context there is an urgent need for sensitive diagnostic tools to monitor the size and nature of the reservoir. The quantification of cell-associated total or integrated HIV DNA is an easy and sensitive way to estimate the frequency of infected cells, and low levels of HIV DNA at the time of treatment interruption have been associated with delayed viral rebound (8, 9). However, this technique does not discriminate between the presence of infectious and defective proviruses. Other approaches aim at estimating the inducible reservoir, the potential source of infectious particles that can feed viral replication if treatment is interrupted. These techniques are based on in vitroactivation of provirus-carrying cells and the quantification of induced viral products (i.e., HIV RNA or proteins) (10–13). The quan-tification of viral proteins is thought to represent a more accurate readout of efficient viral reactivation. The HIV p24 enzyme-linked immunosorbent assay (ELISA) is the gold-standard laboratory technique to detect the presence of HIV proteins for both diagnosis and pathogenesis studies. However, the picomolar sensitivity of ELISA fails to detect levels of p24 that might be relevant in reservoir reactivation studies, and these studies require expensive and long outgrowth assays that consume large amounts of cells.The digitization of immunoassay analyte detection using single-molecule array (Simoa) technology represents an important recent advance in ultrasensitive protein detection, achieving detection at femtomolar concentrations (14, 15). This technique consists of using paramagnetic microbeads coated with a capture antibody that binds the analyte of interest. Similar to an ELISA, the Simoa uses a sandwich formed with a detector antibody. These immunocomplexes are then distributed into 40-femtoliter microwells (each microwell is sized to fit a single bead), and the conversion of the -galactosidase (-Gal) substrate (resorufin--D-galactopyranoside [RGP]) into a fluo-rescent product allows the identification of positive wells (see reference 16 for a schematic representation of the single-molecule array technique). The process is com-pletely automated, leading to accurate quantifications and low technical variation (17). Due to the unprecedented sensitivity of this technique, an ultrasensitive p24 assay was previously utilized to precisely diagnose acute HIV infection in plasma samples as accurately as nucleic acid testing (NAT) (18). In the present study, we aimed to determine the utility of the ultrasensitive p24 assay in reservoir reactivation studies using primary CD4⫹T cells infectedin vitroand in samples from individuals with low virus reservoirs and levels of viremia.
RESULTS
Detection of HIV p24 at the single-cell level by ultrasensitive p24 assay.We first aimed to determine the range of detection by the HIV ultrasensitive p24 assay in a
on November 7, 2019 by guest
http://jvi.asm.org/
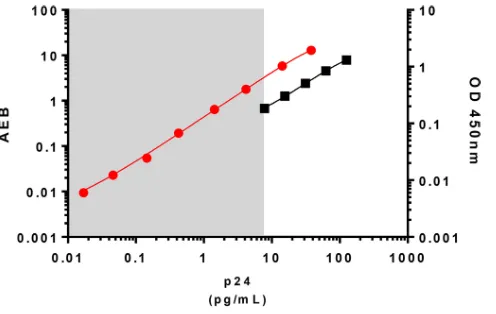
relevant biological material such as limited amounts of HIV-infected cells. HIV Gag p24 is usually detected at picogram (pg) levels by conventional p24 ELISAs. The ultrasen-sitive p24 assay standard curve ranged from 0.017 to 37.8 pg/ml, which allowed the quantification of p24 at femtogram (fg) levels (Fig. 1). This represents an increase in sensitivity of up to 3 logs compared to that of a classical p24 ELISA. We next determined the minimum number of HIV-infected cells needed for p24 detection with the ultra-sensitive assay. We infected CD4⫹T cells from two HIV-negative controls with infectious HIV-1 NL4-3in vitro. Productively infected cells, as measured by flow cytometry, were then serially diluted in autologous noninfected CD4⫹T cells (Fig. 2A). After 24 h, p24 could be detected in supernatants of cultures from both of the HIV-negative controls containing as few as 0.1 HIV-1 infected cells per million total cells. Saturation was observed at approximately 300 HIV-1-positive (HIV-1⫹) cells per million total cells. The detection of viral protein was linear between these values (Fig. 2B). Detection of p24 produced by 0.1 infected cell is most likely related to infected cells with low levels of protein production that were not detected by flow cytometry and may have caused some underestimation of the number of infected cells initially seeded. Also, as a replicative virus was used in this experiment, some p24 production might have originated from novel infected cells after overnight cell culture. Reevaluation of the frequency of Gag⫹cells by flow cytometry at the time of ultrasensitive p24 analysis showed, indeed, 2.3 to 6 times more infected cells per well than initially estimated (Fig. 2B and C).
Therefore, to exclude this issue, we infected CD4⫹T cells with single-cycle HIV NL4-3Δenv/green fluorescent protein (GFP) vesicular stomatitis virus G protein (VSV-G) pseudotyped particles (Fig. 3A). Two days after infection, we sorted GFP-positive (GFP⫹) CD4⫹T cells (Fig. 3B) and analyzed p24 protein expression in cell lysates and super-natants from 1, 10, and 100 GFP⫹cells after overnight culture in the presence of 20,000 autologous activated feeder CD4⫹T cells. The ultrasensitive p24 assay allowed the quantification of intracellular p24 (i.e., in cell lysates) produced by 1 (median and interquartile range [IQR], 0.26 pg/ml [0.14 to 0.32 pg/ml]), 10 (2.38 pg/ml [1.74 to 3.39 pg/ml]), and 100 (26.22 pg/ml [22.43 to 38.91 pg/ml]) HIV-infected CD4⫹ T cells (Fig. 3C). The levels of p24 released in the culture supernatants by the infected cells were comparable to those observed for the corresponding cell lysates: 1 cell (0.29 pg/ml; IQR of 0.15 to 0.41 pg/ml), 10 cells (1.54 pg/ml; IQR of 0.83 to 2.65 pg/ml), and 100 cells (25.74 pg/ml; IQR of 20.48 to 28.58 pg/ml). Consistently, amounts of intracel-lular and released p24 were strongly correlated (r⫽0.9698;P⬍0.0001) (Fig. 3D). p24 protein concentrations produced by single infected cells ranged from 0.096 to 0.36
FIG 1Representation of standard curves obtained with a conventional p24 ELISA and with the ultra-sensitive p24 assay. The conventional p24 standard curve (ZeptoMetrix Co., NY, USA) is represented by the black line, with values indicated on the rightyaxis; the range is from 7.8 to 125 pg/ml. The standard curve of the ultrasensitive p24 assay is represented by the red line, with values indicated on the leftyaxis; the range is from 0.017 to 37.8 pg/ml. OD, optical density; AEB, average amount of enzyme per bead.
on November 7, 2019 by guest
http://jvi.asm.org/
[image:3.585.83.331.69.226.2]pg/ml, which corresponded to values at least 5 times higher than the limit of quanti-fication (LOQ) and were much higher than the background signal obtained with noninfected CD4⫹T cells, which were below the LOQ of the technique (0.004 pg/ml; IQR of 0.002 to 0.007). To ensure confidence in further analyses, a conservative limit of quantification of 0.017 pg/ml, corresponding to the lower value of the p24 standard reference, was used. Importantly, p24 values obtained from 1 and 10 infected cells were lower than the LOQs of conventional p24 ELISAs (Fig. 1) and could be quantified only by the ultrasensitive p24 assay.
HIV p24 levels correlate with the production of HIV RNA. We compared the levels of p24 protein produced by HIV-infected cells measured with the ultrasensitive assay with the detection of HIV-1 RNA by PCR, which is considered one of the most sensitive markers of viral reactivation. We sorted 1, 10, and 100 GFP⫹infected cells and quantified p24 and viral RNA in the supernatant after overnight culture. In 3 out of 10 single, sorted GFP⫹cells, neither p24 nor viral RNA could be detected, suggesting a technical problem during sorting. All supernatants positive for HIV RNA were also positive for HIV p24, and a strong correlation (r⫽0.9014;P⬍0.0001) (Fig. 3E) between levels of p24 and RNA was observed. These results reinforce the high sensitivity of the p24 ultrasensitive digital immunoassay.
HIV p24 levels in single infected cells correlate with the FI of GFP. We next analyzed if the ultrasensitive assay allowed detection of differences in the quantities of p24 production per infected cell. We observed some variability of p24 levels from single HIV-infected cells (Fig. 3E). We hypothesized that this variability was due to different
FIG 2Comparison of the sensitivities of flow cytometry and the ultrasensitive digital immunoassay for the detection of HIV-1-infected cells. (A) PHA-activated CD4⫹T cells were infected with the HIV-1 NL4-3 strain for 3 days. The frequency of infected CD4⫹T cells was determined by flow cytometry. Infected CD4⫹T cells were then serially diluted to assess Simoa p24 sensitivity (1 to 1⫻105infected cells were added to 106autologous uninfected T cells for 24 h). (B) Quantification of HIV p24 by ultrasensitive digital immunoassay in the cell supernatants (in blue). Results for one representative donor are represented. The lower limit of quantification (LOQ) is indicated by a dashed line (0.017 pg/ml). The frequency of Gag⫹cells reevaluated by flow cytometry after 24 h of culture is shown in black. (C) Representative dot plots of cultures estimated to contain 102to 105infected cells are depicted. FACS, fluorescence-activated cell sorting; FSC, forward scatter; O/N, overnight.
on November 7, 2019 by guest
http://jvi.asm.org/
[image:4.585.42.401.70.361.2]FIG 3Detection of HIV p24 at a single-cell level by ultrasensitive digital immunoassay. (A) Activated CD4⫹T cells were infected with single-cycle NL4-3ΔenvΔNef/GFP HIV-1 particles pseudotyped with VSV-G. GFP⫹CD4 T cells were sorted at 1, 10, or 100 cells per well and kept overnight in culture with 20,000 activated CD4⫹T cells from the same noninfected donor. Quantification of p24 by ultrasensitive digital immunoassay was performed in both cell lysates and culture supernatants. (B) At left is a representative dot plot of activated CD4⫹T cells infected for 48 h with single-round NL4-3ΔenvΔNef/GFP HIV-1 particles pseudotyped with VSV-G. Levels of infection (GFP⫹cells) ranged from 20% to 30%. At right is a representative dot plot of activated CD4⫹T cells infected for 48 h with single-round NL4-3ΔenvΔNef/GFP HIV-1 particles pseudotyped with VSV-G and sorted at a single-cell level. The purity of GFP⫹cells sorted at a single-cell level was 100%. SSC-A, side scatter area. (C) Quantification of intracellular HIV p24 and the corresponding supernatant by ultrasensitive digital immunoassay from sorted GFP⫹CD4⫹T cells after 18 h of culture. Cell lysates are indicated by filled symbols, supernatants are represented by open symbols. Blue, orange, and black symbols represent 1, 10, and 100 infected cells, respectively. Gray diamonds represent noninfected CD4⫹T cells. Heavy horizontal bars denote median values, and light horizontal bars indicate interquartile ranges. The lower limit of quantification is indicated by the dashed line (0.017 pg/ml). (D) Relationship between the amount of intracellular p24 and released p24 present in supernatant after culture overnight. Blue, orange, and black symbols represent 1, 10, and 100 infected cells, respectively. (E) Relationship between the amount of p24 and RNA in culture supernatant. Blue, orange, and black symbols represent 1, 10, and 100 infected cells, respectively. Three samples were below the limit of quantification with both techniques and are represented by gray circles. Arbitrary values were assigned to represent these negative points. (F) Relationship between the amount of intracellular p24 and GFP expression recorded during single-cell index sorting (DIVA; BD Bioscience). Two samples that were below the limit of quantification with the ultrasensitive p24 assay are represented by gray circles. All correlations were calculated using a nonparametric Spearman test.
on November 7, 2019 by guest
http://jvi.asm.org/
[image:5.585.41.426.74.525.2]FIG 4Ultrasensitive p24 quantification allows short-term detection of HIV-1 reactivation in cells from HIV-infected individuals on cART. CD4⫹T cells from HIV-infected individuals on cART were stimu-lated with PHA and IL-2 to induce HIV-1 reactivation, stained with anti-Gag antibodies at the indicated time points, and analyzed by flow cytometry. Dead cells were excluded based on forward scatter (FSC) and side scatter (SSC) profiles. p24 in culture supernatants was assessed by the ultrasensitive assay. (A) One representative example (participant 6) of HIV-1 reactivation detected by flow cytometry. (B) Comparison of quantification of Gag p24 levels (pg/ml; blue) by the ultrasensitive p24 assay and frequency of Gag p24⫹cells measured by flow cytometry (black) to reveal viral reactivation in cells from six HIV-infected individuals displaying detectable reactivation by flow cytometry. (C) CD4⫹T cells from up to 29 cART-treated individuals (red) and 4 HIV-negative controls (blue) were activated and analyzed by ultrasensitive p24 quantification after 1, 3, or 7 days. Each dot represents cells isolated from one individual. Black bars indicate medians.
on November 7, 2019 by guest
http://jvi.asm.org/
[image:6.585.102.305.69.585.2]levels of protein production by individual cells rather than to technical variability. To elucidate this point, we sorted single HIV-infected GFP⫹CD4⫹T cells and evaluated the range of GFP fluorescence intensities (FIs) per cell. Thirty-nine cells were sorted and processed, and we could detect p24 production for all of them. Intracellular p24 levels and GFP FI for each cell were significantly correlated (r⫽0.7215;P⬍0.0001) (Fig. 3F). Therefore, the ultrasensitive assay can detect p24 produced by one single infected cell, and the variability in intracellular p24 levels reflects different viral protein production levels of individual infected cells.
Monitoring virus reactivation from total CD4ⴙ T cells by ultrasensitive p24
assay.We next assessed the ability of the ultrasensitive p24 assay to detect HIV-1 reservoir reactivation from CD4⫹T cells isolated from peripheral blood of cART-treated individuals with undetectable viremia. We first used supernatants of phytohemagglutinin-L (PHA)-activated CD4⫹T cell cultures from six HIV-infected subjects in which HIV-1 Gag p24 was detectable by flow cytometry (Fig. 4A and B) (median time of HIV-1 detection after reactivation, 14 days). Using the ultrasensitive assay, HIV-1 p24 was detectable between days 1 and 7 (median, 3.5 days) for all individuals and reached saturation between days 5 and 10 (Fig. 4B). Crucially, a positive result from ultrasensitive p24 assay preceded the detection of Gag⫹cells by flow cytometry by 7 to 10 days.
[image:7.585.46.542.83.470.2]We then extended our analyses to supernatants of CD4⫹T cells from an additional 29 randomly selected HIV-infected individuals with suppressed viremia under cART for
TABLE 1Characteristics of HIV-1-infected patients on cART and viral reactivation measured by ultrasensitive p24 assay
Patient no.
Time since HIV-positive diagnosis (yr)
Length of cART treatment (yr)
CD4ⴙT cell count
(cells/mm3)
RNA (copies/ml)
DNA
(copies/106cells)a
Detectable p24 at day7 post-PHA treatment
1 30 11 457 ⬍40 ND ⫹
2 26 8 345 ⬍40 ND ⫹
3 28 22 252 ⬍40 ND ⫹
4 25 7 451 ⬍40 ND ⫹
5 26 5 739 ⬍40 ND ⫹
6 24 9 2,002 ⬍40 ND ⫹
7 5 4 495 ⬍40 ND ⫹
8 18 9 405 ⬍40 ND ⫹
9 9 8 366 ⬍40 1 ⫺
10 7 5 730 ⬍40 206 ⫹
11 21 8 484 ⬍40 ND ⫹
12 29 22 1,024 ⬍40 ND ⫹
13 22 8 959 ⬍40 548 ⫺
14 17 9 505 ⬍40 122 ⫹
15 13 6 542 ⬍40 542 ⫹
16 25 7 672 ⬍40 ND ⫹
17 21 19 1,025 ⬍40 422 ⫹
18 14 7 640 ⬍40 68 ⫹
19 16 9 450 ⬍40 198 ⫹
20 19 8 563 ⬍40 15 ⫹
21 14 9 968 ⬍40 246 ⫹
22 31 3 1,329 ⬍40 52 ⫺
23 17 17 602 ⬍40 62 ⫺
24 29 7 806 ⬍40 86 ⫹
25 13 10 1,033 ⬍40 55 ⫹
26 10 7 594 ⬍40 37 ⫺
27 8 8 638 ⬍40 325 ⫹
28 11 9 1,197 ⬍40 ND ⫹
29 7 7 1,329 ⬍40 ND ⫹
30 7 5 684 ⬍40 467 ⫹
31 30 26 536 ⬍40 730 ⫹
32 12 5 685 ⬍40 ND ⫹
33 9 9 937 ⬍40 ND ⫹
34 4 4 830 ⬍40 405 ⫺
35 16 15 516 ⬍40 ND ⫹
aND, not determined.
on November 7, 2019 by guest
http://jvi.asm.org/
whom the frequency of reactivatable virus was unknown. After PHA activation, HIV-positive cells were detected by flow cytometry in cultures from 7/29 individuals, starting at days 10 to 15 (Table 1), confirming our previous results (19). HIV production measured by ultrasensitive p24 assay was detectable in cultures from 23 out of 29 individuals at day 7 (Fig. 4C). Importantly, p24 was detectable as early as day 1 postactivation in cultures from 43% of the individuals (Fig. 4C). Of note, HIV p24 levels, as determined by the ultrasensitive immunoassay, increased over time in cultures, irrespective of whether p24 could be detected by flow cytometry. These results demonstrate an unprecedented ability of the ultrasensitive p24 assay to reveal HIV-1 spreading from the CD4⫹T cell reservoir.
Monitoring the efficiency of LRA by ultrasensitive p24 quantification assay. Since the ultrasensitive p24 assay provides a unique tool to detect viral protein production at low levels, we investigated if such a high sensitivity might provide new insights about the differential capacity of distinct latency-reversing agents (LRA) to induce viral reactivation. In a previous study (20), we evaluated viral reactivation from resting CD4⫹T cells from individuals with undetectable viremia at different time points (days 1, 3, 6, and 14) in cultures in the absence or presence of six LRA (prostratin, chaetocin, suberoylanilide hydroxamic acid [SAHA], 5-aza-2=-deoxycytidine [5-AzadC], hexamethylene bisacetamide [HMBA], or interleukin-7 [IL-7]) and positive controls. In that study, viral reactivation was measured by the quantification of HIV-1 RNA in culture supernatants, which did not show any difference in the kinetics and frequency of HIV induction with the different LRA or positive controls (Fig. 5A) (20). Here, we tested p24 levels in supernatants (n⫽144), known to be HIV RNA positive from our previous study (20), from stimulated resting CD4⫹T cells from 10 individuals for whom material was still available. We detected p24 in 18.75% (27/144) of supernatants (median, 0.90 pg/ml; IQR of 0.13 to 1.87 pg/ml). Gag p24 could be detected in only 1 of 65 supernatants with HIV RNA levels of⬍2,000 copies, suggesting that these weak levels of HIV RNA could correspond to abortive viral reactivations. Similarly to results from ourin vitroinfection experiments (Fig. 3E), a significant correlation between the ultrasensitive p24 assay and HIV RNA levels was observed in p24-positive cultures (r⫽ 0.53; P⫽0.005) (Fig. 5B, orange dots). However, the correlation coefficient was weaker when p24-negative samples (Fig. 5B, blue dots) were taken into consideration (r⫽0.39;P⫽0.0004). RNA levels were overall lower in p24-negative cultures (median HIV RNA copies/ml [IQR] in p24-negative and positive cultures, respectively, of 5,260 copies/ml [3,385 to 13,025 copies/ml] and 19,425 copies/ml [4,249 to 94,313 copies/ml];P⫽0.004). Nevertheless, the HIV RNA range in p24-negative samples was similar to the one in positive samples (Fig. 5B and C) and well within the RNA levels for which we could detect p24 inin vitro
experiments (Fig. 3E). This suggests that the absence of detectable p24 in many HIV-1 RNA-positive cultures could not be solely related to insufficient sensitivity of the p24 assay. It is likely that p24-positive samples identified the reactivation of replication-competent viruses that multiplied in culture, reaching higher levels of HIV RNA.
In agreement with our previous analysis (20), no significant differences were found in the levels of HIV RNA in the supernatants treated with different LRA and the controls tested here (P⫽0.12) (Fig. 5C). Of note, very high levels of HIV RNA were even detected in some cultures in the absence of stimulation (Fig. 5A). In contrast, a significant difference (P⫽0.03) was observed in the frequency of p24-positive samples between the differentially stimulated cell cultures (Fig. 5C). In particular, p24 production was not detected in supernatants from nonstimulated cultures or after stimulation with chaeto-cin. The frequency of p24-positive cultures treated with prostratin (35.3%) and the positive-control allogeneic stimulation (33.3%) or anti-CD2/anti-CD28 (35.3%) tended to be significantly different from that of mock cultures inpost hocanalyses (Pvalues of 0.065, 0.078, and 0.073, respectively). The quantification of p24 by ultrasensitive digital immunoassay revealed that certain latency-reversing agents were more proficient at inducing production of viral proteins in resting CD4⫹T cells from HIV-infected indi-viduals.
on November 7, 2019 by guest
http://jvi.asm.org/
DISCUSSION
Interpreting the efficacy of HIV curative strategies relies on how HIV reservoirs and reactivation are measured (21, 22). To date, the reservoir is mostly quantified by PCR-based techniques, notably as total/integrated HIV DNA or cell-associated RNA, or by a viral outgrowth assay (VOA) (23, 24). The quantification of viral DNA may overes-timate the HIV reservoir since it quantifies both productive and defective proviruses. In contrast, the VOA may underestimate the reservoir up to 60-fold (11, 25) since it seems capable of only partial detection of the viral progeny able to spread to neighboring cells due to the stochastic nature of viral induction (21). In addition, the VOA requires large amounts of cells and over 2 weeks of cell culture. More recently, the Tat/Rev-induced limiting-dilution assay (TILDA) was developed to complement the other tests (12). It works in a VOA-based system and quantifies multiply spliced HIV RNAs, which are early viral transcripts produced after cell activation. The size of the inducible reservoir estimated by TILDA is smaller than the total HIV DNA but larger than replication-competent virus measured by VOA. Despite the advantages of the TILDA in comparison to the VOA in terms of cost, blood volume, and experimental time required, the TILDA does not directly measure the production of viral antigens or replicative virus production. We show here that an ultrasensitive ELISA also allows the detection and quantification of p24 produced by a single HIV-1-infected-CD4⫹T cell. The ultrasensi-tive p24 assay could greatly improve the readout of both the VOA and TILDA, notably
FIG 5Ultrasensitive p24 analysis reveals differences among LRA in reactivating HIV from resting CD4⫹T cells. Samples from the study of Noel et al. (20) were analyzed here with the ultrasensitive p24 assay. Resting CD4⫹T cells from 10 HIV-infected individuals with undetectable viremia (cART-treated and HIV controllers) were stimulated by different latency-reversing agents (prostratin, chaetocin, SAHA, 5-AzadC [5=AZA], HMBA, and IL-7). Nonstimulated cells (mock) and anti-CD2 plus anti-CD28 (2/28), PHA plus IL-2 (PHA), and preactivated allogeneic CD8-depleted T cells (Allo) were used as controls. Cultures were monitored at days 1, 3, 6, and 14 for HIV-1 RNA production. (A) Kinetics of viral reactivation/stimulus measured by HIV-RNA is shown. (B) Relationship between the amount of p24 and HIV-1 RNA in the culture supernatants from resting CD4⫹T cells stimulated by different LRA. Correlation was calculated using a nonparametric Spearman test. Samples positive for p24 are represented in orange, and samples negative for p24 are represented in blue. (C) RNA levels for all the supernatants analyzed/stimulus are indicated. Samples positive for p24 are represented by orange circles, and samples negative for p24 are represented by blue circles. Pie charts represent the frequency of positive p24 samples (orange) per stimulus.
on November 7, 2019 by guest
http://jvi.asm.org/
[image:9.585.44.468.72.381.2]by reducing the time between virus reactivation from the translation-competent reservoir and detection of p24 and by elucidating whether cells with inducible multiply spliced transcripts as measured by the TILDA produce viral antigens. It is important to mention that the cost of the ultrasensitive p24 assay is fairly similar to that of conventional p24 ELISA kits.
We demonstrated the applicability of the ultrasensitive p24 assay in HIV reactivation studies in samples from individuals with low virus reservoirs or levels of viremia. The ultrasensitive p24 assay displayed notable advantages compared with other tech-niques. In comparison to classical Gag p24 flow cytometry, the ultrasensitive p24 assay preceded by around 11 days the detection of positive cultures and strongly increased the frequency of detectable HIV reactivation. In comparison to RNA quantification in culture supernatants, we show that the ultrasensitive p24 assay may discriminate between effective LRA and drugs that might initiate transcription but fail to trigger detectable p24 production. When p24 was detected after culture of resting CD4⫹T cells from HIV-infected individuals under different conditions, the levels of p24 produced by infected cells were strongly correlated with the levels of HIV-1 RNA, in line with the results that we obtained in the infectionin vitroexperiments. However, production of HIV-1 RNA was not always accompanied by production of p24. This was not due to a difference in the sensitivities of the two techniques. Moreover, discrepancies were observed between samples producing similar levels of HIV RNA. Our results suggest, rather, that the concurrent production of HIV RNA and p24 may depend on the quality of the stimulation provided by LRA. It has been suggested that some LRA, such as some histone deacetylase (HDAC) inhibitors, are able to induce only HIV-1 transcription but not complete viral reactivation (26–28). Our results are in agreement with these reports. Among the drugs tested, prostratin displayed the best capacity to induce viral antigen production. This is in line with the recent work of Jones and colleagues describing prostratin as a good inducer of viral antigens stimulating CD8⫹T cell responses (29). Because our experiments were conducted in the absence of antiretroviral drugs, we cannot formally exclude the possibility that prostratin, compared to the other LRA analyzed, may have favored activation of bystander CD4⫹ T cells and enabled viral spread. However, it is important that we used resting CD4⫹T cells, and prostratin does not induce T cell activation or allow HIV-1 infection of CD4⫹T cells in the absence of other stimuli (30).
Our data strongly support that HIV RNA quantification and the ultrasensitive Gag p24 assay are complementary markers to be analyzed in the evaluation of efficient viral reactivation strategies.
Overall, the ultrasensitive p24 assay provides a unique tool to measure viral pro-duction at the single-cell level and to monitor the translation-competent reservoir in HIV-infected individuals. While it is likely that not all cells harboring a translation-competent provirus are able to produce infectious HIV-1 (11), the release of viral antigens may contribute to the recognition of the cell by the immune system and also to persistent immune activation and HIV-1 pathogenesis. Therefore, these antigen-producing cells should be preferential targets for HIV cure strategies.
MATERIALS AND METHODS
Ethics statement.Blood samples from HIV-negative controls were obtained from the French Blood Bank (Etablissement Français du Sang) in the context of a collaboration agreement with the Institut Pasteur (C CPSL UNT, number 15/EFS/023). Fifty-milliliter blood samples were obtained from HIV-1 controllers (HIC; ANRS CO21 Codex cohort) and HIV-1-infected individuals under successful cART who were followed at the Kremlin-Bicêtre University Hospital (France). All participants provided written consent to participate in the study, which was approved by the regional investigational review board (Comité de Protection des Personnes Ile-de-France VII, Paris, France) and performed according to European guidelines and the Declaration of Helsinki.
Purification and infectionin vitroof CD4ⴙT cells.Peripheral blood mononuclear cells (PBMCs)
from HIV-negative controls were isolated by gradient separation using LSM 1077 lymphocyte separation medium and Sepmate tubes (Stemcell Technologies). CD4⫹T cells were purified by positive selection using anti-CD4 antibody-coupled magnetic beads (catalog number 18052, EasySep Human CD4 Positive Selection kit; Stemcell Technologies). Purified CD4⫹T cells were activated for 3 days with phytohemagglutinin-L (PHA-L; 1g/ml) and IL-2 (100 U/ml). Activated CD4⫹T cells were infected with
on November 7, 2019 by guest
http://jvi.asm.org/
productive HIV-1 NL4-3 or single-round NL4-3ΔenvΔNef/GFP HIV-1 particles pseudotyped with VSV-G for 1 h with spinoculation (1,200⫻gat room temperature), followed by 1 h of incubation at 37°C. Cells were then washed with R10 medium (RPMI, Glutamax, 10% fetal calf serum, and penicillin-streptomycin) containing IL-2 and incubated at 37°C for 48 h.
Flow-based sorting of GFPⴙCD4 T cells.GFP⫹CD4⫹T cells (1, 10, 100, 1,000 and 10,000) were sorted a minimum of 10 times each in 96-well plate using a FACSAria III cell sorter (BD Biosciences). Cells were either lysed immediately after sorting or were kept overnight in culture with 20,000 activated CD4⫹ T cells from the same HIV-negative control as the feeder layer. Cells were lysed with NP-40 buffer (1% NP-40, 0.1% SDS, 150 mM NaCl, 50 mM Tris-HCl, protease inhibitor cocktail), and supernatants were inactivated by the addition of Triton X-100 to 2% and incubation of the sample for 30 min at room temperature. Supernatants and cell lysates were stored at⫺80°C prior to analysis. Quantification of p24 by Simoa was performed in both cell lysates and culture supernatants.
HIV-1 reactivation from bulk CD4ⴙT cells from HIV-1-positive individuals.PBMCs from
individ-uals under successful cART (Table 1) were isolated by Ficoll gradient purification, and CD4⫹T cells were purified using anti-human CD4 magnetic beads, according to the manufacturer’s protocol (Miltenyi Biotec). CD4⫹T cells were stimulated with PHA and IL-2 in a 12-well plate at a concentration of 1 to 7 million cells/ml in 3 ml. After 24 h, cells were washed to remove PHA and resuspended in medium containing IL-2. Every 1 to 2 days, 1 ml of supernatant was harvested and replaced with fresh medium. At the same time points (see Fig. 4), cells were evaluated for p24 expression by flow cytometry.
HIV-1 reactivation by latency-reversing agents from resting CD4ⴙT cells of HIV-1-infected
individuals.An LRA HIV reactivation assay was performed in samples from HIC and cART individuals from Kremlin-Bicêtre University Hospital (France). The characteristics of the patients enrolled in this study and the detailed protocol used for the reactivation assay are described in Noel et al. (20). Briefly, quiescent CD4⫹CD25⫺CD69⫺HLA-DR⫺T cells were purified by negative selection. For viral reactivation, 500,000 quiescent CD4⫹T cells/well were cultured in 48-well plates in the presence of prostratin (2.5
M), chaetocin (90 nM), SAHA (2.5M), 5-AzadC (1M), HMBA (5 mM), or IL-7 (10 ng/ml). Anti-CD2 plus anti-CD28 antibodies at saturating concentrations, PHA (0.25 mg/ml) plus IL-2 (25 ng/ml), and PHA preactivated allogeneic CD8-depleted T cells from HIV-negative controls were used as positive controls. Importantly, no activated CD4⫹T cells were added to these cultures, and the results reflect the capacity of these LRA to induce viral production rather than the capacity of these drugs to activate bystander cells that will support efficient HIV replication. Supernatants (200l) were collected at days 1, 3, 6, and 14. The cultures were replenished with fresh medium alone on day 1 and with medium plus reactivating agents at days 3 and 6. Supernatants were stored at⫺80°C before analyses.
p24 ultrasensitive digital immunoassay (Simoa).HIV capsid p24 protein was quantified by an ultrasensitive p24 assay (Simoa; Quanterix) according to the manufacturer’s instructions. A quantification range of 0.017 to 37 pg/ml was utilized in the present study. For thein vitroassays, at least 10 biological replicates were performed for each condition (cell lysates and culture supernatants). For the reactivation assay, each sample was tested once due to limited volume availability. Four-parameter logistic (4PL) regression fitting was used to estimate the concentration of p24. For correlation analyses, wells testing negative for p24 were assigned a value of 0.008 pg/ml.
Intracellular p24 staining.Cells were fixed with phosphate-buffered saline (PBS) containing 4% paraformaldehyde for 10 min. Cells were then washed with PBS and stained using anti-Gag antibody (clone KC57-FITC; Beckman Coulter) diluted (1:500) in PBS containing 1% bovine serum albumin (BSA) and 0.05% saponin. After 15 min, cells were washed, resuspended in PBS, and analyzed using a FACSCanto II flow cytometer (BD Biosciences). Analyses were done on FlowJo, version 9.3.2, software (FlowJo, LLC).
HIV-1 RNA quantification.Viral RNA was extracted from 100 l of culture supernatant using a NucleoSpin 8 Virus Core kit (Macherey-Nagel), according to the manufacturer’s instructions. HIV-1 RNA levels in culture supernatants were obtained using the a Generic HIV Charge Virale kit (Biocentric) according to the manufacturer’s instructions. Detection range was from 300 to 5⫻106copies/ml. The measuring range of the assay was determined to be linear from 165 to 5⫻106copies/ml.
Statistical analyses.Statistical analyses were performed using GraphPad Prism, version 6.05, and SigmaPlot (Systat Software). Correlations were performed using the Spearman test. Analysis of variance (ANOVA) and the Holm-Sidakpost hocmethod were used for multigroup analyses. Differences were considered significant at aPvalue of⬍0.05.
ACKNOWLEDGMENTS
This work was supported by grants from MSDAVENIR (http://www.msdavenir.fr/fr/ accueil/) and ANRS—France Recherche Nord & Sud Sida-HIV Hépatites (http://anrs.fr/) to A.S.-C. and by Pasteurinnov (http://www.pasteur.fr) to D.D. C.P.B.P. and M.L.A. were supported by research fellowships from ANRS and Marie Skłodowska-Curie actions (http://ec.europa.eu/research/mariecurieactions/). T.B. was supported by funds from the Vaccine Research Institute (http://www.recherchevaccinvih.fr/).
The funders had no role in study design, data collection and interpretation, or the decision to submit the work for publication.
We thank the Center for Human Immunology (CIH) at Institut Pasteur for technical
on November 7, 2019 by guest
http://jvi.asm.org/
support. We thank all HIV-infected individuals who participated to the study. We thank participants to the ANRS RHIVIERA Consortium for helpful discussion.
The members of the ANRS RHIVIERA (Remission of HIV Era) Consortium are as follows. The coordinators were Asier Sáez-Cirión (Institut Pasteur, Paris, France) and Christine Rouzioux (CHU Necker, Paris, France). Scientific and clinical partners were Françoise Barré-Sinoussi (Institut Pasteur, Paris, France), Brigitte Autran (CHU Pitié-Salpetriere and Université Pierre et Marie Curie, Paris, France), Monsef Benkirane (Institut de Genetique Humaine, Montpellier, France), Jeremie Guedj (Institut Claude Bernard, Paris, France), Laurent Hocqueloux (CHR Orleans La Source, Orleans, France), Christine Katlama (CHU Pitié Salpetriere, Paris, France), Olivier Lambotte (CHU Kremlin-Bicêtre, Le Kremlin-Kremlin-Bicêtre, France), Roger Legrand (IDMIT, CEA, Fontenay-aux-Roses, France), Laurence Meyer (INSERM, Le Kremlin-Bicêtre, France), Hugo Mouquet (Institut Pasteur, Paris, France), Michaela Müller-Trutwin (Institut Pasteur, Paris, France), Anne-Marie Taburet (CHU Kremlin-Bicêtre, France), and Carine Van Lint (Université Libre de Bruxelles, Brussels, Belgium). Participants from ANRS were Jean François Delfraissy (Director), Livia Pedroza Martins (Head of HIV Basic Research), and Sandrine Couffin-Cadiergues (Head of HIV Clinical Research).
REFERENCES
1. Chun TW, Justement JS, Murray D, Hallahan CW, Maenza J, Collier AC, Sheth PM, Kaul R, Ostrowski M, Moir S, Kovacs C, Fauci AS. 2010. Rebound of plasma viremia following cessation of antiretroviral ther-apy despite profoundly low levels of HIV reservoir: implications for eradication. AIDS 24:2803–2808. https://doi.org/10.1097/QAD. 0b013e328340a239.
2. Chun TW, Stuyver L, Mizell SB, Ehler LA, Mican JA, Baseler M, Lloyd AL, Nowak MA, Fauci AS. 1997. Presence of an inducible HIV-1 latent reser-voir during highly active antiretroviral therapy. Proc Natl Acad Sci U S A 94:13193–13197.https://doi.org/10.1073/pnas.94.24.13193.
3. Chomont N, El-Far M, Ancuta P, Trautmann L, Procopio FA, Yassine-Diab B, Boucher G, Boulassel MR, Ghattas G, Brenchley JM, Schacker TW, Hill BJ, Douek DC, Routy JP, Haddad EK, Sekaly RP. 2009. HIV reservoir size and persistence are driven by T cell survival and homeostatic prolifera-tion. Nat Med 15:893–900.https://doi.org/10.1038/nm.1972.
4. Fletcher CV, Staskus K, Wietgrefe SW, Rothenberger M, Reilly C, Chipman JG, Beilman GJ, Khoruts A, Thorkelson A, Schmidt TE, Anderson J, Perkey K, Stevenson M, Perelson AS, Douek DC, Haase AT, Schacker TW. 2014. Persistent HIV-1 replication is associated with lower antiretroviral drug concentrations in lymphatic tissues. Proc Natl Acad Sci U S A 111: 2307–2312.https://doi.org/10.1073/pnas.1318249111.
5. Passaes CP, Saez-Cirion A. 2014. HIV cure research: advances and prospects. Virology 454 – 455:340 –352. https://doi.org/10.1016/ j.virol.2014.02.021.
6. Chun TW, Moir S, Fauci AS. 2015. HIV reservoirs as obstacles and oppor-tunities for an HIV cure. Nat Immunol 16:584 –589.https://doi.org/ 10.1038/ni.3152.
7. Deeks SG, Lewin SR, Ross AL, Ananworanich J, Benkirane M, Cannon P, Chomont N, Douek D, Lifson JD, Lo YR, Kuritzkes D, Margolis D, Mellors J, Persaud D, Tucker JD, Barre-Sinoussi F, International AIDS Society Towards a Cure Working Group, Alter G, Auerbach J, Autran B, Barouch DH, Behrens G, Cavazzana M, Chen Z, Cohen EA, Corbelli GM, Eholie S, Eyal N, Fidler S, Garcia L, Grossman C, Henderson G, Henrich TJ, Jefferys R, Kiem HP, McCune J, Moodley K, Newman PA, Nijhuis M, Nsubuga MS, Ott M, Palmer S, Richman D, Saez-Cirion A, Sharp M, Siliciano J, Silvestri G, Singh J, Spire B, Taylor J, et al. 2016. International AIDS Society global scientific strategy: towards an HIV cure 2016. Nat Med 22:839 – 850.
https://doi.org/10.1038/nm.4108.
8. Rouzioux C, Melard A, Avettand-Fenoel V. 2014. Quantification of total HIV1-DNA in peripheral blood mononuclear cells. Methods Mol Biol 1087:261–270.https://doi.org/10.1007/978-1-62703-670-2_21. 9. O’Doherty U, Swiggard WJ, Jeyakumar D, McGain D, Malim MH. 2002.
A sensitive, quantitative assay for human immunodeficiency virus type 1 integration. J Virol 76:10942–10950.https://doi.org/10.1128/ JVI.76.21.10942-10950.2002.
10. Laird GM, Eisele EE, Rabi SA, Lai J, Chioma S, Blankson JN, Siliciano JD, Siliciano RF. 2013. Rapid quantification of the latent reservoir for HIV-1
using a viral outgrowth assay. PLoS Pathog 9:e1003398.https://doi.org/ 10.1371/journal.ppat.1003398.
11. Siliciano JD, Siliciano RF. 2005. Enhanced culture assay for detection and quantitation of latently infected, resting CD4⫹ T-cells carrying replication-competent virus in HIV-1-infected individuals. Methods Mol Biol 304:3–15.
12. Procopio FA, Fromentin R, Kulpa DA, Brehm JH, Bebin AG, Strain MC, Richman DD, O’Doherty U, Palmer S, Hecht FM, Hoh R, Barnard RJ, Miller MD, Hazuda DJ, Deeks SG, Sekaly RP, Chomont N. 2015. A novel assay to measure the magnitude of the inducible viral reservoir in HIV-infected individuals. EBioMedicine 2:874 – 883. https://doi.org/10.1016/ j.ebiom.2015.06.019.
13. Pasternak AO, Lukashov VV, Berkhout B. 2013. Cell-associated HIV RNA: a dynamic biomarker of viral persistence. Retrovirology 10:41.https:// doi.org/10.1186/1742-4690-10-41.
14. Rissin DM, Fournier DR, Piech T, Kan CW, Campbell TG, Song L, Chang L, Rivnak AJ, Patel PP, Provuncher GK, Ferrell EP, Howes SC, Pink BA, Minnehan KA, Wilson DH, Duffy DC. 2011. Simultaneous detection of single molecules and singulated ensembles of molecules enables im-munoassays with broad dynamic range. Anal Chem 83:2279 –2285.
https://doi.org/10.1021/ac103161b.
15. Rissin DM, Kan CW, Campbell TG, Howes SC, Fournier DR, Song L, Piech T, Patel PP, Chang L, Rivnak AJ, Ferrell EP, Randall JD, Provuncher GK, Walt DR, Duffy DC. 2010. Single-molecule enzyme-linked immunosor-bent assay detects serum proteins at subfemtomolar concentrations. Nat Biotechnol 28:595–599.https://doi.org/10.1038/nbt.1641. 16. Kelley SO, Mirkin CA, Walt DR, Ismagilov RF, Toner M, Sargent EH. 2014.
Advancing the speed, sensitivity and accuracy of biomolecular detection using multi-length-scale engineering. Nat Nanotechnol 9:969 –980.
https://doi.org/10.1038/nnano.2014.261.
17. Wilson DH, Rissin DM, Kan CW, Fournier DR, Piech T, Campbell TG, Meyer RE, Fishburn MW, Cabrera C, Patel PP, Frew E, Chen Y, Chang L, Ferrell EP, von Einem V, McGuigan W, Reinhardt M, Sayer H, Vielsack C, Duffy DC. 2016. The Simoa HD-1 analyzer: a novel fully automated digital immu-noassay analyzer with single-molecule sensitivity and multiplexing. J Lab Autom 21:533–547.https://doi.org/10.1177/2211068215589580. 18. Cabrera C, Chang L, Stone M, Busch M, Wilson DH. 2015. Rapid, fully
automated digital immunoassay for p24 Protein with the sensitivity of nucleic acid amplification for detecting acute HIV infection. Clin Chem 61:1372–1380.https://doi.org/10.1373/clinchem.2015.243287. 19. Bruel T, Guivel-Benhassine F, Amraoui S, Malbec M, Richard L, Bourdic K,
Donahue DA, Lorin V, Casartelli N, Noel N, Lambotte O, Mouquet H, Schwartz O. 2016. Elimination of HIV-1-infected cells by broadly neutral-izing antibodies. Nat Commun 7:10844. https://doi.org/10.1038/ ncomms10844.
20. Noel N, Pena R, David A, Avettand-Fenoel V, Erkizia I, Jimenez E, Lecuroux C, Rouzioux C, Boufassa F, Pancino G, Venet A, Van Lint C,
on November 7, 2019 by guest
http://jvi.asm.org/
Martinez-Picado J, Lambotte O, Saez-Cirion A, Prado JG. 2016. Long-term spontaneous control of HIV-1 is related to low frequency of infected cells and inefficient viral reactivation. J Virol 90:6148 – 6158.https://doi.org/ 10.1128/JVI.00419-16.
21. Eriksson S, Graf EH, Dahl V, Strain MC, Yukl SA, Lysenko ES, Bosch RJ, Lai J, Chioma S, Emad F, Abdel-Mohsen M, Hoh R, Hecht F, Hunt P, Somsouk M, Wong J, Johnston R, Siliciano RF, Richman DD, O’Doherty U, Palmer S, Deeks SG, Siliciano JD. 2013. Comparative analysis of measures of viral reservoirs in HIV-1 eradication studies. PLoS Pathog 9:e1003174.https:// doi.org/10.1371/journal.ppat.1003174.
22. Yukl SA, Boritz E, Busch M, Bentsen C, Chun TW, Douek D, Eisele E, Haase A, Ho YC, Hutter G, Justement JS, Keating S, Lee TH, Li P, Murray D, Palmer S, Pilcher C, Pillai S, Price RW, Rothenberger M, Schacker T, Siliciano J, Siliciano R, Sinclair E, Strain M, Wong J, Richman D, Deeks SG. 2013. Challenges in detecting HIV persistence during potentially curative interventions: a study of the Berlin patient. PLoS Pathog 9:e1003347.
https://doi.org/10.1371/journal.ppat.1003347.
23. Bruner KM, Hosmane NN, Siliciano RF. 2015. Towards an HIV-1 cure: measuring the latent reservoir. Trends Microbiol 23:192–203.https:// doi.org/10.1016/j.tim.2015.01.013.
24. Rouzioux C, Richman D. 2013. How to best measure HIV reservoirs? Curr Opin HIV AIDS 8:170 –175. https://doi.org/10.1097/COH. 0b013e32835fc619.
25. Ho YC, Shan L, Hosmane NN, Wang J, Laskey SB, Rosenbloom DI, Lai J, Blankson JN, Siliciano JD, Siliciano RF. 2013. Replication-competent
non-induced proviruses in the latent reservoir increase barrier to HIV-1 cure. Cell 155:540 –551.https://doi.org/10.1016/j.cell.2013.09.020.
26. Cillo AR, Sobolewski MD, Bosch RJ, Fyne E, Piatak M, Jr, Coffin JM, Mellors JW. 2014. Quantification of HIV-1 latency reversal in resting CD4⫹T cells from patients on suppressive antiretroviral therapy. Proc Natl Acad Sci U S A 111:7078 –7083.https://doi.org/10.1073/pnas.1402873111. 27. Bullen CK, Laird GM, Durand CM, Siliciano JD, Siliciano RF. 2014. New ex vivo approaches distinguish effective and ineffective single agents for reversing HIV-1 latency in vivo. Nat Med 20:425– 429.https://doi.org/ 10.1038/nm.3489.
28. Bouchat S, Delacourt N, Kula A, Darcis G, Van Driessche B, Corazza F, Gatot JS, Melard A, Vanhulle C, Kabeya K, Pardons M, Avettand-Fenoel V, Clumeck N, De Wit S, Rohr O, Rouzioux C, Van Lint C. 2015. Sequential treatment with 5-aza-2=-deoxycytidine and deacetylase inhibitors reac-tivates HIV-1. EMBO Mol Med 8:117–138.
29. Jones RB, Mueller S, O’Connor R, Rimpel K, Sloan DD, Karel D, Wong HC, Jeng EK, Thomas AS, Whitney JB, Lim SY, Kovacs C, Benko E, Karandish S, Huang SH, Buzon MJ, Lichterfeld M, Irrinki A, Murry JP, Tsai A, Yu H, Geleziunas R, Trocha A, Ostrowski MA, Irvine DJ, Walker BD. 2016. A subset of latency-reversing agents expose HIV-infected resting CD4⫹T-cells to recognition by cytotoxic t-lymphocytes. PLoS Pathog 12:e1005545.https://doi.org/10.1371/journal.ppat.1005545. 30. Korin YD, Brooks DG, Brown S, Korotzer A, Zack JA. 2002. Effects of
prostratin on T-cell activation and human immunodeficiency virus la-tency. J Virol 76:8118 – 8123. https://doi.org/10.1128/JVI.76.16.8118 -8123.2002.