Different Expression of
Interferon-Stimulated Genes in Response to HIV-1
Infection in Dendritic Cells Based on
Their Maturation State
Esther Calonge,
aMercedes Bermejo,
aFrancisco Diez-Fuertes,
aIsabelle Mangeot,
b,c,dNuria González,
aMayte Coiras,
aLaura Jiménez Tormo,
aJavier García-Perez,
aNathalie Dereuddre-Bosquet,
b,c,dRoger Le Grand,
b,c,dJosé Alcamí
aAIDS Immunopathogenesis Unit, Instituto de Salud Carlos III, Majadahonda, Spaina; Inserm, U1184, Paris, Franceb; Université Paris Sud 11, UMR1184, Orsay, Francec; CEA, Department of Immunology of Viral Infections and Autoimmune Diseases, IDMIT Infrastructure, iMETI/DSV, Fontenay-aux-Roses, Franced
ABSTRACT
Dendritic cells (DCs) are professional antigen-presenting cells whose
functions are dependent on their degree of differentiation. In their immature state,
DCs capture pathogens and migrate to the lymph nodes. During this process, DCs
become resident mature cells specialized in antigen presentation. DCs are
character-ized by a highly limiting environment for human immunodeficiency virus type 1
(HIV-1) replication due to the expression of restriction factors such as SAMHD1 and
APOBEC3G. However, uninfected DCs capture and transfer viral particles to CD4
lym-phocytes through a
trans
-enhancement mechanism in which chemokines are
in-volved. We analyzed changes in gene expression with whole-genome microarrays
when immature DCs (IDCs) or mature DCs (MDCs) were productively infected using
Vpx-loaded HIV-1 particles. Whereas productive HIV infection of IDCs induced
ex-pression of interferon-stimulated genes (ISGs), such induction was not produced in
MDCs, in which a sharp decrease in ISG- and CXCR3-binding chemokines was
ob-served, lessening
trans
-infection of CD4 lymphocytes. Similar patterns of gene
ex-pression were found when DCs were infected with HIV-2 that naturally expresses
Vpx. Differences were also observed under conditions of restrictive HIV-1 infection,
in the absence of Vpx. ISG expression was not modified in IDCs, whereas an increase
of ISG- and CXCR3-binding chemokines was observed in MDCs. Overall these results
suggest that sensing and restriction of HIV-1 infection are different in IDCs and
MDCs. We propose that restrictive infection results in increased virulence through
different mechanisms. In IDCs avoidance of sensing and induction of ISGs, whereas
in MDCs increased production of CXCR3-binding chemokines, would result in
lym-phocyte attraction and enhanced infection at the immune synapse.
IMPORTANCE
In this work we describe for the first time the activation of a different
genetic program during HIV-1 infection depending on the state of maturation of
DCs. This represents a breakthrough in the understanding of the restriction to HIV-1
infection of DCs. The results show that infection of DCs by HIV-1 reprograms their
gene expression pattern. In immature cells, productive HIV-1 infection activates
interferon-related genes involved in the control of viral replication, thus inducing an
antiviral state in surrounding cells. Paradoxically, restriction of HIV-1 by SAMHD1
would result in lack of sensing and IFN activation, thus favoring initial HIV-1 escape
from the innate immune response. In mature DCs, restrictive infection results in
HIV-1 sensing and induction of ISGs, in particular CXCR3-binding chemokines, which
could favor the transmission of HIV to lymphocytes. Our data support the hypothesis
Received17 August 2016Accepted20
January 2017
Accepted manuscript posted online1
February 2017
CitationCalonge E, Bermejo M, Diez-Fuertes F,
Mangeot I, González N, Coiras M, Jiménez Tormo L, García-Perez J, Dereuddre-Bosquet N, Le Grand R, Alcamí J. 2017. Different expression of interferon-stimulated genes in response to HIV-1 infection in dendritic cells based on their maturation state. J Virol 91:e01379-16.https:// doi.org/10.1128/JVI.01379-16.
EditorGuido Silvestri, Emory University
Copyright© 2017 American Society for
Microbiology.All Rights Reserved.
Address correspondence to José Alcamí, [email protected].
crossm
on November 7, 2019 by guest
http://jvi.asm.org/
that genetic DC reprograming by HIV-1 infection favors viral escape and
dissemina-tion, thus increasing HIV-1 virulence.
KEYWORDS
HIV-1, immature dendritic cells, interferon-stimulated genes, mature
dendritic cells
D
endritic cells (DCs) are professional antigen-presenting cells that play a pivotal role
in the regulation of the immune system. In their immature state, DCs contact with
pathogens, and upon encounter with appropriate antigens, immature dendritic cells
(IDCs) migrate to lymph nodes, where they present processed antigens to T
lympho-cytes. During the migration process, DCs are transformed into a mature state (mature
DCs [MDCs]) and upregulate costimulatory molecules that increase their capacity to
present antigens to T lymphocytes. Contact between DCs and lymphocytes through
different sets of interacting molecules has been described as an “immune synapse,”
leading to lymphocyte activation, cytokine production, antigen recognition,
prolifera-tion, and differentiation (1).
Several studies show that immature and mature DCs show important differences in
gene expression (2–4), including different levels of chemokines that are involved in
human immunodeficiency virus type 1 (HIV-1) transmission, such as CXCL12 (5).
Fur-thermore, MDCs possess a specific immunophenotype (CD83
⫹CD40
⫹CCR7
⫹CD14
⫺CD80
⫹) that is weak or absent in IDCs and other cell types (6–9). Additionally, DCs that
have matured from monocytes
in vitro
also express very high levels of CD86 and, in
contrast to monocytes, have lost CD14, CD32, and CD64. The most important
differ-ences in gene expression between monocytes, IDCs, and MDCs encompass important
changes in genes involved in cell adhesion and motility, the immune response, and
growth control (3).
Antigen-presenting cells, and in particular IDCs, are one of the first targets that HIV-1
encounters at the mucosal surface during transmission “
in vivo
” (10, 11). DCs also
contribute to viral dissemination through the capture of viral particles by different
membrane-associated molecules, such as DC-SIGN and SIGLEC-1 (12–14). Viral particles
bound to the surface of DCs are efficiently transmitted to surrounding CD4
lympho-cytes in the absence of productive infection of the DCs in a process that has been
described as a “Trojan horse” mechanism (15, 16) However, infection of DCs “
in vivo
” is
a matter of debate. Actually, IDCs and MDCs are highly resistant to infection by HIV-1
and other lentiviruses (17, 18) due to the action of specific restriction mechanisms. Four
major cellular proteins have been shown to restrict HIV infection: TRIM5
␣
(tripartite
motif 5 alpha), APOBEC3G (apolipoprotein mRNA-editing enzyme catalytic
polypep-tidelike editing complex 3 [A3G]), BST-2/tetherin, and SAMHD1 (19–22). More recently,
class I interferon (IFN)-induced proteins Mx1 and IFI16 have also been proposed as
antiviral restriction factors (23, 24). In addition, by combining genetic signatures and
functional analyses, as many as 11 new potential restriction factors have been proposed
(25). To overcome these constraints, lentiviruses have acquired different mechanisms,
such as capsid mutations, escape from sensors of innate immunity (26, 27), or
incor-poration of new genes into the viral genome that can counteract the action of cellular
restriction factors. Later members of the SIVsm/HIV-2 lentivirus lineage code for a
protein, Vpx, that has been generated by Vpr duplication (28, 29) and overcomes the
block of early infection steps found in monocytes and DCs (30, 31).
It has been described that SAMHD1 is the cellular target of Vpx (22, 32). SAMHD1
belongs to a family of proteins that have been involved in a rare genetic disorder,
Aicardi-Goutieres syndrome (AGS) (33), characterized by autoimmune disorders and
increased production of IFN. SAMHD1 mediates its restriction activity by ensuring low
intracellular levels of nucleotides, creating an unfavorable cellular environment for viral
DNA synthesis (34). It has been proposed that HIV restriction of SAMHD1 can also be
related to degradation of viral RNA through its RNase activity (35), but this concept
remains controversial (36). Vpx targets SAMHD1, and this interaction inhibits the
restriction activity of SAMHD1, inducing its ubiquitin-proteasome-dependent
on November 7, 2019 by guest
http://jvi.asm.org/
tion and allowing productive HIV-1 infection. Initially SAMHD1 was described as specific
for myeloid-lineage cells, but it is also a major restriction factor in resting CD4
lymphocytes (21–24). In this environment, SAMHD1 is inactivated through
phosphor-ylation of SAMHD1 at Thr592 by cyclin A2/CDK1 in proliferating cells, which correlates
with loss of its ability to restrict HIV-1 infection (32).
Paradoxically, efficient infection of DCs by overcoming SAMHD1 resistance is
asso-ciated with decreased virulence in the host. Current data (37, 38) support that
de-creased pathogenicity in Vpx-carrying lentiviruses is probably related to early detection
of viral infection by cellular sensors and the induction of protective immune responses
mediated by class I IFN. In contrast, DCs are defended from infection by HIV-1 and other
Vpx-minus lentiviruses by SAMHD1, and this mechanism prevents an unwanted
inter-feron response.
However, the large majority of infection experiments with different HIV and simian
immunodeficiency virus (SIV) lentiviruses and the study of restriction mechanisms have
been performed in IDCs that are functionally different from MDCs. In this work, we have
performed a systematic analysis of transcriptome changes induced by infection in
restrictive (HIV-1) and productive (HIV-1 plus Vpx and HIV-2) conditions in both IDCs
and MDCs.
Our results show striking differences between IDCs and MDCs in their response to
both restrictive and productive HIV-1 infection. As already described, we confirmed that
productive HIV-1 infection of IDCs results in the induction of early interferon-mediated
immune responses. However, we determined that, in contrast, productive HIV-1
infec-tion of MDCs shuts off interferon-stimulated gene (ISG) expression, including synthesis
of CXCR3-binding chemokines that can contribute to lymphocyte recruitment and
trans
-infection in the immune synapse.
RESULTS
Vpx overcome HIV-1 restriction preferentially in IDCs but not in MDCs.
SAMHD1
restriction (22) was overcome in both IDCs and MDCs by infection with viral particles
loaded with Vpx protein to obtain productive infection. An HIV-1– green fluorescent
protein (GFP) clone lacking the
env
HIV-1 gene and pseudotyped with the vesicular
stomatitis virus glycoprotein (VSV-G) was used for infection. Vpx was expressed by
cotransfection of the HIV-1 genome with a Vpx-expressing plasmid in 293 T cells (39).
To ensure infectivity in the highly restrictive environment of DCs, high input doses (200
ng p24/well; multiplicity of infection [MOI] of between 3 and 10) were used. When
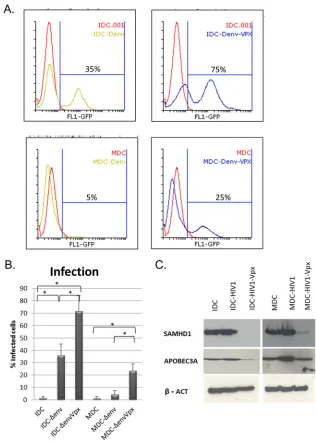
infection was performed with pseudotyped viral particles loaded with Vpx, the number
of productively infected IDC rose from 30% to 75% (Fig. 1A and B).
Restriction to HIV-1 replication was stronger in MDCs, which displayed only 5% of
infected GFP-expressing cells. This strong restriction was only partially hindered by Vpx,
which increased productive infection up to 25%. In both IDCs and MDCs, Vpx
expres-sion was highly efficient in degrading SAMHD1 (Fig. 1C), suggesting that other factors
account for the differences in HIV-1 infection observed between IDCs and MDCs. Similar
data were observed with at least five donors.
To confirm this statement and to assess if differences in HIV-1 expression between
IDCs and MDCs were related to different efficiencies in viral entry, both cell types were
infected with a full-length HIV-1 clone (JR-FL) and a VSV-pseudotyped viral clone
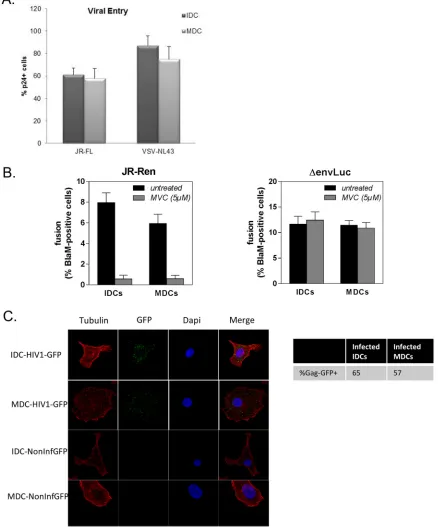
(pNL4-3Δenv). Viral entry was measured by intracellular staining of CA-Gag-p24 protein
by flow cytometry at 8 h after infection (Fig. 2A). No significant differences were found
between IDCs and MDCs. Additionally, viral fusion was measured using
Blam-Vpr-loaded viruses to compare viral entry between IDCs and MDCs. As shown in Fig. 2B,
similar levels of viral fusion were found in IDCs and MDCs when they were infected with
either a full-length HIV-R5 clone or a VSV-pseudotyped vector. To rule out that the p24
staining shown in Fig. 2A was due to viral attachment to the plasma membrane,
confocal experiments were performed using Gag-GFP viral particles; IDCs and MDCs
were infected with Gag-GFP viruses, and after 1 h, more than 50% of both IDCs and
MDCs displayed intracellular GFP particles (Fig. 2C). These data show that differences in
on November 7, 2019 by guest
http://jvi.asm.org/
productive HIV-1 infection between IDCs and MDCs when viral particles were loaded
with Vpx were not due to restriction at the entry level and suggest that postentry
mechanisms other than SAMHD1 are involved in the strong restriction to HIV-1
infec-tion observed in MDCs.
Different gene expression is triggered in IDCs and MDCs by productive HIV-1
infection.
It has been previously shown that HIV-1 infection of monocytes and DCs
triggers different cellular pathways (40–44) and results in differential gene activation. In
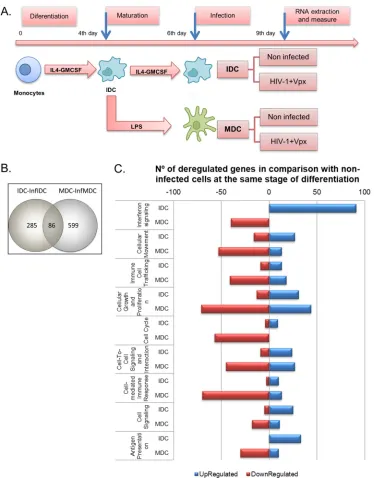
order to obtain a global assessment of gene expression changes induced by productive
HIV-1 infection in IDCs and MDCs, microarray analyses comparing cells noninfected and
infected with VSV-pseudotyped HIV-1 virus carrying Vpx were performed at the same
time points (Fig. 3A). These conditions were selected to achieve the highest levels of
FIG 1Impact of Vpx on HIV-1 restriction in immature and mature dendritic cells. (A) Human IDCs and MDCs were infected with the pNL4.3-ΔenvGFP viral clone pseudotyped with VSV-G (Δenv) (200 ng p24/well). Viral particles were loaded or not with Vpx as indicated. Productive infection was quantified by flow cytometry 72 h after infection. (B) IDC and MDC infection with virus loaded or not loaded with Vpx measured by the expression of GFP in 5 different donors. Data were analyzed using the Mann-Whitney test (*,P⬍0.05) (C). Analysis by immunoblotting of SAMHD1 and APOBEC3A expression in protein extracts from human IDCs and MDCs infected with the pNL4.3-ΔenvGFP viral clone pseudotyped with VSV-G. Viral particles were loaded or not with Vpx.-Actin was used as loading control.on November 7, 2019 by guest
http://jvi.asm.org/
[image:4.585.46.362.69.511.2]infected DCs in order to detect gene expression differences induced by HIV-1 infection.
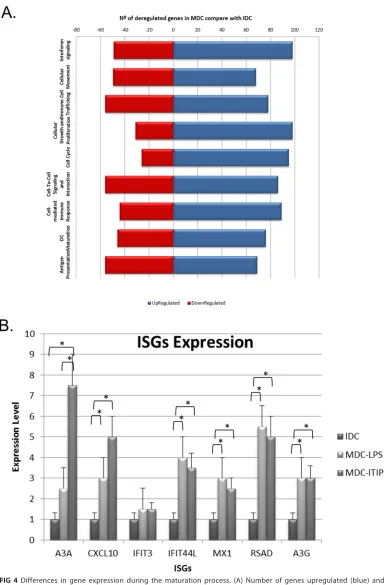
On one hand, strong differences in gene expression due to DC maturation (uninfected
MDCs versus uninfected IDCs) were found (Fig. 4A). To assess if the selected method of
dendritic cell maturation (lipopolysaccharide [LPS]) biased ISG induction, we compared
FIG 2(A) Viral entry was quantified by detection of intracellular Gag-p24 by flow cytometry in human IDCs and MDCs that were infected for 8 h with a pNL4.3-Δenv viral clone pseudotyped with VSV-G and JR-FL HIV-1 virus. Results for one representative experiment out of 5 are shown. (B) Virion-based fusion assay performed with HIV-1 and Δenv virus containing Blam-Vpr. Results represent the mean⫾ standard error of the mean (SEM) from three independent experiments using DCs from different donors. (C) Analysis by confocal microscopy of infected and noninfected cells using HIV1-Gag-GFP viruses or noninfectious GFP particles. The percentage of infected cells was measured by the presence of GFP inside the cells (up to 100 cells were counted).
on November 7, 2019 by guest
http://jvi.asm.org/
[image:5.585.40.478.80.607.2]ISG expression in MDCs matured with LPS or with ITIP (300 IU/ml interleukin-1

[IL-1

]
and 1,000 IU/ml IL-6 [Peprotech], 1,000 IU/ml tumor necrosis factor alpha [TNF-
␣
] [R&D
Systems], and 1
g/ml prostaglandin E
2[PGE
2] [Sigma-Aldrich]). As shown in Fig. 4B, the
same pattern was observed in both cases. Besides the impact of cell maturation on
gene expression, statistical analysis of the microarray data yielded a differential
expres-FIG 3Productive infection of IDCs and MDCs modifies different expression patterns. (A) Time schedule of differentiation, maturation, and infection of DCs. Gene expression patterns of IDCs and MDCs infected under productive conditions (⫹Vpx) were examined using whole human genome microarrays containing 44,000 probes representing 41,000 human genes and transcripts. After filtering the scanned images, 30,388 gene probes were considered for statistical analysis. Analysis of three independent RNA extractions was performed. Expression values (log2transformed) were obtained for each probe in three
replicates for all cell types. Expression ratios (log2) were calculated using values for noninfected cells as a baseline. Only
probes with a qvalue of⬍5% were considered statistically significant. (B) Venn diagram displaying the number of deregulated genes detected in IDCs and MDCs in comparison with noninfected cells in the same stage of differentiation. Overall, 86 common genes were deregulated in both IDCs and MDCs after infection, whereas the large majority of genes were differentially deregulated. (C) The number of genes differentially deregulated in productively infected IDCs and MDCs compared to noninfected cells was classified according to their functions using the Ingenuity Pathway Analysis (IPA) software program (Ingenuity System).
on November 7, 2019 by guest
http://jvi.asm.org/
[image:6.585.41.415.68.546.2]FIG 4Differences in gene expression during the maturation process. (A) Number of genes upregulated (blue) and downregulated (red) related to different cellular processes during maturation of myeloid dendritic cells. (B) Differ-ences in gene expression due to maturation using LPS or ITIP and in infected MDCs. RNA was extracted from human IDCs and MDCs matured with LPS or ITIP, and ISGs were analyzed by qPCR using specific primers. Results represent the mean from three independent experiments using DCs from different donors. Data were analyzed using the Mann-Whitney test (**,P⬍0.05).
on November 7, 2019 by guest
http://jvi.asm.org/
[image:7.585.42.429.68.653.2]sion directly related to viral infection. The number of genes modified by productive
infection was higher in MDCs than in IDCs. These results are summarized in a Venn
diagram in Fig. 3B. Overall, 86 of the deregulated genes modified by HIV-1 infection
were shared by infected MDCs and IDCs, but a higher percentage of genes was
differentially deregulated by productive HIV-1 infection, i.e., 285 for IDCs and 599 for
MDCs compared to noninfected DCs at the same step and time of differentiation.
The functional analysis of gene expression data showed that some essential cellular
functions were modified during productive infection of DCs (Fig. 3C). Genes included in
the model were those reaching a level of statistical significance (
P
⬍
0.05). Interestingly,
a strong increase in the expression of interferon-stimulated genes (ISGs) was detected
during productive infection of IDCs, whereas this pathway was not significantly
acti-vated in MDCs. Actually, in MDCs, productive infection induced a sharp decrease in the
expression of genes involved in immune functions, such antigen presentation,
cell-to-cell interactions, cell-to-cell trafficking, and interferon signaling. Overall these data show that
HIV-1 infection triggers different patterns of gene expression according to the stage of
differentiation of DCs.
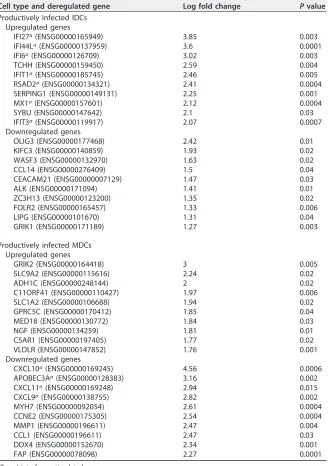
A list of the “top ten” genes whose expression was up- or downregulated after
productive infection in IDCs and MDCs is given in Table 1. These genes were selected
according to fold change in expression level (
⬎
2) and included mostly ISGs.
Unexpect-edly, in MDCs, productive HIV-1 infection resulted in downregulation of CXCR3-binding
chemokine genes CXCL9, CXCL10, and CXCL11, which are regulated by IFN and are
involved in the recruitment of activated T cells and macrophages to lymph nodes. A
decrease in mRNA levels of APOBEC3A was also observed after productive infection of
MDCs.
Activation of IFN-
␣
signaling pathway during productive and restrictive
infec-tion of MDCs and IDCs.
To confirm the differential expression of ISG in IDCs and MDCs
observed in microarray experiments, mRNA levels of 10 ISGs were analyzed by
quan-titative reverse transcription-PCR (qRT-PCR). In addition, to assess whether a wild-type,
nonpseudotyped HIV-1 strain was able to induce changes in IFN class I pathways similar
to those induced by VSV-pseudotyped HIV-1 virions, DCs were infected with a
full-length HIV-1 R5-tropic clone (JR) carrying or not carrying Vpx. In the absence of
infection, higher basal levels of the following ISGs were observed in MDCs than in IDCs
due to the maturation process: BAX, IFI35, IFIT1, IFIT3, IFITM1Δ, IFNG, IRF1, MX1,
2
=
-5
=
-oligoadenylate synthetase 1 (OAS1), PTPN2, STAT1, STAT2, TAP1, and TYK2.
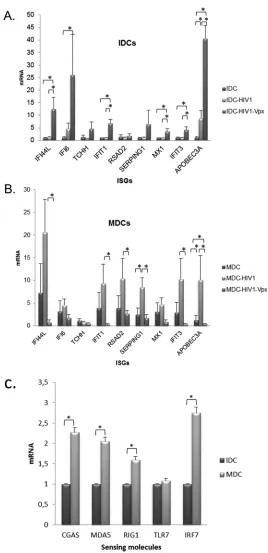
Interestingly, different patterns of ISG regulation were observed in IDCs and MDCs
upon infection. As previously found in array experiments, fully productive infection
(Vpx
⫹) was required to induce ISGs in IDCs, whereas under restrictive infection
condi-tions (
⫺), genes activated by class I IFN were not induced in IDCs (Fig. 5A). The opposite
was observed in MDCs, in which a consistent induction of ISGs was produced when
cells were infected under restrictive conditions. In these experiments, viral entry is
produced at similar levels in IDCs and MDCs as assessed by intracellular p24 staining
(Fig. 2A), but there is not active replication. Unexpectedly, when MDCs were infected in
the presence of Vpx, a sharp decrease of ISGs compared to the basal level was observed
in uninfected cells (Fig. 5B). These data suggest that different sensors and mechanisms
of IFN activation are present depending on the maturation stage of DCs. Actually,
expression of RNA sensors such as RIG-I and MDA5 and of DNA sensors such as C-GAS
was enhanced in MDCs (Fig. 5C). It is interesting that although the RNA sensor Toll-like
receptor 7 (TLR7) did not change during maturation, the level of IRF7 mRNA, a
transcription factor that mediates TLR7-induced responses, was higher in MDCs.
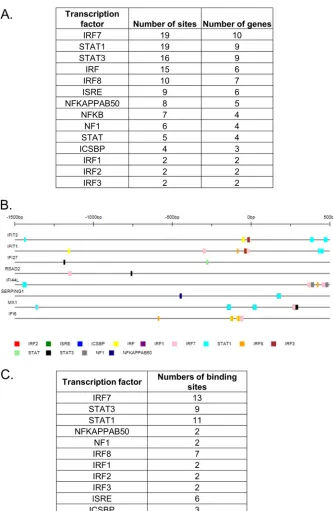
Analysis of transcription factors involved in the upregulation of ISGs in arrays from
HIV-VSV-infected IDCs pointed to enrichment of IRF7-, STAT1-, and STAT3-induced
genes (Fig. 6A). To confirm these data, the transcription factors involved in the
expression of the “top genes” induced by productive infection of IDCs were analyzed.
As shown in Fig. 6B and C, IRF7, STAT1, and STAT3 were overrepresented as regulators
of the observed ISGs.
on November 7, 2019 by guest
http://jvi.asm.org/
Regulation of gene expression in DCs by other lentivirus infection.
To validate
the results observed in our models of productive HIV-1 infection in which Vpx was
artificially loaded in viral particles, human DCs were infected with HIV-2 carrying the
vpx
gene, which increases productive infection in cells of the myeloid lineage (45–47). DCs
were generated as described in Materials and Methods and infected with the
HIV-2
ROM10strain. RNA was extracted at 72 h after infection, and mRNA levels for CXCL9,
CXCL10, and selected ISGs were analyzed by qRT-PCR.
[image:9.585.44.372.84.550.2]Viral fusion was measured using Blam-Vpr-loaded viruses to check the levels of viral
entry in HIV-2 infections. In this case, we observed differences between IDCs and MDCs
(Fig. 7B). The pattern of ISG expression induced by HIV-2 in IDCs was similar to the
profiles found in cells productively infected with HIV-1 (
⫹
Vpx) (Fig. 7A). MDCs did not
show the same pattern of ISG expression, possibly due to different levels of viral entry,
but a decrease in CXCR3-binding chemokines was observed in cells infected with HIV-2,
as observed when MDCs were infected with HIV-1 loaded with Vpx (Fig. 8A).
TABLE 1Genes deregulated after productive infection
Cell type and deregulated gene Log fold change Pvalue
Productively infected IDCs Upregulated genes
IFI27a(ENSG00000165949) 3.85 0.003
IFI44La(ENSG00000137959) 3.6 0.0001
IFI6a(ENSG00000126709) 3.02 0.003
TCHH (ENSG00000159450) 2.59 0.004
IFIT1a(ENSG00000185745) 2.46 0.005
RSAD2a(ENSG00000134321) 2.41 0.0004
SERPING1 (ENSG00000149131) 2.25 0.001
MX1a(ENSG00000157601) 2.12 0.0004
SYBU (ENSG00000147642) 2.1 0.03
IFIT3a(ENSG00000119917) 2.07 0.0007
Downregulated genes
OLIG3 (ENSG00000177468) 2.42 0.01
KIFC3 (ENSG00000140859) 1.93 0.02
WASF3 (ENSG00000132970) 1.63 0.02
CCL14 (ENSG00000276409) 1.5 0.04
CEACAM21 (ENSG00000007129) 1.47 0.03
ALK (ENSG00000171094) 1.41 0.01
ZC3H13 (ENSG00000123200) 1.35 0.02
FOLR2 (ENSG00000165457) 1.33 0.006
LIPG (ENSG00000101670) 1.31 0.04
GRIK1 (ENSG00000171189) 1.27 0.003
Productively infected MDCs Upregulated genes
GRIK2 (ENSG00000164418) 3 0.005
SLC9A2 (ENSG00000115616) 2.24 0.02
ADH1C (ENSG00000248144) 2 0.02
C11ORF41 (ENSG00000110427) 1.97 0.006
SLC1A2 (ENSG00000106688) 1.94 0.02
GPRC5C (ENSG00000170412) 1.85 0.04
MED18 (ENSG00000130772) 1.84 0.03
NGF (ENSG00000134259) 1.81 0.01
C5AR1 (ENSG00000197405) 1.77 0.02
VLDLR (ENSG00000147852) 1.76 0.001
Downregulated genes
CXCL10a(ENSG00000169245) 4.56 0.0006
APOBEC3Aa(ENSG00000128383) 3.16 0.002
CXCL11a(ENSG00000169248) 2.94 0.015
CXCL9a(ENSG00000138755) 2.82 0.002
MYH7 (ENSG00000092054) 2.61 0.0004
CCNE2 (ENSG00000175305) 2.54 0.0004
MMP1 (ENSG00000196611) 2.47 0.004
CCL1 (ENSG00000196611) 2.47 0.03
DDX4 (ENSG00000152670) 2.34 0.001
FAP (ENSG00000078098) 2.27 0.0001
aType I interferon-stimulated gene.
on November 7, 2019 by guest
http://jvi.asm.org/
Chemokine expression during MDC infection.
To confirm the differential
expres-sion of chemokines in MDCs observed in microarray experiments, cells were infected
under similar conditions using HIV-1 carrying or not carrying Vpx, and mRNAs encoding
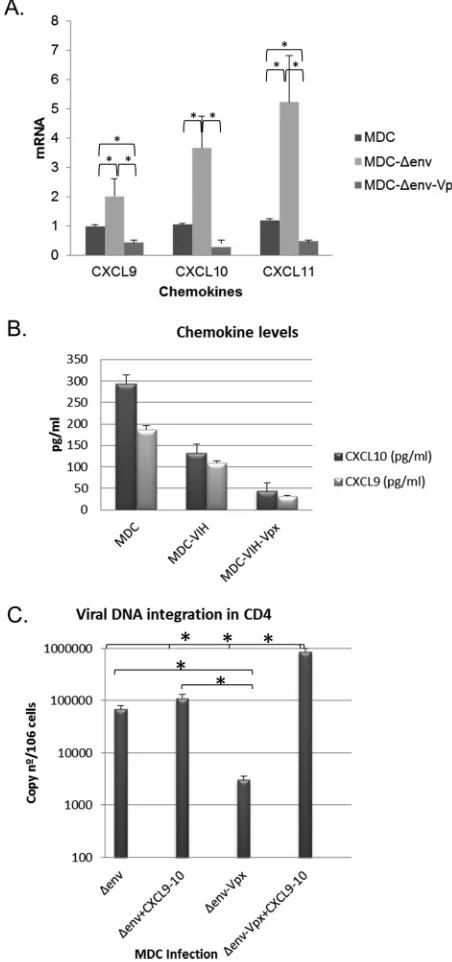
CXCL9, CXCL10, and CXCL11 were quantified by qRT-PCR. Restrictive infection (Vpx
⫺) of
FIG 5Changes in ISG expression during productive and restrictive dendritic cell infection. Human IDCs (A) and MDCs (B) were infected with JR virus carrying or not carrying Vpx. RNA was extracted at 72 h postinfection, and ISGs were analyzed by qPCR using specific primers. ACTB, PGK1, and ALDOA housekeeping genes were used for normalization. (C) RNA of human IDCs and MDCs was extracted, and sensing factor genes were analyzed by qPCR. Results represent the mean from three independent experiments using DCs from different donors. Data were analyzed using the Mann-Whitney test (*,P⬍0.05).on November 7, 2019 by guest
http://jvi.asm.org/
[image:10.585.70.338.66.619.2]MDCs induced an increase in CXCL9, CXCL10, and CXCL11 expression as for other ISGs,
but this effect was abolished when MDCs were infected with Vpx-loaded virus (Fig. 8A).
Enzyme-linked immunosorbent assay (ELISA) did not show an increase in CXCL9 and
CXCL10 levels in supernatants of infected MDCs in the absence of Vpx. However, a clear
decrease in chemokines was observed when MDCs were infected under productive
conditions (Fig. 8B), which correlates with the mRNA data.
FIG 6Transcription factor binding elements of ISGs deregulated during IDCs infection. (A) Predicted transcription factor binding elements in the promoter region of 1,500 bp of sequence upstream of the start site of the ISGs differentially deregulated in IDCs. Predictions are based on the MATCH algorithm using TRANSFAC 2012 professional matrices and applying the minimum false-positive cutoff through the Interferome v 2.01 tool. (B). Analysis with Interferome V2.01 of the top 10 gene promoter regions that modified their expression during infection of DCs. (C) Numbers of transcription factors binding sites represented in the top 10 gene promoter regions.
on November 7, 2019 by guest
http://jvi.asm.org/
[image:11.585.41.374.66.577.2]A decrease in CXCR3-binding chemokines reduces viral propagation to CD4
ⴙlymphocytes in the immune synapse.
To analyze if chemokine expression levels in
the immune synapse altered the susceptibility of HIV-1 to establish reservoirs in T cells,
trans
-infection experiments were performed. MDCs were infected under restrictive and
productive conditions with single-cycle virus pseudotyped with VSV loaded or not with
Vpx. Three days after DCs infection, cultures were pulsed with an HIV clone carrying a
luciferase reporter (JR-FL) and then cocultivated with autologous T cells for 48 h. We
observed a decrease of integrated proviral DNA when lymphocytes were cocultivated
with MDCs infected with Vpx-loaded particles compared to during restrictive HIV-1
infection of MDCs (Fig. 8C). The addition of CXCR3-binding chemokines recovered the
levels of viral integration in CD4 T cells, confirming that chemokine reduction in the
presence of Vpx is responsible for the reduction in viral integration. We hypothesized
that chemokine reduction under conditions of productive MDCs infection (
⫹
Vpx)
decreased viral integration.
FIG 7Effects of HIV-2 infection on ISG expression in IDCs and MDCs. Human IDCs and MDCs were infected with HIV-2 and HIV-1 JR-Ren strain virus carrying or not carrying Vpx. RNA was extracted at 72 h postinfection, and qPCR was performed using specific primers for the IFIT1, IFI44L, CXCL9, and CXCL10 genes. Results are expressed as fold change in mRNA levels in noninfected cells. Results represent the mean from three independent experiments. Data were analyzed using the Mann-Whitney test (*,P⬍
0.05). (B) Virion-based fusion assay performed with HIV-2 containing Blam-Vpr in IDCs and MDCs. Results represent the mean⫾SEM from three independent experiments using DCs from different donors.
on November 7, 2019 by guest
http://jvi.asm.org/
[image:12.585.50.365.69.493.2]DISCUSSION
The maturation process of DCs involves major changes in genetic expression (2–4),
including expression of new receptors (6–8), activation of ISGs (48), expression of
APOBEC proteins (49, 50), and chemokine production (5). We observed by microarray
FIG 8Changes in chemokine levels during productive and restrictive infection in mature dendritic cells. Human MDCs were infected with JR-Ren virus (HIV-1) carrying or not carrying Vpx. Cells were collected at 72 h postinfection, and RNA was extracted. (A) qPCR was performed using specific primers for chemokine genes. mRNA expression levels in infected cells were normalized according to those in uninfected cells. Reported results represent the medians from five independent experiments using DCs from different donors. Data were analyzed using the Mann-Whitney test (*,P⬍0.05) (B) The levels of chemokines MIG (CXCL9) and IP-10 (CXCL10) in the infection supernatants were measured by ELISA. Reported results represent the medians from five independent experiments. (C) Reduction in viral DNA integration. MDCs were infected with VSV-ΔenvGFP with or without Vpx, CXCL9, and CXCL10 (100 nM). After 3 days, cells were incubated with HIV-1 JR-Ren and cocultured with autologous lymphocytes previously activated with IL-2. Three days later, CD4⫹T cells were purified from culture by positive selection. HIV integration was measured by quantitative Alu-PCR. Reported results represent the medians from three independent experiments using DCs from different donors. Data were analyzed using the Mann-Whitney test (*,P⬍0.05).on November 7, 2019 by guest
http://jvi.asm.org/
[image:13.585.90.316.74.555.2]analysis that a strong change in gene expression was produced during the maturation
process (Fig. 4A). Overall, in MDCs increases in the expression of genes involved in class
I IFN responses, cell immune trafficking, and the cell-mediated immune response were
observed, in particular for BAX, IFI35, IFIT1, IFIT3, IFNG, IRF1, MX1, OAS1, STAT1, STAT2,
TAP1, and TYK2. These changes, as well as those observed in genes related to
proliferation and the cell cycle, were due exclusively to DC maturation in the absence
of cell infection and were similar using two different methods of DC maturation (LPS or
ITIP) (Fig. 4B).
The cellular environment of DCs is highly restrictive against viral infections (18, 51).
Among the mechanisms raising a barrier against infection, the induction of class I IFN
and ISGs plays a major role (1, 52). In addition, in the particular case of lentivirus,
restriction factors such as APOBEC3G, tetherin, and SAMHD1 provide additional specific
barriers against lentiviral infections (53, 54). SAMHD1 has been described as the main
factor involved in HIV-1 restriction in DCs. In fact, based on the capacity of lentiviruses
to infect cells of the myeloid lineage, two categories can be established. On one hand,
lentiviral species carrying the
vpx
gene, such as HIV-2 and SIV, are able to overcome the
restriction provided by SAMHD1 and productively infect DCs and macrophages (22). On
the other hand, Vpx-minus lentiviruses such as HIV-1 barely replicate in DCs.
Most studies on lentiviral restriction have been performed in IDCs but not in MDCs.
When IDCs are infected by lentiviruses, a maturation process is started and gene
expression changes are driven by two different forces: the infection itself and DC
maturation. In this work, we have analyzed changes in genetic expression that are
induced by HIV-1 infection itself in IDCs or in previously matured DCs. In addition, we
performed a systematic analysis of genes induced in both maturation stages when DCs
were infected under restrictive or productive conditions as defined by the absence
(restrictive) or the presence (productive) of Vpx. To obtain appropriate comparisons,
measurements of gene expression were performed at the same time to avoid bias due
to different stages of differentiation along DC culture. Working with dendritic cells
generated from healthy individuals presents some limitations, including the high
variability among donors. For that reason, experiments were performed several times
and with DCs generated from different donors to obtain robust results. Although the
model of
in vitro
differentiation of DCs does not reproduce exactly the phenotypic
characteristics of circulating or resident dendritic cells, this system can provide relevant
information regarding HIV restriction mechanisms.
A full-genome array analysis in IDCs and MDCs under conditions of productive
(Vpx
⫹) HIV-1 infection was performed at a high MOI. We choose this system in order to
increase the probability of detecting changes in gene expression because in this setting
the number of HIV-infected DCs strongly increases in the presence of Vpx, as previously
described. However, large differences in the percentage of productive infection were
observed between IDCs and MDCs (75% versus 25%), even in the presence of Vpx. To
demonstrate that these differences were not due to restriction of viral entry in MDCs,
viral fusion was depicted by a specific Blam-Vpr assay. We show (Fig. 2B) that fusion
occurred at levels previously described (55, 56), and no differences were found between
IDCs and MDCs. Because the percentage of Blam-positive cells (Fig. 2B) was lower than
the percentage of p24-positive cells (Fig. 2A), we analyzed the localization of incoming
capsids labeled with GFP by confocal microscopy to rule out attachment of viral
particles to the cell membrane (Fig. 2C). More than 50% of both IDCs and MDCs were
intracellularly labeled with GFP, thus confirming that viral entry was not limited under
the conditions of infection tested. Overall these data strongly suggest that the
differ-ences in infectivity found between IDCs and MDCs were not due to lower efficiency in
viral entry (Fig. 2A and B). Our data suggest that in the MDC environment, restriction
mechanisms other than SAMHD1 are important to block HIV-1 infection, because Vpx
expression and subsequent SAMHD1 degradation were not sufficient to overcome viral
restriction. In fact, we found a higher expression of APOBEC3G as well as increased
basal expression of ISGs in MDCs, which certainly plays a role in HIV-1 restriction in this
cell type, as previously reported (49, 50, 57, 58). In addition, APOBEC3A levels were also
on November 7, 2019 by guest
http://jvi.asm.org/
higher in MDCs than in IDCs, and interestingly, APOBEC3A was only partially degraded
by Vpx in MDCs (Fig. 1C). APOBEC3A is preferentially expressed in myeloid cells, and
their absence enhances viral DNA accumulation (59), is induced by class I IFN (60), and
has been defined as a restriction factor against different retroviruses (61). Finally,
2
=
-5
=
-oligoadenylate synthetase 1 (OAS1) has been recently identified as a candidate
HIV-1 restriction factor, since its overexpression significantly inhibited viral replication
without causing cytotoxic effects (25). Together with other cytokines, OAS1 contributes
to trigger a systemic innate immune response against viral replication in acute SIV
infection (62). An increase in OAS1 expression was found in noninfected MDCs
com-pared to noninfected IDCs. All these data suggest that SAMHD1 plays a major role in
the restriction of HIV-1 infection in IDCs, whereas in MDCs other factors, such as
APOBEC3G, APOBEC3A, or OAS1, also contribute significantly to restriction of viral
replication.
Overall, the expression of 371 genes was modified in IDCs after productive (Vpx
⫹)
infection, whereas 685 genes were up- or downregulated following infection in the
presence of Vpx in MDCs. Only 86 genes were shared by both cell types, pointing to the
induction of different programs of gene expression depending on the infected-cell
type. Functional analysis of array data confirmed different patterns of gene expression
in IDCs and MDCs after productive infection. Interestingly, whereas in IDCs a strong
expression of ISGs was found following infection, this pattern was not observed in
MDCs, in which a sharp decrease in genes involved in IFN signaling was observed (Fig.
3C). Among the most upregulated genes in IDCs, seven were ISGs. In contrast, in MDCs
there was a decrease in ISGs, in particular in CXCR3-binding chemokines and
APOBEC3A. These data suggest that IFN-sensing mechanisms are active in IDCs when
SAMHD1 is overcome by Vpx, whereas in MDCs HIV-1 triggers an active blockade of
IFN-dependent mechanisms after SAMHD1 degradation in the presence of Vpx.
Be-cause RNA extraction was performed at the same time point in infected and
nonin-fected DCs, the observed differences were not due to different steps in DC
differenti-ation but to a direct impact of HIV-1 infection on gene expression.
To confirm the array data, we assessed ISG expression using a wild-type R5-tropic
HIV-1 strain under conditions of productive (Vpx
⫹) and restrictive (Vpx
⫺) infection. In
IDCs the induction of ISG requires productive (Vpx
⫹) infection, as previously shown (38,
48). Similar results were observed when IDCs were infected with HIV-2. These data
confirm that the observed induction of ISGs by Vpx-loaded HIV-1 particles also occurs
when viral entry is produced through HIV receptors. In IDCs, sensing of HIV-1 and HIV-2
by cyclic GMP-AMP synthase (cGAS) is dependent on the detection of reverse
tran-scription products in the cytosol (37). Our results showing ISG induction after infection
of IDCs with HIV-1 plus Vpx or HIV-2, which degrade SAMHD1 and allow reverse
transcription, support a role for cGAS sensing under these conditions. Taking into
consideration the different virulence of HIV-1 and HIV-2, our data confirm previous
observations (22, 37, 45, 48) suggesting that through restriction of replication in DCs,
lentiviruses avoid triggering class I IFN responses. As a consequence and paradoxically,
low infection of DCs would result in higher virulence due to escape from early immune
surveillance, thereby allowing broader dissemination of infected cells. Recent data
showing the deleterious consequences of blocking early IFN responses in macaques
(52) support the concept that by avoiding recognition by sensors of innate immunity
and IFN production in DCs, lentiviruses increase their pathogenicity in the host.
Unexpectedly, the scenario in MDCs was completely different. The basal level of ISGs
was higher than in IDCs due to the process of maturation, as has been described
previously (48). However, HIV-1 infection under restrictive conditions (
⫺
Vpx) of MDCs
further increased different ISGs (63). Induction levels varied among the measured ISGs,
and in some cases differences were not statistically significant due to the variability
found among different donors, but trends were consistent. Differences between IDCs
and MDCs were not related to different viral inputs or restriction to viral entry, because
cells were infected with the same viral stocks and viral entry was similar. Of note, these
differences between IDCs and MDCs were not due to the use of LPS, as similar results
on November 7, 2019 by guest
http://jvi.asm.org/
were found when DCs were matured with ITIP (Fig. 4B) These findings suggest that
different sensors become active according to the maturation state of DCs. Actually,
different pathogen sensors can be found according to DC cell type and maturation (for
a review, see references 64 and 65).
Because SAMHD1 levels were similar in IDCs and MDCs, reverse transcription should
not take place in MDCs in the absence of Vpx, and this points to viral RNA as a potential
pathogen-associated molecular pattern (PAMP). Incoming viral RNA can trigger innate
immune responses through different sensors. In plasmacytoid dendritic cells, TLR7
detects HIV RNA within endosomes and induces IFN-
␣
(66), and in this process the
activation of IRF7 is essential to trigger TLR7-dependent activation. Interestingly, an
enrichment in IRF7-, STAT 1-, and STAT3-binding sites was found in the enhancers of
upregulated ISG in restrictive MDC infection (Fig. 6C). TLR7 was expressed at similar
levels in IDCs and MDCs, but IRF7 expression was enhanced 3-fold in MDCs compared
to IDCs, suggesting that the TLR7-IRF7 pathway can be active in MDCs, allowing sensing
of HIV-1 RNA (Fig. 5C). Also, whereas in IDCs there is low expression of RIG-I or MDA5,
these two cytosolic RNA sensors are induced following DC differentiation, as previously
described (67). These differences could explain why in IDCs viral RNA is not detected in
the cytosol or in the endosomal compartment, whereas in MDCs, in which RIG-I, MDA5,
and IRF7 are expressed, restrictive HIV-1 infection could elicit an IFN-mediated response
through RNA sensing.
When MDCs were infected under productive conditions, strong downregulation of
ISG expression was found. This pattern, which was observed in the functional analysis
of the array data and confirmed by quantitative PCR (qPCR) assays, was completely
unexpected. Not only there was not an upregulation of ISG as observed in IDCs, but an
“active” downregulation compared with basal expression levels of ISGs was found.
Different factors have been found to be involved in the inhibition of class I IFN
expression and intrinsic downregulation of ISGs, such as FOX3a, a key regulator of IFN-I
feedback (68), and OAS1L, a member of the OAS family that is induced by IFN and
inhibits translation of the transcription factor IRF7, thus negatively regulating type I
interferon production during viral infection (69). In our microarray data, OAS1 levels
were enhanced in MDCs compared to IDCs, which could contribute to an ISG decrease
following active HIV-1 infection. It has been described that productive HIV-1 infection
of IDCs induces a set of ISGs driven by IRF1 and IRF7, in addition to inducing maturation
in a dose-dependent manner (70). Our data showing enrichment in the expression of
IRF7-dependent ISGs support this hypothesis. However, it has been described that
persistent induction of IRF1 resulted in upregulation of IRF2 and IRF8 that in turn
decreased IFN expression (71). Work in progress in our lab is trying to define if
productive HIV-1 infection of MDCs triggers a switch from IRF1/IRF7 to IRF2/IRF8
expression and the potential role of OAS in this process.
Finally, chemokines binding CXCR3 receptors, such as CXCL9 and CXCL10, were
severely diminished in the context of productive infection of MDCs. CXCR3-binding
chemokines are key regulators of lymphocyte trafficking (72) and are particularly
involved in chemotaxis of CD4 lymphocytes and priming of CD4-DC interactions in the
immune synapse (73). The increase in the production of these chemokines as was
observed in MDCs infected under restrictive conditions would result in better
recruit-ment of CD4 lymphocytes at the immune synapse. Paradoxically, in the particular case
of HIV infection, a normal immune response like chemokine production would result in
higher rate of
trans
-infection due to the high susceptibility to infection of CD4
lym-phocytes in the immune synapse. Actually, it has been previously described (63) that
the increase of IFN-
␣
production by DCs results in higher expression of SIGLEC-1, which
in turns causes an enhancement of HIV infection of CD4
⫹T lymphocytes. In this article
we describe another mechanism, chemokine production, that contributes to
enhance-ment of HIV infection and dissemination in the immune synapse. In contrast, a decrease
in chemokine levels, as was observed in the productive infection of MDCs, would result
in loss of CD4 chemoattraction and lessened infection in the immune synapse.
Fur-thermore, it has been described that these chemokines are involved in the induction of
on November 7, 2019 by guest
http://jvi.asm.org/
efficient latent proviral integration in IL-2-activated CD4 lymphocytes (74–76).
Accord-ingly, we describe that
trans
-infection and viral integration in CD4 lymphocytes were
decreased when autologous lymphocytes were cocultured with MDCs previously
in-fected with Vpx-loaded particles.
It has been proposed that differences in virulence between HIV-1 and HIV-2 could
be related to different efficiency in infecting DCs. Actually, it has been shown that
productive infection of IDCs by HIV-1 (38, 48) and HIV-2 (37) increases ISG expression,
leading to early activation of innate immune responses and control of HIV infection.
In this work, we confirm this effect and provide a new mechanism to explain
increased HIV-1 virulence despite restriction of MDC infection. A reduction in
CXCR3-binding chemokines following productive HIV-1 infection of MDCs would decrease CD4
recruitment and
trans
-infection in the immune synapse. In contrast, sensing of HIV-1
entry by MDCs would induce the expression of ISGs that on one hand would restrict
MDCs infection but on the other hand would increase the synthesis of CXCR3-binding
chemokines that enhance lymphocyte recruitment and infection in the immune
syn-apse.
MATERIALS AND METHODS
Antibodies. CD14, CD83, and CD209 were detected by flow cytometry, using phycoerythrin-conjugated monoclonal antibodies (MAbs) from clones M5E2, HB15e, and DCN46 (BD Biosciences). Anti-Gag antibodies (KC57 clone; Beckman Coulter) were used in intracellular staining to quantify viral entry.
For Western blotting, SAMHD1 antibody from Abcam and APOBEC3A antibody from Santa Cruz Biotechnology were used. APOBEC3G antibody was kindly provided by Montse Plana and Teresa Gallart (Clinic Hospital, Barcelona, Spain).
Cell culture.Human DCs were generated from peripheral blood monocytes by treatment with granulocyte-macrophage colony-stimulating factor (GM-CSF) and interleukin-4 (IL-4) as described previ-ously (77). Peripheral blood mononuclear cells were isolated from buffy coat preparations from healthy donors (Transfusions Centre, Madrid, Spain) by Ficoll-Hypaque centrifugation, followed by plastic adher-ence to enrich monocytes. The nonadherent cell fraction was removed and used for T-cell isolation as described below. To obtain IDCs, adherent cells were cultured in RPMI medium supplemented with 10% heat-inactivated fetal bovine serum (FBS) with 2 mML-glutamine, 100g/ml streptomycin, and 100 U/ml penicillin in the presence of GM-CSF (20 ng/ml; R&D Systems) and IL-4 (20 ng/ml; R&D Systems) at 37°C in a 5% CO2atmosphere for 5 to 10 days. DCs were matured into MDCs using two different approaches:
with 20 ng/ml lipopolysaccharide (LPS) (Sigma-Aldrich) or with a cytokine cocktail (300 IU/ml IL-1and 1,000 IU/ml IL-6 [Peprotech], 1,000 IU/ml TNF-␣[R&D Systems], and 1g/ml PGE2[Sigma-Aldrich]) (ITIP)
for 48 h. The status of differentiation and maturation was confirmed by observing the typical morphology and by assessing immunofluorescence for standard cell surface markers by flow cytometry, including monocyte-specific CD14, dendritic cell-specific CD209 (DC-SIGN), and CD83 as specific marker of MDCs (data not shown). Infection experiments were pursued only when⬎90% of cells in culture displayed a CD209-positive phenotype. In those experiments in which MDCs were required, more than 90% matu-ration was required to proceed with transcriptome and infection experiments.
Construction of proviral clones.The vector pNL4-3ΔenvGFP was generated by cloning the GFP gene in the plasmid pNL4-3.Luc.R-E- (National Institutes of Health AIDS Research and Reference Reagent Program, catalogue number 3418). The GFP gene was amplified using as a template pEGFP-N1 plasmid (Clontech) and the primers Not-GYC-Up (5=-ATAAGAATGCGGCCGCTGTGAGCAAGGGCGAGGAGCTGTTC ACC-3=) and Xho-GYC-Down (5=-CCGCTCGAGTTACTTGTACAGCTCGTCCATGCCGAG-3=) and then was di-gested with NotI and XhoI and inserted in the same sites of pNL4-3.Luc.R-E-, thus replacing the luciferase reporter gene. The pcDNA-VSV plasmid containing cDNA encoding the vesicular stomatitis virus glyco-protein (VSV-G) was kindly provided by F. Arenzana-Seisdedos (Institute Pasteur, Paris, France). The pIRES-Vpx plasmid (Clontech) containing cDNA encoding the Vpx viral protein was kindly provided by Mario Stevenson (University of Miami) (39). The pJR-Ren plasmid was generated by cloning gp160 from the JR-FL clone (R5 tropism) in place of the NL4-3 env gene in pNL4-3Ren (77). pROD10 (78) is an infectious molecular clone of HIV-2 rod, provided by Beatrice Labrosse (Diderot University, Paris, France). HIV-1 Gag-GFP was provided by Sonsoles Sanchez Palomino, Hospital Clinic, Barcelona, Spain.
Generation of virus stocks and DC infection.To generate viral stocks, 5⫻105HEK-293T cells
(National Institute for Biological Standards and Control [NIBSC]) were plated in 6-well tissue culture plates and transfected with 10g of purified DNA construct plasmids using the calcium phosphate technique (79). Culture medium was replaced with fresh Dulbecco modified Eagle medium (DMEM) at 8 h and 24 h after transfection, and cell supernatants were harvested at 48 h after transfection, clarified by centrifugation at 500⫻gfor 5 min, and frozen in aliquots at⫺80°C. p24 CA viral antigen in the supernatants was quantified using Elecsys HIV Ag (Roche Diagnostics). Viral particles carrying Vpx were produced through cotransfection of Vpx-expressing plasmid with the different full-length viral vectors in the following proportions: JR-Ren and Vpx at 1:2 and pNL4-3ΔenvGFP, pcDNA-VSV, and Vpx at:2:2. Viral stocks were titrated using the TZM-bl cell lines, and levels of CA-p24 were measured. For infection experiments, high titers were used (MOI of between 3 and 10; 200 ng of CA-p24/well).
on November 7, 2019 by guest
http://jvi.asm.org/
IDCs and MDCs (3⫻106to 5⫻106per well in a 6-well plate) were incubated with VSV-ΔenvGFP and
VSV-ΔenvGFP⫹Vpx (200 ng of CA-p24) for different times at 37°C. To assess viral entry, after extensive washing, CA-p24 antigen was detected by Elecsys HIV Ag at 8 h after infection. Infected cells were analyzed by flow cytometry on a FACSCalibur instrument (Becton Dickinson), quantifying GFP expression when GFP reporter viral clones were used.
HIV-1 virion-based fusion assay. HIV-1 particles containing -lactamase–Vpr chimeric proteins (BlaM-Vpr) were produced by cotransfection of HEK293T cells with the different HIV vectors (NL4-3LucR_E_⫹pcDNA-VSV, pJR-Ren, and pROD10) and pCMV-BlaM-Vpr. After 48 h of culture at 37°C, the virus-containing supernatant was centrifuged at low speed to remove cellular debris and aliquoted for storage at⫺80°C. Following 5 min of incubation of the control samples with maraviroc (5M), 1⫻105
IDCs and MDCs were inoculated with the BlaM-Vpr-containing viruses (50 ng p24 Gag) by 1 h of spinoculation at 4°C and incubated for 2 h at 37°C. Cells were washed with CO2-independent medium
(Gibco-Life Technologies) and then incubated with CCF2/AM dye for 2 h at room temperature in CO2-independent medium supplemented with 10% FBS. Cells were then washed with CO2-independent
medium and fixed in 2% paraformaldehyde (PFA). Enzymatic cleavage of CCF2/AM by-lactamase (the readout of viral entry fusion) was measured by flow cytometry (MACSQuant Analyzer 10; Miltenyi Biotec), and data were analyzed with FlowJo software. The percentage of fusion corresponds to the percentage of cells displaying increased cleaved CCF2/AM fluorescence (447 nm).
Immunofluorescence assay.For immunofluorescence assays, cells were infected with HIV-1 Gag-GFP. After 1 h, cells were immobilized on PolyPrep slides (Sigma-Aldrich) for 15 min and then fixed with 2% PFA– 0.025% glutaraldehyde in 1⫻phosphate-buffered saline (PBS) for 10 min at room temperature. After washing twice with 0.1% glycine–/PBS, cells were permeabilized with 0.1% Triton X-100 –PBS. Incubation with primary and secondary antibodies and subsequent washes were performed with 1⫻ PBS–2% bovine serum albumin (BSA)– 0.05% saponin buffer. 4=,6-Diamidino-2-phenylindole (DAPI) was used for nuclear staining, while tubulin primary antibody (Sigma-Aldrich) was used with goat anti-mouse antibody conjugated with Alexa 546 (Molecular Probes). Images were obtained with a Leica TCS-SP confocal microscope or a Leica DMI 4000B inverted microscope (Leica Microsystems, Wetzlar, Germany). Up to 100 cells of each type (IDCs and MDCs) were counted to calculate the percentage of infected cells, measuring the presence of GFP particles inside the cells.
RNA isolation.Total RNA from infected cells was extracted with an RNeasy minikit (Qiagen).
Microarray assay.The Quick-Amp labeling kit (Agilent) was used for labeling. Briefly, 800 ng of total RNA was reverse transcribed using the T7 promoter primer and the Moloney murine leukemia virus (MMLV) reverse transcriptase (RT). cDNA was then converted to antisense RNA (aRNA) by using T7 RNA polymerase, which amplifies target material and incorporates cyanine 3 (Cy3)-labeled CTP simultane-ously.
Samples were hybridized to a 4x44K whole human genome microarray (G4112F; Agilent Technolo-gies), and 1.65g of Cy3-labeled aRNA was hybridized for 17 h at 65°C in an Agilent hybridization oven (G2545A; Agilent Technologies) set to 10 rpm in a final concentration of 1⫻GEx HI-RPM hybridization buffer (Agilent Technologies). Arrays were washed and dried using a centrifuge according to the manufacturer’s instructions (One-Color Microarray-Based Gene Expression Analysis; Agilent Technolo-gies). Arrays were scanned at 5-m resolution on an Agilent DNA microarray scanner (G2565BA; Agilent Technologies) using the default settings for 4x44k format one-color arrays. Images provided by the scanner were analyzed using Feature Extraction software v10.7 (Agilent Technologies).
Data files from the Feature Extraction software were imported into GeneSpring GX software v9.0 (Agilent Technologies). Quantile normalization was performed, and expression values (log2transformed)
were obtained for each probe. Probes were also flagged as present, marginal, or absent using the GeneSpring default settings. Probes that were flagged as present or marginal in all three replicates for the two experimental conditions to be compared on each contrast were selected for further analysis. These filtered data were loaded into SAM (Significance Analysis of Microarrays) software for genomic expression data mining (Tusher). SAM uses the false-discovery rate (FDR) and q-value method as described by Chen and Storey (80). Expression ratios (log2) were calculated using control cell values as
a baseline. For considering a fold change to be statistically significant, theq-value cutoff was set at 5%. Functional and canonical pathway analyses of specific gene data sets coming from SAM analysis were performed by using Ingenuity Pathway Analysis (Ingenuity Systems, Redwood City, CA, USA). Functional analysis was performed to identify functions and/or diseases that were most significant to the data set. All genes from the data set that were associated with biological functions and/or diseases in the Ingenuity knowledge database were considered for the analysis. The B-H multiple-testing correctionP
value test (Klipperaurbach) was used to calculate thePvalue for determining the probability that each biological function and/or disease assigned to the data set was due to chance alone. Canonical pathway analysis identified from the Ingenuity Pathway Analysis library those pathways that were more significant to the data set. All genes associated with a canonical pathway in the Ingenuity knowledge base were considered for the analysis. The significance of the association between the data set and the canonical pathway was measured in two ways: (i) the number of genes from the data set that map to the pathway divided by the total number of molecules that exist in the canonical pathway was determined, and (ii) the B-H multiple-testing correction Pvalue test was used to calculate aPvalue to determine the probability that the association between the genes in the data set and the canonical pathway was due to chance alone.
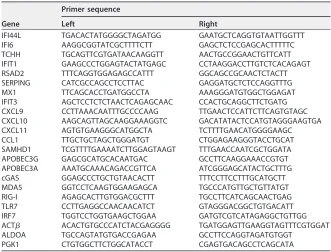
Real-time qRT-PCR.One microgram of total RNA was used for first-strand cDNA synthesis with Im-Prom RT (Promega) using a dT primer. Quantitative PCR (qPCR) analysis was performed using SYBR green PCR master mix (Applied Biosystems) according to the manufacturer’s recommendation
on November 7, 2019 by guest
http://jvi.asm.org/
in an ABI Prism7500 instrument (Applied Biosystems). The fragments were amplified with the primer sets given in Table 2. Standard curves were constructed for each PCR fragment, the reference, and the target. Amplification was real-time monitored and allowed to proceed in the exponential phase until the fluorescent signal reached a significant value (threshold cycle [CT]) value. The method used
for relative quantification was the 2⫺ΔΔCTmeasure. A set of three different housekeeping genes was
used for normalization: Actin, beta (ACTB) (ENST00000331789); phosphoglycerate kinase 1 (PGK1) (ENST00000373316); and aldolase A, fructose-bisphosphate (ALDOA) (ENST00000564546). These genes were selected by two criteria: (i) their expression is not altered between the compared conditions, and (ii) they are not functionally related.
Statistical analysis.Statistical analysis was performed using GraphPad Prism 5.0 (GraphPad Software Inc., San Diego, CA). Comparisons between control and infected groups were made using the Mann-Whitney nonparametric test to describe the statistical differences among groups.Pvalues of⬍0.05 were considered statistically significant in all comparisons.
ELISA.To measure the chemokine levels in infected supernatants, a human extracellular protein buffer reagent kit (Life Technologies) combined with MIG (CXCL9) and IP-10 (CXCL10) human singleplex bead kits was used according to manufacturer’s instructions in a Bio-Plex 200 instrument (Bio-Rad). Beads for CXCL11 were not available.
Immunoblotting.Total protein extracts were obtained as described previously (81), and protein concentrations were determined by the Bradford method using a BSA standard curve. 30g of total protein were fractionated by SDS-PAGE and transferred onto Hybond-ECL nitrocellulose paper (GE Healthcare). After blocking and incubation with primary antibodies against SAMHD1 (ab128107; Abcam) and APOBEC3A (sc-130688; Santa Cruz Biotechnology), proteins were detected with SuperSignal West Pico chemiluminescent substrate (Pierce, Rockford, IL).
trans-infection.MDCs were infected with VSV-ΔenvGFP (200 ng of CA-p24) with or without Vpx and were incubated with chemokines (CXCL9 and CXCL10; R&D) at 100 nM. After 3 days, infection was analyzed by flow cytometry, and MDCs, previously infected with VSV-ΔenvGFP, were incubated with HIV-1 JR-Ren (200 ng of CA-p24) for 2 h at 37°C to allow adsorption of the virus. The cells were then washed in PBS to remove unbound virus and cocultured with 5 ⫻ 106 IL-2-activated autologous
lymphocytes in a 6-well plate. Three days after infection with JR-Ren, T CD4⫹cells were purified by positive magnetic selection (Dynabeads FlowComp human CD4 kit; Invitrogen). Purified T CD4⫹cells were collected to measure luciferase activity in the cell lysates with a luciferase reporter assay kit using a Sirius luminometer (Berthold Detection Systems) and to assess HIV-1 integration by quantitative PCR.
[image:19.585.40.371.81.333.2]Quantification of proviral integration by TaqMan qPCR.Whole genomic DNA was extracted from purified CD4⫹T cells by using a QIAamp DNA blood minikit (Qiagen) and quantified at 260/280 nm using a NanoDrop 2000C instrument (Thermo Scientific). Proviral integrated DNA was quantified by using a nested Alu-LTR PCR as previously described (43, 44), using a StepOne real-time PCR system (Applied Biosystems). In brief, first a conventional PCR was performed using oligonucleotides against the Alu sequence and the HIV-1 long terminal repeat (LTR) with the following conditions: 95°C for 8 min; 12 cycles of 95°C for 1 min, 60°C for 1 min, and 72°C for 10 min; and 1 cycle of 72°C for 15 min. A second qPCR was then performed using TaqMan probes with FAM/ZEN/Iowa Black and TaqMan master mix TABLE 2Primer set used for qPCR
Gene
Primer sequence
Left Right
IFI44L TGACACTATGGGGCTAGATGG GAATGCTCAGGTGTAATTGGTTT IFI6 AAGGCGGTATCGCTTTTCTT GAGCTCTCCGAGCACTTTTTC TCHH TGCAGTTCGTGATAACAAGGTT AACTGCCGGAACTGTTCATT IFIT1 GAAGCCCTGGAGTACTATGAGC CCTAAGGACCTTGTCTCACAGAGT RSAD2 TTTCAGGTGGAGAGCCATTT GGCAGCCGCAACTCTACTT SERPING CATCGCCAGCCTCCTTAC GAGGATGCTCTCCAGGTTTG MX1 TTCAGCACCTGATGGCCTA AAAGGGATGTGGCTGGAGAT IFIT3 AGCTCCTCTCTAACTCAGAGCAAC CCACTGCAGGCTTCTGATG CXCL9 CCTTAAACAATTTGCCCCAAG TTGAACTCCATTCTTCAGTGTAGC CXCL10 AAGCAGTTAGCAAGGAAAGGTC GACATATACTCCATGTAGGGAAGTGA CXCL11 AGTGTGAAGGGCATGGCTA TCTTTTGAACATGGGGAAGC CCL1 TTGCTGCTAGCTGGGATGT CTGGAGAAGGGTACCTGCAT SAMHD1 TCGTTTTGAAAATCTTGGAGTAAGT TTTGAACCAATCGCTGGATA APOBEC3G GAGCGCATGCACAATGAC GCCTTCAAGGAAACCGTGT APOBEC3A AAATGCAAACAGACCGTTCA ATCGGGAGCATACTGCTTTG cGAS GGAGCCCTGCTGTAACACTT TTTCCTTCCTTTGCATGCTT MDA5 GGTCCTCAAGTGGAAGAGCA TGCCCATGTTGCTGTTATGT RIG-I AGAGCACTTGTGGACGCTTT TGCCTTCATCAGCAACTGAG TLR7 CCTTGAGGCCAACAACATCT GTAGGGACGGCTGTGACATT IRF7 TGGTCCTGGTGAAGCTGGAA GATGTCGTCATAGAGGCTGTTGG ACT ACACTGTGCCCATCTACGAGGGG TGATGGAGTTGAAGGTAGTTTCGTGGAT ALDOA TGCCAGTATGTGACCGAGAA GCCTTCCAGGTAGATGTGGT
PGK1 CTGTGGCTTCTGGCATACCT CGAGTGACAGCCTCAGCATA
on November 7, 2019 by guest
http://jvi.asm.org/
(Applied Biosystems). CCR5 was used as housekeeping gene for measuring the input DNA and to normalize data.
Accession number(s).The data discussed in this publication have been deposited in NCBI’s Gene Expression Omnibus and are accessible through GEO series accession numberGSE68191.
ACKNOWLEDGMENTS
We greatly appreciate the secretarial assistance of Olga Palao. We thank the Centro
Regional de Transfusión (Toledo, Spain) for supplying the buffy coats. We also thank
Javier Martínez-Picado and Maria del Carmen Puertas (IrsiCaixa Institute) for their help
with the standardization of qPCR in our laboratory.
REFERENCES
1. Banchereau J, Steinman RM. 1998. Dendritic cells and the control of immunity. Nature 392:245–252.https://doi.org/10.1038/32588. 2. Jiang H, van de Ven C, Baxi VL, Satwani P, Cairo MS. 2009. Differential
gene expression signatures of adult peripheral blood vs cord blood monocyte-derived immature and mature dendritic cells. Exp Hematol 37:1201–1215.https://doi.org/10.1016/j.exphem.2009.07.010.
3. Le NF, Hohenkirk L, Grolleau A, Misek DE, Lescure P, Geiger JD, Hanash S, Beretta L. 2001. Profiling changes in gene expression during differen-tiation and maturation of monocyte-derived dendritic cells using both oligonucleotide microarrays and proteomics. J Biol Chem 276: 17920 –17931.https://doi.org/10.1074/jbc.M100156200.
4. Richards J, Le NF, Hanash S, Beretta L. 2002. Integrated genomic and proteomic analysis of signaling pathways in dendritic cell differentiation and maturation. Ann N Y Acad Sci 975:91–100.https://doi.org/10.1111/ j.1749-6632.2002.tb05944.x.
5. Gonzalez N, Bermejo M, Calonge E, Jolly C, Arenzana-Seisdedos F, Pablos JL, Sattentau QJ, Alcami J. 2010. SDF-1/CXCL12 production by mature dendritic cells inhibits the propagation of X4-tropic HIV-1 isolates at the dendritic cell-T-cell infectious synapse. J Virol 84:4341– 4351.https:// doi.org/10.1128/JVI.02449-09.
6. Dieu MC, Vanbervliet B, Vicari A, Bridon JM, Oldham E, Ait-Yahia S, Briere F, Zlotnik A, Lebecque S, Caux C. 1998. Selective recruitment of imma-ture and maimma-ture dendritic cells by distinct chemokines expressed in different anatomic sites. J Exp Med 188:373–386. https://doi.org/ 10.1084/jem.188.2.373.
7. Sallusto F, Lanzavecchia A. 2000. Understanding dendritic cell and T-lymphocyte traffic through the analysis of chemokine receptor expres-sion. Immunol Rev 177:134 –140.https://doi.org/10.1034/j.1600-065X .2000.17717.x.
8. Sozzani S, Allavena P, D’Amico G, Luini W, Bianchi G, Kataura M, Imai T, Yoshie O, Bonecchi R, Mantovani A. 1998. Differential regulation of chemokine receptors during dendritic cell maturation: a model for their trafficking properties. J Immunol 161:1083–1086.
9. Randolph GJ. 2001. Dendritic cell migration to lymph nodes: cytokines, chemokines, and lipid mediators. Semin Immunol 13:267–274.https:// doi.org/10.1006/smim.2001.0322.
10. Piguet V, Steinman RM. 2007. The interaction of HIV with dendritic cells: outcomes and pathways. Trends Immunol 28:503–510.https://doi.org/ 10.1016/j.it.2007.07.010.
11. Trapp S, Derby NR, Singer R, Shaw A, Williams VG, Turville SG, Bess JW, Jr, Lifson JD, Robbiani M. 2009. Double-stranded RNA analog poly(I:C) inhibits human immunodeficiency virus amplification in dendritic cells via type I interferon-mediated activation of APOBEC3G. J Virol 83: 884 – 895.https://doi.org/10.1128/JVI.00023-08.
12. Izquierdo-Useros N, Lorizate M, McLaren PJ, Telenti A, Krausslich HG, Martinez-Picado J. 2014. HIV-1 capture and transmission by dendritic cells: the role of viral glycolipids and the cellular receptor Siglec-1. PLoS Pathog 10:e1004146.https://doi.org/10.1371/journal.ppat.1004146. 13. Izquierdo-Useros N, Lorizate M, Puertas MC, Rodriguez-Plata MT,
Zang-ger N, Erikson E, Pino M, Erkizia I, Glass B, Clotet B, Keppler OT, Telenti A, Krausslich HG, Martinez-Picado J. 2012. Siglec-1 is a novel dendritic cell receptor that mediates HIV-1 trans-infection through recognition of viral membrane gangliosides. PLoS Biol 10:e1001448.https://doi.org/ 10.1371/journal.pbio.1001448.
14. Geijtenbeek TB, Kwon DS, Torensma R, van Vliet SJ, van Duijnhoven GC, Middel J, Cornelissen IL, Nottet HS, Kewalramani VN, Littman DR, Figdor CG, van KY. 2000. DC-SIGN, a dendritic cell-specific HIV-1-binding protein
that enhances trans-infection of T cells. Cell 100:587–597. https:// doi.org/10.1016/S0092-8674(00)80694-7.
15. Izquierdo-Useros N, Naranjo-Gomez M, Erkizia I, Puertas MC, Borras FE, Blanco J, Martinez-Picado J. 2010. HIV and mature dendritic cells: Trojan exosomes riding the Trojan horse? PLoS Pathog 6:e1000740.https:// doi.org/10.1371/journal.ppat.1000740.
16. McDonald D, Wu L, Bohks SM, Kewalramani VN, Unutmaz D, Hope TJ. 2003. Recruitment of HIV and its receptors to dendritic cell-T cell junc-tions. Science 300:1295–1297.https://doi.org/10.1126/science.1084238. 17. Granelli-Piperno A, Delgado E, Finkel V, Paxton W, Steinman RM. 1998. Immature dendritic cells selectively replicate macrophaget-ropic (M-tmacrophaget-ropic) human immunodeficiency virus type 1, while mature cells efficiently transmit both M- and T-tropic virus to T cells. J Virol 72:2733–2737.
18. Smed-Sorensen A, Lore K, Vasudevan J, Louder MK, Andersson J, Mas-cola JR, Spetz AL, Koup RA. 2005. Differential susceptibility to human immunodeficiency virus type 1 infection of myeloid and plasmacytoid dendritic cells. J Virol 79:8861– 8869. https://doi.org/10.1128/JVI.79 .14.8861-8869.2005.
19. Neil SJ, Zang T, Bieniasz PD. 2008. Tetherin inhibits retrovirus release and is antagonized by HIV-1 Vpu. Nature 451:425– 430. https://doi.org/ 10.1038/nature06553.
20. Sheehy AM, Gaddis NC, Choi JD, Malim MH. 2002. Isolation of a human gene that inhibits HIV-1 infection and is suppressed by the viral Vif protein. Nature 418:646 – 650.https://doi.org/10.1038/nature00939. 21. Stremlau M, Owens CM, Perron MJ, Kiessling M, Autissier P, Sodroski J.
2004. The cytoplasmic body component TRIM5alpha restricts HIV-1 infection in Old World monkeys. Nature 427:848 – 853.https://doi.org/ 10.1038/nature02343.
22. Laguette N, Sobhian B, Casartelli N, Ringeard M, Chable-Bessia C, Segeral E, Yatim A, Emiliani S, Schwartz O, Benkirane M. 2011. SAMHD1 is the dendritic- and myeloid-cell-specific HIV-1 restriction factor counteracted by Vpx. Nature 474:654 – 657.https://doi.org/10.1038/nature10117. 23. Monroe KM, Yang Z, Johnson JR, Geng X, Doitsh G, Krogan NJ, Greene
WC. 2014. IFI16 DNA sensor is required for death of lymphoid CD4 T cells abortively infected with HIV. Science 343:428 – 432. https://doi.org/ 10.1126/science.1243640.
24. Rasaiyaah J, Tan CP, Fletcher AJ, Price AJ, Blondeau C, Hilditch L, Jacques DA, Selwood DL, James LC, Noursadeghi M, Towers GJ. 2013. HIV-1 evades innate immune recognition through specific cofactor recruit-ment. Nature 503:402– 405.https://doi.org/10.1038/nature12769. 25. McLaren PJ, Gawanbacht A, Pyndiah N, Krapp C, Hotter D, Kluge SF, Gotz
N, Heilmann J, Mack K, Sauter D, Thompson D, Perreaud J, Rausell A, Munoz M, Ciuffi A, Kirchhoff F, Telenti A. 2015. Identification of potential HIV restriction factors by combining evolutionary genomic signatures with functional analyses. Retrovirology 12:41.https://doi.org/10.1186/ s12977-015-0165-5.
26. Schaller T, Ocwieja KE, Rasaiyaah J, Price AJ, Brady TL, Roth SL, Hue S, Fletcher AJ, Lee K, Kewalramani VN, Noursadeghi M, Jenner RG, James LC, Bushman FD, Towers GJ. 2011.