This is a repository copy of
A framework for 3D vessel analysis using whole slide images
of liver tissue sections
.
White Rose Research Online URL for this paper:
http://eprints.whiterose.ac.uk/89127/
Version: Accepted Version
Article:
Liang, Y, Wang, F, Treanor, D et al. (5 more authors) (2016) A framework for 3D vessel
analysis using whole slide images of liver tissue sections. International Journal of
Computational Biology and Drug Design, 9 (1/2). pp. 102-119. ISSN 1756-0756
https://doi.org/10.1504/IJCBDD.2016.074983
[email protected] https://eprints.whiterose.ac.uk/
Reuse
Unless indicated otherwise, fulltext items are protected by copyright with all rights reserved. The copyright exception in section 29 of the Copyright, Designs and Patents Act 1988 allows the making of a single copy solely for the purpose of non-commercial research or private study within the limits of fair dealing. The publisher or other rights-holder may allow further reproduction and re-use of this version - refer to the White Rose Research Online record for this item. Where records identify the publisher as the copyright holder, users can verify any specific terms of use on the publisher’s website.
Takedown
If you consider content in White Rose Research Online to be in breach of UK law, please notify us by
A Framework for 3D Vessel Analysis using Whole Slide
Images of Liver Tissue Sections
Yanhui Liang
Department of Biomedical Informatics, Emory University,
Atlanta, GA, 30322 USA E-mail: [email protected]
Fusheng Wang
Department of Biomedical Informatics, Emory University,
Atlanta, GA, 30322 USA
E-mail: [email protected]
Darren Treanor
Department of Pathology Leeds Teaching Hospitals NHS Trust Leeds Institute of Cancer and Pathology
The University of Leeds,
Leeds, LS9 7TF United Kingdom E-mail: [email protected]
Derek Magee
School of Computing, The University of Leeds, Leeds, LS2 9JT United Kingdom E-mail: [email protected]
Nick Roberts
Leeds Institute of Cancer and Pathology The University of Leeds,
Leeds, LS9 7TF United Kingdom E-mail: [email protected]
George Teodoro
Department of Computer Science,
University of Brasília,
Brasília, DF, 70910-900 Brazil E-mail: [email protected]
Yangyang Zhu
Department of Mathematics and Computer Science, Emory University,
Atlanta, GA, 30322 USA
E-mail: [email protected]
Jun Kong
⋆Department of Biomedical Informatics, Emory University,
Atlanta, GA, 30322 USA E-mail: [email protected] ∗Corresponding author
Abstract:Three-dimensional (3D) high resolution microscopic images have high potential for improving the understanding of both normal and disease processes where structural changes or spatial relationship of disease features are significant. In this paper, we develop a complete framework applicable to 3D pathology analytical imaging, with an application to whole slide images of sequential liver slices for 3D vessel structure analysis. The analysis workflow consists of image registration, segmentation, vessel cross-section association, interpolation, and volumetric rendering. To identify biologically-meaningful correspondence across adjacent slides, we formulate a similarity function for four association cases. The optimal solution is then obtained by constrained Integer Programming. We quantitatively and qualitatively compare our vessel reconstruction results with human annotations. Validation results indicate a satisfactory concordance as measured both by region-based and distance-based metrics. These results demonstrate a promising 3D vessel analysis framework for whole slide images of liver tissue sections.
Keywords:Whole Slide Imaging; Digital Pathology; Pathology Image Analysis; 3D Vessel Structure; Liver Pathology.
Referenceto this paper should be made as follows: Liang, Y.H., Wang, F.S., Treanor, D., Magee, D., Teodoro, G., Roberts, N., Zhu, Y.Y., and Kong, J. (2014) ‘A Framework for 3D Vessel Analysis using Whole Slide Images of Liver Tissue Sections’,Int. J. Computational Biology and Drug Design, Vol. x, No. x, pp.xxx–xxx.
Biographical notes:Yanhui Liang is a PhD student on Biomedical Informatics track in the Department of Mathematics and Computer Science at Emory University.
Imaging Informatics, Heterogeneous Data Management and Integration, Clinical Natural Language Processing, and Data Semantics and Standardization.
Darren Treanor is a consultant liver and gastrointestinal pathologist at Leeds Teaching Hospitals NHS Trust, UK, and an honorary senior lecturer at the Leeds Institute of Molecular Medicine, University of Leeds.
Derek Magee is a lecturer within the School of Computing at the University of Leeds. His main research interests are in the medical domain, relating to medical image/volume (MRI, CT, PET and ultrasound) analysis and surgical simulation, and in visual surveillance, analysis of remote sensing data, and visual learning.
Nick Roberts is a research student in Lees Institute of Cancer and Pathology at the University of Leeds. He works in the Digital Pathology Team specializing in the 3D reconstruction and 3D modeling of a range of different tissues.
George Teodoro holds a PhD Degree in Computer Science from the Universidade Federal de Minas Gerais, Belo Horizonte, Brazil, and a MS Degree from the same university. His primary areas of expertise include high performance computing runtime systems to support efficient execution of biomedical and data-mining applications on distributed heterogeneous environments.
Yangyang Zhu is a Master student on Computational Science track in the Department of Mathematics and Computer Science at Emory University.
Jun Kong is an assistant Professor at Department of Biomedical Informatics at Emory University. His research interests include biomedical image analysis, computer-aided diagnosis, machine learning, whole slide image processing, computer vision, bioimaging informatics, and signal processing for large-scale biomedical translational research.
This paper is a revised and expanded version of a paper entitled ‘A Framework for 3D Vessel Analysis with Whole Slide Images of Serial Liver Sections’ presented at ‘International Conference on Intelligent Biology and Medicine (ICIBM 2014), San Antonio, TX USA, December 4-6 , 2014’
1 Introduction
al., 2007). This results in a significant potential utility of whole slide image analysis and the quantitative characterization of pathological structures. A large suite of imaging analytical methods for quantitative analysis of pathology images has, therefore, been developed to meet these needs ( Qi et al., 2012; Foran et al., 2011; Yang et al., 2008; Teodoro et al., 2013). In addition, commercial and open-source products are also available (Aperio, Definiens, ImageJ, among others). However, these tools are bounded by 2D biological structure analysis and limited for processing objects in 3D space.
As micro-anatomic objects in 2D pathology images are only approximate representations of their true 3D structures, information is substantially lost when 3D structures are projected to the 2D image focal plane. In liver disease diagnosis, for instance, structural changes in liver vessels and their spatial relationships in 3D are important (Roberts et al., 2012). 2D profiles of blood vessels in microscopy images of liver tissue are highly dependent on the location and angle of the cutting plane during tissue slide preparation and are substantially different from their 3D shapes in most cases. By contrast, a sequence of microscopy images of liver tissue slices allows for analysis of vessels in 3D space. Therefore, it presents better potential to improve vessel characterization accuracy and to support disease diagnosis and understanding.
Numerous studies on modeling and analysis of vessel structures have been proposed, ranging from vessel segmentation (Lesage et al., 2009), vessel structure tracking (Friman et al., 2009), to the 3D visualization of vascular structures (Kubisch et al., 2012). However, these investigations are limited to either radiology images (such as Computed Tomography, and Magnetic Resonance Imaging), or 3D contrast-enhanced imaging modalities (including Computed Tomography Angiography and Magnetic Resonance Angiography). Compared with radiology image modalities, digital pathology images have much higher resolutions and contain a wealth of information at the cellular level. Therefore, applying 3D vessel analysis methods for radiology images directly to whole slide images is not feasible. Other vessel studies involve the usage of Optical Coherent Tomography (OCT) and confocal microscopy imaging data (Hu et al., 2010; Arribas et al., 2007). Although OCT data modality is non-destructive and accurate for micro-vessels, it loses contextual information of digital pathology. Alternatively, confocal microscopy can also be used to accurately characterize vessels, but limited to small tissue samples.
annotations, we observe a satisfactory concordance suggested by both region-based and distance-based measures. Meanwhile, visual inspections on vessel structures by our method and human annotations also present negligible difference. These results suggest the efficacy of our 3D vessel analysis method for whole slide images of liver tissue sections. Notably, our 3D vessel analysis framework is generic and can be readily applied and extended to the analytics of other 3D biological entities with 3D image datasets of diverse diseases.
The remainder of the paper is organized as follows. Data and Methods used for this study are described in Section 2. We then present and validate the 3D vessel analysis results in Section 3. In Section 4, we discuss how to apply this software to future integrative analysis linked with clinical and molecular endpoints and close the paper with conclusions.
2 Materials and methods
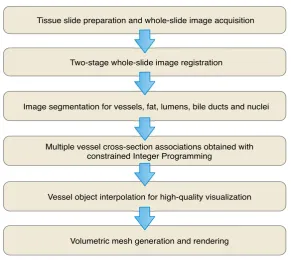
[image:6.595.154.446.409.669.2]Our workflow for 3D vessel structure analysis consists of multiple components: image registration, vessel segmentation, vessel cross-section association, intermediate slide interpolation, and volumetric rendering. We present the overall workflow in Figure 1. Detailed discussions on these modules and the dataset involved in this study are given as follows.
Figure 1 The overall workflow of 3D vessel analysis with whole slide imaging data of liver tissue sections.
Two-stage whole-slide image registration Tissue slide preparation and whole-slide image acquisition
Image segmentation for vessels, fat, lumens, bile ducts and nuclei
Multiple vessel cross-section associations obtained with constrained Integer Programming
Vessel object interpolation for high-quality visualization
2.1 Slide preparation and imaging data acquisition
Whole slide images provide rich information about morphological and functional characteristics of biological systems. As a result, such image modality serves as a promising data source to provide insights on the underlying mechanisms of disease onset and progression, given the availability of scalable image analysis tools. In this study, we have access to a sequence of 12 whole slide images of liver sections separated by 50µm from the University of Leeds. Resected human liver samples are paraffin embedded and formalin fixed. Then the embedded samples are sectioned into slices with thin thickness. The resulting slices are dyed with dual chromogen immunohistochemistry (IHC) (Ismail et al., 2010). DAB IHC is directed against CD34 antigen as a blood vessel marker. Haemotoxylin nuclear counterstain is also used. Finally, these slides are scanned with ScanScope AT scanner (Aperio, http://www.leicabiosystems.com/) at 40x magnification and converted into digital images compressed with JPEG2000 and Matrox Imaging Library (MIL 8.0, http://www.matrox.com/).
The resulting images have high resolutions and large file sizes, typically with 75k×65k pixels and 300 Megabytes per image. Each whole slide image file consists of four image representations down sampled from the base image by 4:1, 16:1, 32:1, and 88:1 (thumbnail), respectively. Each resolution level of image representation has three 8-bit image channels. At the base level, the physical resolution is about 2.508e-1µm per pixel. From computer-based analysis perspective, we would like to process images at a high resolution for sufficient tissue structure detail. By contrast, efficient analysis welcomes images of a low resolution. After our extensive tests, we reach the balance between image analysis quality and execution speed via applying our method to images down sampled from the base image level by 64:1. Scanned whole slide images of liver slides stained by our staining process present blue, brown, red colors for nuclei, vessels and bile ducts, respectively. Locations for fat in the resulting liver microscopy images are visualized by bright white color. Lumens inside vessels show white in color as well, but surrounded with vascular walls in brown.
2.2 Image registration and segmentation
All slides in the same series are registered with a two-stage process. Initially, images are rigidly registered using phase correlation (Decastro et al., 1987). For non-rigid registration, the whole image is partitioned into a set of evenly spaced patches that are aligned separately with phase correlation. Then, B-Spline transformation is applied to the rigidly transformed image patches to estimate the global non-rigid pixel spatial change by a set of 64 control points (Roberts et al., 2012). Given the down sampled image resolution, more control points would only improve registration accuracy marginally. With this sequence of registered images, we have managed to automatically segment vessels, along with nuclei, fat, lumens, and bile ducts by morphology reconstruction segmentation method (Vincent, 1993) on each image channel found by color deconvolution technique (Ruifrok, 2001). The final vessel boundaries are smoothed.
2.3 3D vessel association
small vessel parts belonging to the same vessel object and that forces them to be cohesive to a single vessel object. Among all grouped vessel objects, we proceed with selecting the top-K
candidates of primary vessels for further analysis based on their sizes, as inclusion of unduly small vessels for analysis not only significantly increases the computational complexity for object association, but also reduces the vessel association accuracy.
The selected top-Kvessel objects in each frame are characterized based on their shapes and spatial relationships. We define the problem of frame-by-frame object association in a constrained Integer Programming framework (Hillier and Lieberman, 2001). For our data, three distinct vessel association cases are considered: one-to-one (growing), one-to-two (bifurcation) and one-to-none (disappearing). For each case, the similarity functionS is defined as follows:
• one-to-one: the main vessel still continues to extend to the next frame;
Svti,vtj+1=λ1g
vti,vtj+1+λ2d
vti,vtj+1 (1) • one-to-two: bifurcation occurs and the vessel grows into two small branches;
Svti,vtj1+1,vtj2+1=λ1g
vti,vtj1+1∪vtj2+1+λ2d
vti,vtj1+1∪vtj2+1 (2) • one-to-none: the vessel stops growing;
S vti,vt∅+1
=d vti,ΩI
(3)
where functiong(·)compares the similarity of vessel appearance by comparing the Fourier shape descriptors (Zahn et al., 1972) derived from vessel boundaries;d(·)computes the spatial similarity of two vessel objects with their centroids;vti is thei-th vessel object in framet;ΩIis the boundary of imageI;λ1andλ2are two constant weights to control the
association smoothness subject toλ1+λ2=1.
Identification of vessel association is a process of establishing mappings between vessel objects in adjacent image frames based on given criteria and constraints. Assuming we have
ntandnt+1vessel objects in frametandt+1 andhpossible associations between the two
frames, we deem such association identification process identical to a multi-object tracking problem (Jiang et al., 2007). Therefore, the optimal associations among vessel objects can be achieved by solving the constrained Integer Programming (Hillier and Lieberman, 2001), based on the pre-defined similarity function:
Arg max x s
Tx
subject to HTx
i≤1 for i=1,· · ·,nt+nt+1
xj∈ {0,1} for j=1,· · ·,h
(4)
wheresis anh×1 vector with each entry representing the similarity of one vessel object association;His anh×(nt+nt+1)binary matrix withHi j set to 1 if and only if thei-th object association involves the j-th element in a set concatenated byntvessel objects from frametandnt+1vessel objects from framet+1;(HTx)idenotes thei-th element of(HTx)
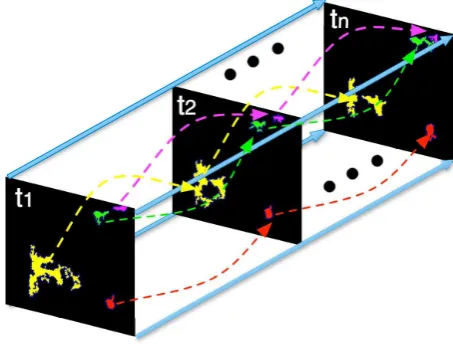
Figure 2 Vessel associations of four chains of color-coded vessels in framet1,t2,· · ·,tn.
t
1t
2t
nt+1) can be selected at most once in the result; the optimal solutionxis anh×1 binary vector wherexi= 1 indicates the selection of thei-th association in the optimal solution. The algorithmic description of the above constrained Integer Programming with simplex solver is presented in Algorithm 1.
Solving the constrained Integer Programming problem above provides the optimal associations for vessel objects in adjacent frame pairs. Therefore, by tracking vessel cross-sections through all adjacent frames with the identified associations, we can recover the profile of a vessel structure along the z-axis with shape descriptors and spatial similarity. In Figure 2, vessel in yellow bifurcates, corresponding to the one-to-two association case. Other vessels (green, red, and magenta) represent one-to-one tracking cases.
2.4 Interpolation and visualization
Since there is a limited number of whole slide images for this liver imaging dataset (n=12) and thez-axis resolution is not sufficient to support high-quality 3D rendering, we perform interpolation between each pair of associated vessel objects in adjacent frames. Initially, we normalize each boundary by its arc length. Then we uniformly sample points along each normalized boundary arc. Finally, we apply linear interpolation (Hazewinkel, 2001) to the sampled points.
Let’s denotemsampled points from framestandt+1 as(xt1,yt1),(xt2,yt2),· · ·,(xtm,ytm) and(xt1+1,y1t+1),(xt2+1,yt2+1),· · ·,(xtm+1,ytm+1), respectively. We linearly interpolate thex -coordinate andy-coordinate independently. Thus thei-th point (xti+δ,yti+δ) in framet+δ (0<δ <1) can be interpolated as:
xti+δ =xti+1−xti
t+1−t (t+δ−t) +xti= xti+1−xti
δ+xti yti+δ =yti+1−yti
t+1−t (t+δ−t) +yti= y t+1
i −yti
δ+yti
(5)
Algorithm 1 Constrained Integer Programming with simplex solver for Vessel Object Association (VOA):(fI∗,x∗) =V OA(x,j,fI) (Hillier and Lieberman, 2001)
Require: (HTx)i≤1 f or i=1,· · ·,nt+nt+1 and xj∈ {0,1} f or j=1,· · ·,h
Ensure: Arg max x s
Tx
1: Suppose fI and fr are current objective values obtained by solving the Integer Programming(IP) problem andLP-relaxation problem, respectively; fI∗is the optimal objective value andx∗is the optimal integer solution
2: Initialization:x←[0,· · ·,0]h×1,j←1, andfI←∞
3: Output:(fI∗,x∗) =V OA(x,j,fI)
4: functionVOA(x,j,fI) ⊲The definition of function V OA(x,j,fI)
5: ifj > hthen
6: return(fI,x) 7: end if
8: PerformLP-relaxation by releasingxj∈ {0,1}to a weaker constraint 0≤xej≤1
9: Solve theLP-relaxation problem:(fr,xej) =LP_Relax(x1,· · ·,xj−1,xej,xj+1,· · ·,xh) 10: if fr>fIandxejis NOT an integer then
11: xj←0;(fI0,x0) =V OA(x,j+1,fI)
12: xj←1;(fI1,x1) =V OA(x,j+1,max(fI0,fI))
13: if fI0≥fI1then
14: return(fI0,x0)
15: else
16: return(fI1,x1)
17: end if
18: else if fr>fIandxejis an Integer butxej6=xj then
19: fI←fr;xj←xej
20: (fI,x) =V OA(x,j+1,fI)
21: else if fr<fIthen
22: (fI,x) =V OA(x,j+1,fI) 23: end if
24: end function
with the interpolated frames, we then render vessels in a 3D space. With interpolated 3D image volume, triangular isosurfaces with specified density are extracted by Constrained Delaunay tetrahedralization(CDT). The subvolumes bounded by the extracted isosurfaces are filled with tetrahedral elements and 3D mesh is generated with adaptive resolution. Specially, hollow structures or sub-domains corresponding to different tissue types are rendered according to their predefined labels in the volumetric data (iso2mesh, http://iso2mesh.sourceforge.net).
3 Results
demonstrate method performance measured by both quantitative and qualitative validation analysis.
3.1 Results of individual modules
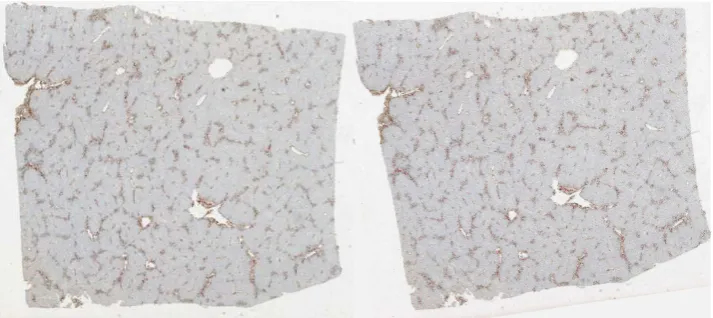
The first processing module in the analysis pipeline is image registration that helps register to the first image all subsequent ones in the sequence. As this step provides the foundation to reconstruct 3D objects in a meaningful way with their 2D cross-sections from different coordinate systems, it has a profound impact on the following analysis. Our two-step registration method takes into account both global rigid and local non-rigid deformation with phase correlation and B-Spline interpolation by 64 control points. With our image resolution, 64 control points are sufficient to accurately recover non-rigid deformation at different regions in an image. Additional control points would only marginally improve registration accuracy. We present a typical registration result in Figure 3 where frame (n= 10) is registered to the reference image (n=0). After registration, the registered image in Figure 3(right) is rotated in counterclockwise direction slightly, especially the upper and lower right corners. Nevertheless, not all parts of the registered image are rotated and shifted uniformly because of the non-rigid registration effect.
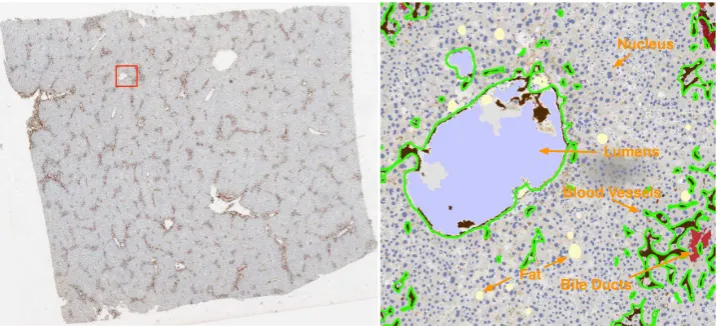
In liver microscopy images, histopathologic objects of interest to this study at the segmentation step include vessels, nuclei, fat, lumens, and bile ducts. Each type of object is identified and represented with distinct colors. A representative segmentation result is demonstrated in Figure 4, where brown, red, dark blue, light purple, and light yellow colors are used to represent vessels, bile ducts, nuclei, lumens, and fat in liver tissues, respectively. Since we use vessel shape for association analysis in this study, we obtain the vessel boundaries from their masks and superimpose green vessel boundaries on the original image in Figure 4.
[image:11.595.122.479.533.692.2]In the proposed method, a constrained Integer Programming framework is employed to identify the optimal vessel object association between adjacent frames. The optimal solution is achieved by iteratively solving a series of Linear Programming (LP) relaxation problems. The parameters for object association used in this study areK=25,λ1= 0.68 Figure 3 Sequential liver microscopy image registration. (Left): a microscopy image of a liver
Figure 4 Liver microscopy image segmentation. (Left): a registered microscopy image of a liver slice (n=10); (Right): a close-up view of segmentation result within the red box region overlaid on the left image. Note that brown, red, dark blue, light purple, and light yellow colors are used to represent vessels, bile ducts, nuclei, lumens, and fat in liver tissues; Additionally, vessel boundaries are overlaid in green.
Blood Vessels
Bile Ducts Fat
Nucleus
Lumens
in Equation (1), andλ1= 0.35 in Equation (2). We carefully choose these parameter values
after intensive experiments. The value forλ1in Equation (1) is intentionally selected to be
greater than that in Equation (2), in the sense that shape descriptors are more reliable and discriminative in the one-to-one than one-to-two case. When vessel bifurcates, shapes of the resulting vessel components are substantially deformed from their source. As a result, we assign more weight on spatial similarity for one-to-two case.
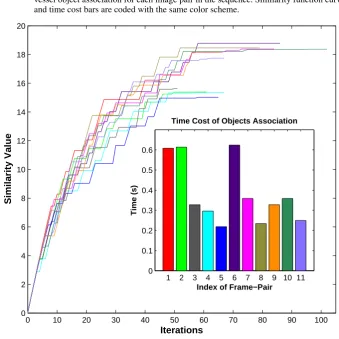
We plot objective similarity value for each adjacent frame pair as a function of iteration number in Figure 5, where the objective similarity function defined in Equation (4) increases as iteration number increases. Each curve in Figure 5 represents similarity function change of one frame pair, as indicated by a unique color. The optimal solution is achieved when the objective function reaches its maximum. In Figure 5, we also show time cost for finding the optimal vessel object association for each frame pair with the same color coding scheme of similarity function curves. Note that all time costs are less than 0.7 seconds, with the majority around 0.32 seconds. This suggests that it is efficient to use the constrained Integer Programming framework to establish vessel object association.
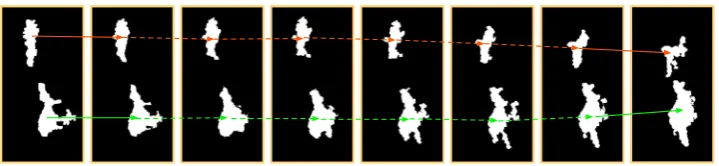
Interpolation used in our framework enables us to recover 3D vessel structures that exhibit a smooth transition process between two original frames. Without this step, the resulting reconstructed vessels present abrupt changes and step artifacts due to insufficient inter-frame resolution. We present a typical interpolation result in Figure 6, where the leftmost and the rightmost frames are original slices with two identified vessel objects in each. Six intermediate frames are evenly sampled from 50 interpolated frames.
Note that the interpolation error is bounded as follows (Hazewinkel, 2001):
error(k)≈f(k)−L(k) = f ′′(ξi)
2 (k−k1) (k−k2) (6)
≤l 2
8
f′′(ξ∗) 2
ξ∗=k1+k2
Figure 5 Similarity value as a function of iteration number, with an inset presenting time cost of vessel object association for each image pair in the sequence. Similarity function curves and time cost bars are coded with the same color scheme.
0 10 20 30 40 50 60 70 80 90 100
0 2 4 6 8 10 12 14 16 18 20
Iterations
Similarity Value
1 2 3 4 5 6 7 8 9 10 11 0
0.1 0.2 0.3 0.4 0.5 0.6
Time Cost of Objects Association
Index of Frame−Pair
Time (s)
whereξi∈[k1,k2], i=1,2,· · ·,P, and l=k2−k1. As a result, the interpolation error
decreases as the intervalldecreases and the number of sampled data points increases. This suggests that we can achieve improved accuracy by using more sampled points. In this study, the length of interval[k1,k2]is normalized tol=1 and the number ofξiis set toP=50. With these parameter values, we observe continuously changed vessel cross sections as illustrated by two interpolated vessel chains in Figure 6.
As a last step in our pipeline, we render the matched and interpolated vessel objects in 3D space. After interpolation, each object is labeled with a unique integer. Coordinates of vertices on isosurfaces with same label values are recorded and the associations of these vertices for triangular isosurfaces are found. Then, tetrahedral elements are generated to fill up volumes contained by these isosurfaces and 3D mesh is generated with adaptive resolution. The 3D view of six primary vessel objects is presented in Figure 7(a).
3.2 Validation study
Figure 6 Interpolation of intermediate frames. The leftmost and rightmost frames are original, while the six ones in the middle are interpolated.
tissue slides. With machine and manual results, we linearly interpolate segmentation results from adjacent frame pairs and validate our method on all interpolated frames. Specifically, region-based and distance-based measures are used for evaluation. Region-based measures used in our validation include Jaccard coefficient, precision, recall and F1 score while
Hausdorff distance is used as a distance-based metric.
We take human annotations on each vessel as ground truth and denote them byA. We denote the machine segmentation results byB. For region-based measures, the Jaccard coefficient(J), precision(P), recall(R)andF1score (F1) are defined asJ(A,B)= |A∩B||A∪B|,P
=|A∩B|B ,R= |A∩B|A andF1= P2PR+R, respectively. Hausdorff distance between the ground truth
and segmentation results is defined asdH(A,B)= max{sup
a∈A
in f
b∈B
d(a,b),sup
b∈B
in f
a∈A
d(a,b)}
withsupandin frepresenting the supremum and the infimum, respectively. For each vessel, we present mean and relative standard error (RSE%) of each metric in Table 1. The best performance with each measure is in bold. The first column in Table 1 shows distinct vessel objects and their colors are demonstrated in Figure 7(a). Since vessel 1, 2 and 3 are more regular than vessel 4, 5 and 6 in shape, better segmentation agreement between the proposed method and human is achieved, as indicated in Table 1. Our validation results with all above measures suggest that our segmentation method has a satisfactory concordance with the manual segmentation results.
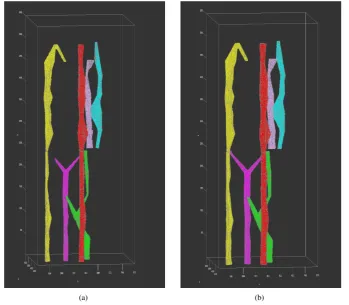
In addition to the quantitative segmentation method validation, we also take a qualitative assessment by visually comparing the reconstructed vessel objects in 3D view. We present the 3D vessel rendering results from human annotations in Figure 7(b). Reconstructed vessels in Figure 7(a) and Figure 7(b) look similar in 3D structure overall, although ones derived by human annotations have more regular surfaces. By contrast,the machine generated vessels tend to preserve more structural details.
Table 1 Evaluation of the segmentation results (mean±Relative Standard Error%) for primary vessels. Red (r), yellow (y), magenta (m), green (g), cyan (c) and purple (p) are used to represent the corresponding 3D objects in Figure 7(a). The best result with each measure is bold.
Vessel (color) J P R F1 dH
Figure 7 3D visualization result of (a) machine-identified and (b) human-annotated vessels.
(a) (b)
4 Discussion and conclusion
As commercial whole slide imaging scanners are now capable of producing high-magnification, high-resolution images from whole slide tissues in a prompt manner, it increasingly becomes feasible even for a medium-scale study to routinely generate sequential whole slide images of tissue sections. The resulting high-resolution microscopy image data offers a rich source of tissue phenotypic information on clinical relevant histological features and spatial relationships among histopathology hallmarks in specimen architectures. However, 3D microscopy image data is still an underutilized data modality in biomedical research because of the following reasons:
• It is not technically straightforward to develop effective and efficient methods to extract useful information from large-scale whole slide image dataset;
• There is a lack of highly configurable image analysis software to meet diverse research demands from individual studies.
As 2D microscopy images can only present histopathological structures at discrete planes, we aim to provide efficient and generic 3D image analysis tools to facilitate biomedical investigations where 3D tissue examinations at microscopic resolution are important. Our vessel structure analysis framework is one such effort to enrich microscopy image analysis tools applicable to a large spectrum of 3D pathology phenotypic hallmarks in numerous diseases. To achieve a reasonable efficiency and accuracy, our current method is focused on primary vessel structure modeling and analysis. As a result, inaccurate segmentation results of small vessels do not affect following modules. Nevertheless, the efficacy of our method is affected by such factors as unduly large inter-slice resolution and tissue slicing orientation during tissue slide preparation. In our future work, we will improve individual analysis modules to reduce errors propagated in our working pipeline. We will also develop methods to accommodate small vessels. Additionally, we will validate our method with more liver tissue sample datasets and extract informative 3D imaging features to help researchers and clinicians better analyze 3D biological structures.
As a follow-up research, we will characterize vessels and other tube-shaped structures with the following generic features. 1) Length: the length of the 3D vessel can be determined by the medial axis with the hamonic skeletonization technique (Yang et al., 2005); 2) Thickness of walls: the vessel wall thickness can be used to measure blood flow volume and to indicate the degree of vascular integrity closely related to oncogenesis; 3) 3D vessel bifurcations: the number of bifurcations along the artery could be a clinically relevant parameter that determines the complexity of the vessel structures; 4) Angles at bifurcations: the angles at bifurcations of the vessels could affect volume of blood flow; 5) Local cross-sectional area: cross-cross-sectional areas at different locations along a vessel can characterize vessel structures. With these fundamental features measured, we will further describe high-level 3D shape features. For vessels, we will calculate the inter-branch distance, characterize the branching pattern, and generate a histogram of branch lengths and thicknesses for the entire 3D tissue volume. With these 3D structure features and their cross-relationships quantitatively characterized, better clinically relevant patient stratification protocols and molecularly correlated phenotypic information could be expected. Our end goal is to combine our methods with such techniques as immunohistochemistry, Fluorescent In Situ Hybridization, or mRNA gene expression data and potentially provide complementary information to enhance investigations on the anatomical features and micro-architecture of histologic tissues, mechanisms of tumor progression, spatial distributions of signatured molecular biomarkers, expression of master regulators in cancer pathways in relation to 3D vessel structural features.
In summary, we present in this paper a new 3D vessel structure analysis method consisting of registering, segmenting, matching, interpolating, and visualizing blood vessels in liver tissues with large-scale microscopy images. We vision this cohort of 3D analysis tool development effort as a new avenue to facilitate pathology review and biomedical research, and a better way to engage researchers and clinicians in using rich molecular and clinical related information from histopathological imaging data.
Acknowledgement
References
Petushi, S., Garcia, F.U., Habe, M., Katsinis, C. and Tozeren, A. (2006) ‘Large-scale computations on histology images reveal grade-differentiating parameters for breast cancer’,BMC Med Imaging, 6(14), doi: 10.1186/1471-2342-6-14 PMCID: PMC1634843, page length: 11
Xing, F.Y. and Yang, L. (2013) ‘Robust cell segmentation for non-small cell lung cancer’,
International Symposium on Biomedical Imaging, Vol. 1, pp.386–389
Jafari-Khouzani, K. and Soltanian-Zadeh, H. (2003) ‘Multiwavelet grading of pathological images of prostate’,IEEE Trans Biomedical Eng., Vol. 50, pp.697–704
Tabesh, A., Teverovskiy, M., Pang, H.Y., Kumar, V.P., Verbel, D., Kotsianti, A. and Saidi, O. (2007) ‘Multifeature prostate cancer diagnosis and Gleason grading of histological images’,IEEE Trans Med Imaging, 26(10), pp.1366–1378
Han, J., Chang, H., Loss, L., Zhang, K., Baehner F.L., Gray, J.W., Spellman, P. and Parvin, B. (2011) ‘Comparison of sparse coding and kernel methods for histopathological classification of gliobastoma multiforme’,IEEE International Symposium on Biomedical Imaging, pp.711–714.
Cooper, L., Sertel, O., Kong, J., Lozanski, G. and Gurcan, M. (2009) ‘Feature-Based Registration of Distinct Stained Histopathology Images: An Application for Computerized Follicular Lymphoma Prognosis’, Computer Methods and Programs in Biomedicine, 96(3), pp.182–192
Kong, J., Sertel, O., Shimada, H., Boyer, K.L., Saltz, J.H. and Gurcan, M. (2009) ‘Computer-aided Evaluation of Neuroblastoma on Whole-slide Histology Images: Classifying Grade of Neuroblastic Differentiation’,Pattern Recognition, 42(6), pp.1080-1092
Kong, J., Cooper, L.D., Wang, F., Gutman, D.A., Gao, J.., Chisolm, C., Sharma, A., Pan, T., Van Meir, E.G., Kurc, T., Moreno, C.S., Saltz, J.H. and Brat, D.J. (2011) ‘Integrative, Multimodal Analysis of Glioblastoma Using TCGA Molecular Data, Pathology Images, and Clinical Outcomes’, IEEE Transactions on Biomedical Engineering, 58(12), pp.3469–3474
Jara-Lazaro, A.R., Thamboo, T.P., Teh, M. and Tan, P.H. (2010) ‘Digital pathology: exploring its applications in diagnostic surgical pathology practice’, Pathology, 42(6), pp.512–518
Kong, J., Cooper, L.D., Wang, F.S., Gao, J., Teodoro, G., Scarpace, L., Mikkelsen, T., Moreno, C.S., Saltz J.H. and Brat, D.J. (2013) ‘Generic, Computer-based Morphometric Human Disease Classification Using Large Pathology Images Uncovers Signature Molecular Correlates’, PLoS One, 8(11):e81049. doi: 10.1371/journal.pone.0081049. eCollection 2013, page length: 17
Qi, X., Xing, F.Y., Foran, D.J. and Yang, L. (2012) ‘A fast, automatic segmentation algorithm for locating and delineating touching cell boundaries in Imaged histopathology’,Journal of Methods in Medical Informatics, Vol. 51, No. 3, pp. 91–102
Foran, D.J., Chen, W. and Yang, L. (2011) ‘Automated image interpretation computer-assisted diagnosis’,Analytical Cellular Pathology, Vol. 34, No. 6, pp.279-300
Yang, L., Tuzel, O., Meer, P. and Foran, D.J. (2008) ‘Automatic image analysis of histopathology specimens using concave vertex graph’,Proc. International Conference on Medical Image Computing and Computer Assisted Intervention, Vol. 11, pp. 833-841, 2008..
Chang, H., Han, J., Spellman, P.T. and Parvin, B. (2012) ‘Multireference level set for the characterization of nuclear morphology in glioblastoma multiforme’,IEEE Transactions on Biomedical Engineering, 59(12), pp.3460–3467
Teodoro, G., Pan, T., Kurc, T.M., Kong, J., Cooper, L.D., Podhorszki, N., Klasky, S. and Saltz, J.H. (2013) ‘High-throughput Analysis of Large Microscopy Image Datasets on CPU-GPU Cluster Platforms’,IEEE International Symposium on Parallel and Distributed Processing, pp.103–114
Lesage, D., Angelini, E.D., Bloch, I. and Funka-Lea, G. (2009) ‘A review of 3D vessel lumen segmentation techniques: models, features and extraction schemes’,Medical Image Analysis, 13(6), pp.819-845
Friman, O., Hindennach, M., Kühnel, C. and Peitgen H. O. (2009) ‘Multiple hypothesis template tracking of small 3D vessel structures’,Medical Image Analysis, 14(2), pp.160-171
Kubisch, C., Glaer, S., Neugebauer, M., and Preim, B. (2012) ‘Vessel visualization with volume rendering’,Vis. in Med. & Life Sci., pp.109-134
Hu, Z.,Niemeijer, M. ,Abramoff, M. D., Lee, K. and Garvin, M. K. (2010) ‘Automated segmentation of 3-D spectral OCT retinal blood vessels by neural canal opening false positive suppression’,MICCAI, pp. 33–40
Arribas, S. M., Daly, C. J., Gonzalez, M. C. and McGrath, J. C. (2007) ‘Imaging the vascular wall using confocal microscopy’,J. Physiol., 584, pp. 5–9
Jiang, H., Fels, S. and Little, J.J. (2007) ‘A linear programming approach for multiple object tracking’,Proc. in IEEE CVPR, pp.744-750
Hillier, F. S. and Lieberman G. J. (2001) ‘Introduction to Operations Research’, McGraw-Hill, New York, NY, ISBN 0077298349
Ismail, A., Gray, S., Jackson, P., Shires, M., Crellin, D. M., Magee, D., Quirke, P. and Treanor, D. (2010) ‘3D Histopathology of the Liver Using Dual Chromogen Histochemistry’,reAgents, 3, pp. 20–22
Roberts, N., Magee, D., Song, Y., Brabazon, K., Shires, M., Crellin, D., Orsi, N.M., Quirke, R., Quirke, P. and Treanor, D. (2012) ‘Toward Routine Use of 3D Histopathology as a Research Tool’,Am J Pathol, 180(5), pp.1835–1842
Vincent, L. (1993) ‘Morphological Grayscale Reconstruction in Image Analysis: Applications and Efficient Algorithms’,IEEE Transactions on Image Processing, Vol. 2, No. 2, pp.176–201
Ruifrok, A.C. and Johnston D.A. (2001) ‘Quantification of histochemical staining by color deconvolution’,Anal Quant Cytol Histol, 23(4), pp.291–299
Zahn, C.T. and Roskies, R.Z. (1972) ‘Fourier Descriptors for Plane Closed Curves’,IEEE Transactions on Computers, Vol. 21, pp. 195–201
Hazewinkel, M. (2001) ‘Linear interpolation’, Encyclopedia of Mathematics, Springer, Netherlands, ISBN 9781556080104