This is a repository copy of
The Price of Anarchy in Urban Traffic Networks
.
White Rose Research Online URL for this paper:
http://eprints.whiterose.ac.uk/106011/
Version: Accepted Version
Article:
Connors, RD orcid.org/0000-0002-1696-0175 (2016) The Price of Anarchy in Urban Traffic
Networks. Mathematics Today, 52 (5). pp. 234-237. ISSN 1361-2042
© 2016. This is an author produced version of a paper published in Mathematics Today.
Uploaded with permission from the publisher.
eprints@whiterose.ac.uk https://eprints.whiterose.ac.uk/ Reuse
Unless indicated otherwise, fulltext items are protected by copyright with all rights reserved. The copyright exception in section 29 of the Copyright, Designs and Patents Act 1988 allows the making of a single copy solely for the purpose of non-commercial research or private study within the limits of fair dealing. The publisher or other rights-holder may allow further reproduction and re-use of this version - refer to the White Rose Research Online record for this item. Where records identify the publisher as the copyright holder, users can verify any specific terms of use on the publisher’s website.
Takedown
If you consider content in White Rose Research Online to be in breach of UK law, please notify us by
The Price of Anarchy in Urban Traffic
Networks
Transportation networks and the flows of people and goods through them have naturally attracted the attention of mathematicians, at least as far back as Euler’s elegant representation of urban connectivity in Königsberg as a link-node graph. In the notorious travelling salesman problem, the graph representing the transport network has links with explicit lengths to capture not only the connectivity, but also the distance travelled . This is also the case in ‘the transportation problem’ (to minimise the total transport cost when supplying factories from coal mines) where flows arise from multiple sources and sinks. However, a network model that is useful for managing urban traffic requires additional attributes to be included in terms of demand, supply and traveller behaviour.
Unlike the coal in the transportation problem, individuals are keen to arrive at their own particular desired destination; traffic flows are not freely interchangeable between sources and sinks. Trips are associated with specific origin → destination node pairs and the volumes of trips (demand flows) are collected in the origin-destination (OD) matrix. Regarding supply: one of the primary motivations for developing traffic network models is to manage congestion, and so it is essential to represent the fact that link capacities are finite. The relationship between traffic flow on a link and link travel time is captured by a link cost function1. Finally we
recognise that travellers do not simply choose the shortest geometric path, they seek alternative routes to avoid congestion and minimise delays. Modelling the more nuanced aspects of route choice is a substantial area of research. Perhaps the most natural principle for assigning OD flows to possible routes was set out by John Wardrop (1952):
Travellers choose routes such that they each, selfishly, minimise their individual travel time: this is the User Equilibrium (UE) principle.
This feedback mechanism between congestion and route-choice leads to an equilibrium, albeit under several assumptions. In 1956 Beckman et al. set out a convenient minimization formulation to solve the UE model and determine its equilibrium link flows, and hence large traffic network equilibrium problems could be solved numerically, at least in principle. Once PCs became widely available, the UE model started to be used ‘in anger’, to model traffic flows in real city networks, and to forecast the consequences of different possible traffic management and network investment schemes.
The assumptions underlying UE are rather strong: demand and supply are both fixed, travellers are perfectly informed and diligently cost-minimizing, and the traffic flows attain a static equilibrium! These are not quite representative of typical experiences in urban traffic. Since the fifties, researchers have been busy developing more sophisticated representations of demand, supply and route-choice behaviour, in particular introducing time dependency and stochasticity into all of these elements. Despite such advances, and regardless of its assumptions and irksome analytic properties, the UE model became firmly established as the most practically useful and robust methodology for urban traffic network analysis, and continues to be used today for traffic management and planning all around the world.
It is notable that the UE model specification ignores network efficiency, indeed it is well known that typically UE flows do not minimise the total network travel cost. Under UE travellers seek to minimise their own OD travel time, but they do not suffer the additional congestion they add to the system. Consequently, delays
due to congestion might be improved by rerouting flows, without having to reduce demand or invest in additional network capacity. In fact Wardrop noted an alternative routing principle:
Travellers each, unselfishly, choose routes such that the total travel time in the network when aggregated across all travellers is minimised: the System Optimal (SO) principle.
An obvious questions arises: how much could congestion be improved by rerouting the traffic?
Consider a traffic network comprising two nodes joined by 2 parallel links with link flows = , . The single OD pair has demand flow = 1, and the link cost functions are = , = 1.
Following Wardrop, each selfish, cost-minimizing traveller will use link 1 giving user equilibrium flows =
1,0 with total travel cost = ∑ = 1. The SO solution in this case happens to be =
1 2⁄ , 1 2⁄ which reduces the total system cost to = ∑ = 3/4.
The extent of the inefficiency of selfish routing can be quantified by the Price of Anarchy: the ratio of the total network travel cost under UE to the total network travel cost under SO:
! = =∑∑∈% ∀∀ ##
∈%
Roughgarden and Tardos (2002) demonstrated an upper bound of 4 3⁄ for the PoA in traffic networks with affine link cost functions; as illustrated by the two-link example above. Upper bounds for the PoA have been derived for other (nonlinear) link cost function specifications wherein the PoA can be much higher than 4/3. The two link example above with the simple modification: = &, = 1 can be used to illustrate that the PoA upper bound increases with ∋.
[image:3.595.55.546.573.713.2]The PoA has appeal as an indicator for policy makers. Bounds on the PoA conveniently set out the maximum possible congestion improvement attainable by rerouting flows. However, not only are the theoretical bounds rarely witnessed in models of real urban networks, but the PoA depends on both the magnitude and configuration of OD demands. Since the OD matrix changes within the day and from day-to-day in a real network, which OD matrix should be used to compute a representative value for the PoA? Moreover, how can we ensure efforts to reroute traffic in order to attain SO flows are focussed on being effective when the OD travel demands offer the greatest gains?
Figure 1 illustrates how the PoA changes as travel demand is increased, for three different networks each of which are discussed in more detail below.
A B C
Figure 1 – Price of Anarchy against Demand for three networks
theoretical bound2, plus there are some complex and interesting fluctuations in the PoA as a function of
demand.Price of anarchy versus demand plots, for network models based on areas of Boston, New York and London, can be found in Youn et al. [4] and they display these same characteristics.
The influence of network topology (in terms of both connectivity and link capacities) on network efficiency and the PoA is an area of ongoing research not only in transport but more widely in network science. Here we focus on some specific features of these PoA plots. For each network, there is an initial region in which the PoA is unity; an intermediate region of fluctuations; and a final region of decay. It is also appears that PoA is non-smooth as a function of demand. What gives rise to these features?
As demand increases the set of active routes expands
Consider a traffic network of parallel links, serving a single OD pair with demand > 0, and with link cost functions of the form = ) + + , where ) , + > 0 and ) < )− ∀/ = 1, … , . The “free flow” travel time (given by link length in this case) is ) and we label the links in order of increasing length. At sufficiently low levels of demand , the UE solution has flow only on the quickest/shortest route, link 1. Under the UE routing principle the cost on link 1 is not greater than on any other link.
= ≤ = 0 ⟺ ) + + ≤ ) ⟺ ≤ ) − )+
As demand increases and > ) − ) +⁄ , link 2 activates and, following UE, = . Both links carry flow and the set of minimum cost routes, 45 6, comprises links 1 and 2. As demand increases, OD travel cost increases and further links activate in turn. This process continues until, at a sufficiently large level of demand, the set of minimum cost routes includes all links.
Under SO a similar pattern occurs: increasing demand causes a sequence of links to be added to the set of used routes. As an aside, it is helpful to know the general result that for a network with link costs , SO flows would arise if UE-like travellers were to selfishly minimize their travel costs according to the modified link costs: ̃ = + 8 8⁄ . For the above parallel link network the cost transformation ̃ yields
̃ = +88 = ) + + + + = ) + 2+ (1)
The pattern of changes in the set of minimum marginal total cost routes under SO, 495 6, can therefore be obtained by redefining + : = 2+ from the UE case. As demand increases, the order in which routes activate is the same under UE and SO.
Consider a sequence of networks with number of links = 2,3, … ,10 and coefficients ) = /, + = 1 for
/ = 1, … ,10. Figure 2 shows the Price of Anarchy !; for each of these nine networks. Vertical lines mark the link activations under UE (green) and SO (red).
2 A and B have linear cost functions so the theoretical upper bound for PoA is 4/3. Network C has 4th power costs
Figure 2 - The Variation of the Price of Anarchy against Demand in < = =, … , >? Parallel Link Network
For levels of demand up to the first route transition point under SO, the Price of Anarchy is 1. Beyond this for each , levels of demand at which 45 6 expands coincide with levels of demand at which the PoA is non-differentiable. There is a decrease in the gradient of the PoA at each of these points. In contrast the PoA is differentiable at all levels of demand at which there is an expansion in the SO active route set, 495 6. For each
= 2, … ,10, the graphs of !;≅ and !; depart from one another at each of these points.
Expansions in the UE active route set lead to decreases in the PoA whereas expansions in the SO active route set lead to increases in the PoA. As demand increases beyond the last route transition point, the PoA begins to decay back towards unity as Α 1⁄ .
Under increasing demand the active route-set can contract
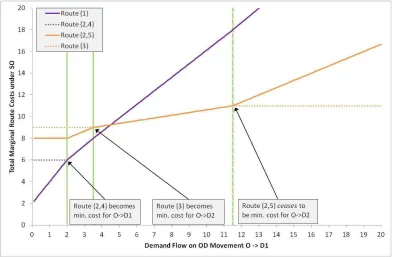
It is perhaps less intuitive that routes and links may also deactivate under increasing demand. The following is the simplest illustration we came across. Consider the traffic network shown in Fig. 3, which serves two OD pairs O → D1 and O → D2 with link cost functions: = 2 + , = 3 + , Β= 9 + Β, D= 1 + D and
Ε= 1 + Ε. There are two routes for each OD pair: for O → D1, the routes are link {1} and links {2, 4}; for O
→ D2, the routes are links {2, 5} and link {3}.
Figure 3 - Five Link Network with Two OD Pairs
Figure 4 - Route Costs under SO against increasing demand on O->D1
As demand increases on the single OD, the PoA gradient decreases at expansions and increases at contractions in the UE route-set, 45 6Ι . Under SO, points of expansion/contraction in the SO route-set, 495 6Ι correspond to an increase/decrease in the PoA gradient.
The PoA in Larger Networks
How do these simple examples inform patterns seen in general networks with many links, nodes and multiple OD movements? Overall, as demand increases new routes will activate. However, establishing proofs for what happens at every route-set transition point involves dealing with possibly complex scenarios; an expansion in the minimum cost route set for one OD movement could coincide with a contraction in the minimum cost route set for a different OD movement. It is also exactly at changes to the active route-set that the problem of existence/non-existence of (directional) derivatives arises. This is a thorny issue in the sensitivity analysis of UE and makes the analysis rather arduous.
In O’Hare et al (2016) we identify and describe the effects of four mechanisms that govern the variation of the PoA. When the SO route-set expands/contracts, the PoA ‘kicks’ up/down (that is to say the PoA gradient increases/decreases when compared with no route-set expansion/contraction being allowed). When the UE route-set expands/contracts the PoA ‘kicks’ down/up.
In the special case of traffic networks with cost functions of the form = ) + + ϑ, for which ) ,+ ,Κ > 0, it turns out to be surprisingly simple to derive a systematic relationship between the UE and SO link flows,
Λ and Λ , as functions of the OD demand Λ.
Μ Λ
ΝΚ + 1
Ο Π =
1 ΝΚ + 1
A similar relationship between the UE and SO route-set transition points follows from this. For networks with this simple form of cost functions we observed the leading order behaviour of the PoA as it decays back to unity is Α∀1 Θ⁄ ϑ#, where Θ is a global demand multiplier applied to the demand matrix3.
A Network with Multiple ODs
The canonical test network of Sioux Falls4 comprises 24 nodes and 76 links. The cost of travel on each link
[image:7.595.70.528.212.509.2]has cost function of the form = ) + + D () , + > 0 . Demand is increased simultaneously on five of the OD pairs, via the same demand multiplier, ΘΡ, for each OD movement. Figure 5 shows how the PoA fluctuates with demand, active route set changes are labelled as before.
Figure 5 – The Variation of the Price of Anarchy against the Demand Multiplier
The PoA profile comprises many changes to the set of active routes, both expansions and contractions, whose details follow the descriptions in O’Hare et al (2016). Despite capturing these details, we still do not have an efficient practical method for estimating the maximum PoA for a given network across a range of OD demands. PoA bounds are provided by Roughgarden (2003) for different classes of link cost functions, but consider what is the worst possible network giving the maximum PoA, and show this is attained in simple networks. Consequently, in a large network a deliberately minimal OD matrix might be used to effectively limit all link flows to a two-link subnetwork in order to maximise PoA, but this does not satisfactorily address the practical issue of interest: when is PoA maximised within a plausible ensemble of OD matrices?
The influence of topology on the PoA (and hence on network efficiency) for urban road transport remains a substantial area for further research, needing understanding of both the supply-side network infrastructure and the demand configuration, and their interaction. One possible conclusion is that the PoA is rather problematic as an indicator in practical terms; the magnitude and configuration of demand can change
3 See arXiv:1605.03081 on asymptotics of PoA
4 This small city in North Dakota appeared as an example in a 1973 paper on network design. Subsequent papers used
rapidly, both within the day but also structurally from year to year. Any policy intended to improve network efficiency by rerouting traffic needs to take account of these fluctuations and ensure its impact coincides with the demand configurations that offer the greatest gains.
However, we can also allow ourselves the pleasure of finding something interesting, regardless of whether or not it has any obvious practical use. Understanding that links (and routes) can switch ‘off’ as well as ‘on’ is perhaps not surprising after a few moments’ thought. In subsequent tests we came across networks with more complex link switching: a link that started ‘off’, switched ‘on’, switched ‘off’ and switched ‘on’ again, all due to increasing demand on a single OD. Figure 3 shows the simplest network we could find to illustrate contraction of the active route set and a link switching ‘off’. Perhaps is it interesting to imagine how to construct the simplest network that would give an arbitrarily long sequence of on/off switches for some link?
References
BECKMANN M.J., McGUIRE C.B. & WINSTEN C.B. (1956). Studies in the Economics of Transportation. Yale University Press.
O’HARE, S.J., CONNORS, R.D., WATLING, D.P. 2016 . Mechanisms that govern how the Price of Anarchy varies with travel demand. Transportation Research Part B: Methodological, 84, 55-80.
ROUGHGARDEN, T. 2003. The price of anarchy is independent of the network topology. Journal of Computer and System Sciences, 67, 341-364.
ROUGHGARDEN, T. & TARDOS, E. 2002. How bad is selfish routing? Journal of the Acm, 49, 236-259. WARDROP, J. G. Some theoretical aspects of road traffic research. Proceedings of the Institute of Civil
Engineers, Pt II, 1952. 325-378.