1 23
AGE
The Official Journal of the American
Aging Association
ISSN 0161-9152
AGE
DOI 10.1007/s11357-016-9934-x
Computer-based tools for assessing
micro-longitudinal patterns of cognitive function
in older adults
Laura J. E. Brown, Tim Adlam,
1 23
Computer-based tools for assessing micro-longitudinal
patterns of cognitive function in older adults
Laura J. E. Brown&Tim Adlam&Faustina Hwang&Hassan Khadra&
Linda M. Maclean&Bridey Rudd&Tom Smith&Claire Timon&
Elizabeth A. Williams&Arlene J. Astell
Received: 14 January 2016 / Accepted: 13 July 2016
#The Author(s) 2016. This article is published with open access at Springerlink.com
Abstract Patterns of cognitive change over micro-longitudinal timescales (i.e., ranging from hours to days) are associated with a wide range of age-related health and functional outcomes. However, practical issues with conducting high-frequency assessments make investiga-tions of micro-longitudinal cognition costly and burden-some to run. One way of addressing this is to develop cognitive assessments that can be performed by older adults, in their own homes, without a researcher being present. Here, we address the question of whether reli-able and valid cognitive data can be collected over micro-longitudinal timescales using unsupervised cog-nitive tests.In study 1, 48 older adults completed two touchscreen cognitive tests, on three occasions, in
controlled conditions, alongside a battery of standard tests of cognitive functions. In study 2, 40 older adults completed the same two computerized tasks on multiple occasions, over three separate week-long periods, in their own homes, without a researcher present. Here, the tasks were incorporated into a wider touchscreen system (Novel Assessment of Nutrition and Ageing (NANA)) developed to assess multiple domains of health and behavior. Standard tests of cognitive function were also administered prior to participants using the NANA system.Performance on the twoBNANA^ cog-nitive tasks showed convergent validity with, and sim-ilar levels of reliability to, the standard cognitive battery in both studies. Completion and accuracy rates were
L. J. E. Brown (*)
School of Psychological Sciences and Manchester Centre for Health Psychology, The University of Manchester, Room S32, Second Floor, Zochonis Building, Brunswick Street, Manchester M13 9PL, UK
e-mail: [email protected]
T. Adlam
Designability, Royal United Hospital, Bath, UK
F. Hwang
School of Systems Engineering, University of Reading, Reading, UK
H. Khadra
Oxford Technologies Limited, Oxford, UK
L. M. Maclean
Institute of Health and Wellbeing, University of Glasgow, Glasgow, UK
B. Rudd
School of Social and Health Sciences, University of Abertay, Dundee, UK
T. Smith
Generic Robotics Ltd, Reading, UK
C. Timon
Institute of Food and Health, University College Dublin, Dublin, Ireland
E. A. Williams
Human Nutrition Unit, University of Sheffield, Sheffield, UK
A. J. Astell
Centre for Assistive Technology and Connected Healthcare (CATCH), University of Sheffield, Sheffield, UK
A. J. Astell
also very high. These results show that reliable and valid cognitive data can be collected from older adults using unsupervised computerized tests, thus affording new opportunities for the investigation of cognitive function.
Keywords Cognition . Repeated measures . Health . Assessment . Validation
Introduction
Age-related changes in cognitive function can be exam-ined over various timescales. Most commonly, change is considered over relatively long periods, such as months or years, for instance when monitoring the rate of de-cline associated with neurodegenerative conditions (Patterson et al.1999) or to examine improvements in function following an intervention (Antunes et al.
2015). At the other end of the continuum, moment-to-moment variability in performance (i.e., over seconds or minutes) can be assessed using indices such as the standard deviation of reaction times in speeded response time tasks (Jensen1992). Such moment-to-moment var-iability is known to increase with age (Li et al.2004) and has been associated with diverse health and functional outcomes, including increased risk of falling (Graveson et al. 2015), everyday behavioral mistakes (Steinborn et al.2015), as well as future mortality (Shipley et al.
2007) and cognitive decline (MacDonald et al.2003). Variability in cognitive function can also be consid-ered at intermediate orBmicro-longitudinal^ (Palmier-Claus et al.2011) timescales, such as over hours or days. For instance, diurnal variability in cognitive processing is a robust phenomenon in all age groups (Baddeley et al. 1970). Importantly, the extent of this variability is known to increase with age (May et al.1993) and in people with cognitive impairment (Paradee et al.2005), indicating its relationship with health status. Fluctuations in cognitive performance over periods of hours or days are also characteristic of some acute health conditions, such as delirium (American Psychiatric Association 2013), and with physiological changes, such as altered levels of ammonia (Balata et al.2003) and glucose (Somerfield et al.2004) in the blood, dem-onstrating the importance of micro-longitudinal changes as general health indicators. Furthermore, the physio-logical mechanisms underlying micro-longitudinal pat-terns are believed to differ from those underpinning shorter- term , moment- to-m om ent variabili ty
(Schmiedek et al.2013), and so may offer unique infor-mation about the mechanisms underlying age-associated changes in cognition and health (Gamaldo and Allaire2015).
Compared with research over macro (i.e., months-years) or moment-to-moment timescales, knowledge of the nature and relevance of micro-longitudinal patterns of function is relatively limited (Gamaldo and Allaire
2015; Schmiedek et al.2013). One reason for this is the practical difficulties associated with performing repeat-ed cognitive assessments. First, there are the general issues associated with all repeated cognitive testing, such as accounting for practice effects (Bird et al.
2004) and producing multiple sets of equivalent stimuli (Sullivan2005). However, more challenging is the high density of assessments needed to track patterns of per-formance over multiple sessions, which can result in high levels of burden and inconvenience to participants, and cost to the researcher or clinician. These issues are further multiplied in studies that involve the monitoring of additional health or behavioral variables, such as when investigating their temporal associations with cog-nitive change. To advance our understanding of micro-longitudinal patterns of function, there is therefore a need for assessment methods that enable repeated mea-sures of cognition to be taken over periods of hours and days, and that place low burden on participants, re-searchers, and clinicians.
In order to address this, we developed the Novel Assessment of Nutrition and Ageing (NANA) toolkit, which is touchscreen-based software for tracking cog-nitive function, as well as other health and behavioral domains, across micro-longitudinal timescales (Astell et al. 2014). To minimize the cost and burden of micro-longitudinal assessment, the NANA system was specifically developed with older participants, for them to use in their own homes, without a researcher being present. The cognitive tasks were designed to be partic-ularly sensitive to cognitive processing speed, which is known to be indicative of a broad range of health and well-being outcomes in later life (Lara et al.2013). Age-related declines in processing speed have also been shown to account for a large proportion of variance in other cognitive tasks (Tucker-Drob2011), and thus pro-vide an efficient way of gathering informative indicators of cognitive change.
in experimental situations (Tierney et al. 2014). However, the performance of such tests has not yet been examined over micro-longitudinal time periods, in un-supervised settings. In this paper, we therefore address the question of whether it is possible to collect reliable and valid cognitive data over micro-longitudinal time-scales, without a researcher being present. We do this by assessing the performance of two NANA cognitive tasks under both controlled and naturalistic conditions. In study 1, we assessed the usability, validity, and reli-ability of the NANA cognitive tasks when administered in a supervised, laboratory-based environment, but with minimal researcher involvement. In study 2, we assessed the performance of these tasks when used by older adults, unsupervised, in their own homes to collect data over micro-longitudinal timescales. The validity of the tasks as measures of age and health-relevant cogni-tive function was assessed by examining the extent to which performance on the NANA cognitive tasks cor-related with performance on standard tests of cognitive processing speed, as well as tests of higher cognitive functions (episodic memory and executive function), and participant age. Reliability was determined by ex-amining correlations and changes in performance over time.
Study 1
Methods
Participants
Forty-eight community-living adults (17 males) aged 65–89 years (mean = 72 years) provided written in-formed consent to participate in this study, which had been approved by the Fife and Forth Valley Committee on Medical Research Ethics (Ref: 08/S0501/104) and the University of St Andrews Teaching and Research Ethics Committee.
NANA cognitive function tasks
Two touchscreen tasks (the Shopping List task and the Squares task) were programmed in Embarcadero Delphi 2010 and administered on a 15″touchscreen computer (Asus EeeTop, model ET1610PT). The Shopping List task was designed to draw on a broad range of cognitive functions that are known to be markers of age and
health. In particular, the task was modeled on principles of symbol substitution tasks that require participants to use a digit-symbol pairing key to identify the corre-sponding symbols for a series of stimuli as quickly as they can (Lezak et al.2012). Performance on these tasks is believed to depend on a range of cognitive functions, including attention (Strauss et al.2006) and processing speed (Deary et al2010).
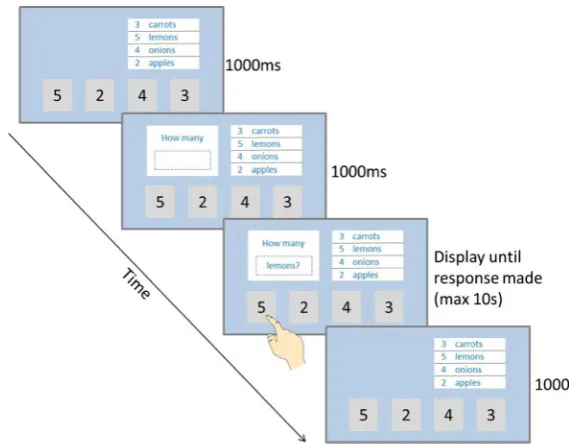
At the start of the Shopping List task, the instruction toBReport what is on the shopping list as quickly as you can^ was presented on the screen. The instruction remained on the screen until the participant touched a box containing the word Bstart.^ Following this, a screen containing a Bshopping list^ in the top right quadrant of the screen, and four response boxes (con-taining the numbers 2–4) along the bottom of the screen, was presented. The shopping list was a white box con-taining the names of four items (apples, carrots, lemons, onions), each preceded by one of the numbers 2, 3, 4, or 5. The order of the four items, and of the numbers preceding them, was randomly determined each time the task was administered, and then remained the same for the duration of the task.
participant completed 20 trials of each version of the task. The order in which participants completed these two versions was counterbalanced between participants so that psychometric properties of each version could be compared with one another. In each 20-trial iteration of the task, each of the four items on the shopping list (apples, carrots, lemons, onions) was presented five times. The order in which the items were presented was randomly determined, with the restriction that the same item was never presented twice in succession. This was to minimize confusion to participants from being asked the same question twice in a row.
Performance on the Shopping List task was assessed according to the accuracy of responses (i.e., the propor-tion of correct responses made) and average response time for correct responses in each session. Median rather than mean response times were calculated for each participant in order to minimize the effects of extreme values (Jensen1992).
The Squares task was a speeded choice response time task, a measure of cognitive processing speed (Deary et al. 2010). This task was designed to be simpler to understand than the Shopping List task in case partici-pants struggled to complete the Shopping List task in unsupervised settings.
At the start of the Squares task, the instruction BTouch the boxes as quickly as you can^was presented on the screen. The instruction remained on screen until the participant touched a box containing the word start. The first trial then began. For this, a black fixation cross
was presented in the center of the screen for 1500 ms. The fixation cross then disappeared, and a gray box (containing a black square) was presented in one of the four locations along the bottom of the screen. The four possible locations and the sizes of the response boxes were the same as those presented in the Shopping List task. The response box disappeared after it had been touched (or after a maximum duration of 10 s, if no response was made). The next trial then began with the fixation cross again being presented. Figure2shows a schematic example of a trial in the Squares task.
Each participant performed 20 trials of the Squares task. In each 20-trial session, each of the four locations was presented five times. The order in which the re-sponse boxes were presented was randomly determined,
Fig. 1 Schematic diagram of a
trial in theBrandom^version of
the Shopping List task
[image:6.547.215.500.49.272.2] [image:6.547.282.502.497.650.2]with the restriction that the same location was not pre-sented more than three times in succession. Performance was assessed by calculating median response times for each session.
Battery of standard measures
A battery of standardized cognitive tests was also administered so that the concurrent validity of the NANA tasks could be established. Four of these tests provided measures of processing speed, which is considered fundamental to many other higher-order cognitive functions (Tucker-Drob
2011) and to be sensitive to age-related change (Lara et al. 2013). These were as follows:
(1) A computerized Speeded Reaction Time task adapted from the PEBL battery (Mueller 2009), in which participants were asked to make a speed-ed keyboard key press each time they saw a black cross in the middle of the computer screen. After two short practice blocks, participants performed two blocks of 15 trials each. The time between a response being made and the next stimulus being presented varied from 1400 to 3200 ms. Performance was measured as the median re-sponse time of rere-sponses made within the valid time window of 150–3000 ms across the two blocks.
(2) The Symbol Digit Modalities Test (SDMT: Smith
1982), in which participants were required to write the corresponding number for each of a series of abstract symbols, according to a number-symbol key printed at the top of the page. The number of correct responses made in a 90-s period was recorded.
(3) A Number Copy Task, in which participants were asked to simply copy randomly generated se-quences of the digits 1–9. This task was scored according to the number of correct responses made in 30 s.
(4) Part A of the Trail Making Test (Spreen and Strauss1998), in which participants are asked to join together numbered circles as quickly as they can. This task was scored as the time taken to correctly join all 25 circles, with any mistakes being called to the participant’s attention by the researcher during task performance.
Executive functions were assessed using three measures.
(1) Part B of the Trail Making Test (Spreen and Strauss
1998) was used to assess the task-switching com-ponent of executive function. In this task, partici-pants are asked to join together a series of num-bered and lettered circles, alternating between numbers and letters. This task is scored in the same way as part A, with shorter completion times indi-cating better performance.
(2) A forwards and backwards digit span task (Lezak et al. 2012) was used as a measure of working memory. For this, the length of the string started at two digits, and then increased by one digit every two trials to a maximum length of nine digits for the forward span task, and eight for the backward span task. The task was discontinued if the partic-ipant failed both items of a given string length. The number of correct responses made to the forwards and backwards task was summed together to give a total digit span score.
(3) A Stroop task (Stroop1935) was administered to assess inhibitory executive functions. This task was administered in three parts: first participants were given a sheet containing 16 rows of 6 rectan-gles, each colored red, blue, or green, and were asked to name the color that each rectangle was printed in as quickly as they could. For the second part, the rectangles were replaced with the neutral words Bwhen,^ Band,^ and Bhard,^ and partici-pants had to name the color that the words were printed in. In the third part, the neutral words were replaced with the color wordsBred,^Bblue,^and Bgreen,^which were always incongruent with the color that the words were printed in. The number of correct responses made in 30 s was recorded for each part. A measure of interference was then calculated for each participant by dividing the number of correct responses made in the third part by the number made in the second part. Lower interference scores therefore indicate a higher amount of interference.
immediate recall was calculated by summing the num-ber of words correctly recalled on each of the three occasions. After a delay of approximately 20 min, the participant was again asked to recall as many of the words as possible. The number of words correctly recalled on this occasion was recorded as the delayed recall score.
Two additional tests were included as measures of global cognitive function and prior cognitive ability, respectively. The Mini Mental Status Examination (MMSE: Folstein et al.1975) contains a series of brief tasks designed to screen for cognitive impairment. It is scored out of 30, with scores below 24 generally taken as an indicator of potential impairment (Iverson1998). The National Adult Reading Test (NART: Nelson,
1982) requires participants to read aloud a series of 50 words with irregular pronunciations, providing a proxy measure of reading ability that is indicative of prior intellectual functioning (Crawford et al.2001). The task is scored according to the number of errors made, and performance has been shown to be relatively resistant to dementia (McGurn et al.2004) and short-term cognitive disturbance (Brown et al.2011).
Procedure
Each participant was invited to attend three separate, individual testing sessions, over a week-long period, so that the validity and reliability of the tasks over micro-longitudinal timescales could be established. In the first session, participants provided demographic details, as well as details about their current use of computers, and completed the short-form Geriatric Depression Scale (Sheik and Yesavage1986). Participants then completed the NANA tasks and standard measures of cognitive function. The order in which participants completed the NANA and standard measures was counterbalanced between participants in order to allow performance on the two sets of tasks to be fairly compared with one another.
Prior to starting the NANA tasks, participants completed a brief process of familiarization with the touchscreen by undergoing a series of practice operations that involved making touchscreen re-sponses to on-screen instructions. When complet-ing the NANA tasks, participants were asked to follow the simple instructions on screen and make their responses by touching the appropriate part of the screen. As the tasks were being developed for
future unsupervised use, the researcher who ad-ministered the tasks minimized additional contact with the participant while they completed the tasks, and only provided additional clarification or reassurance when absolutely necessary.
In addition to the NANA tasks described above, each participant also completed a number of other short touchscreen measures of cognition, mood, and appetite that were also being considered for inclu-sion in the NANA system during the sesinclu-sion. The additional cognitive tasks were not selected for fur-ther development, and so are not reported here. The validation of the mood and appetite measures is reported elsewhere (Brown et al.2016).
The NANA tasks and a subset of the standard mea-sures that were suitable for repeated testing (see Table3) were repeated on each of the subsequent two testing sessions. All participants received a commemorative study mug at the end of their first session, as well as a £5 (approximately $7.5) expense payment for each ses-sion they completed.
Data analysis
As a number of cognitive tasks produced data that were ordinal, not normally distributed, and/or had outliers, non-parametric tests of correlation and dif-ference were used for all analyses. Kendall’s Tau tests were used rather than Spearman’s rank to as-sess correlations as the former are better suited to data containing several tied ranks (Field 2013), which was the case with a number of the variables. Correlation values produced by Kendall’s Tau tests tend to be lower than those of Spearman’s rank due to the different way in which they are calculated (Capéraà and Genest 1993).
tasks that were administered on each testing ses-sion. Friedman tests of difference were also per-formed for each task to determine whether any change in performance occurred over the three testing session, for instance due to practice effects.
Results
Participant characteristics
A procedural error meant that two participants used a different model of computer to perform the NANA tasks, and so their data were excluded from these analyses. The remaining 46 participants (16 males) had a mean age of 72 years (SD = 5.9). Their mean MMSE score was 28.1 (SD = 1.98), and their mean GDS score was 1.32 (SD = 1.73), indicating low levels of cognitive impairment and depression. Two of these participants (both female) were not able to attend a third testing session within the time period of the study, and so only contributed data to the first and second testing sessions.
Education levels among participants were gen-erally high: 46 % were educated to degree level or above, a further 22 % held professional or semi-professional qualifications, 15 % were educated up to the equivalent of A-level, 11 % up to the equivalent of GCSE, and just 7 % held no educa-tional qualifications. Self-reported levels of com-puter use were also high, with the majority of participants (74 %) reporting using them on most days, and a further 15 % using them up to 5 days per week. In response to a question asking how competent they felt when using computers without assistance, five participants (11 %) selected the option Bvery,^ 23 (50 %) selected Bfairly,^ 11 (24 %) selected Ba little,^ and just seven (15 %) selected Bnot at all.^
NANA task performance
Only two participants failed to respond to a single trial of the Shopping List task (one during the second testing session and one during the third), and no participant failed to respond to any trials in the Squares task. The accuracy of participants’ responses was very high in both versions of the
Shopping List task and did not differ across testing sessions (Table 1).
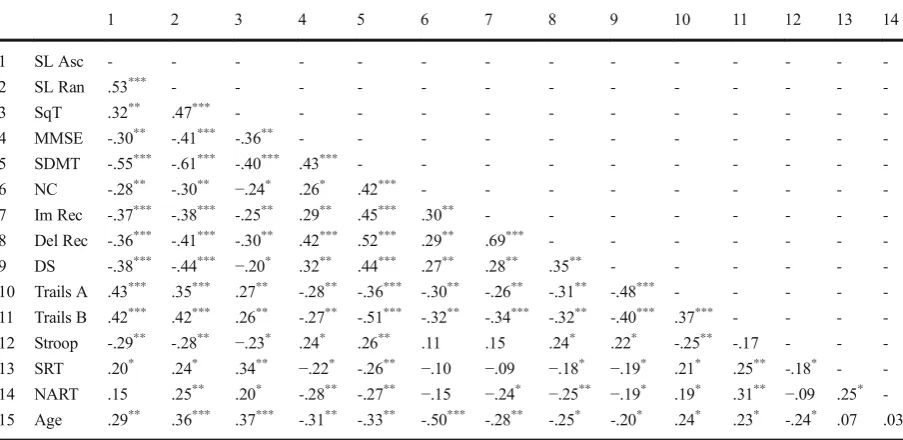
The results of the correlation analyses between performance on all of the NANA and standard cognitive tasks and participant age are shown in Table 2. They show that performance on each of the NANA tasks correlated significantly with al-most all of the standard tasks of cognitive func-tion. Of the NANA tasks, the random version of the Shopping List task showed the strongest pat-tern of correlation with the standard cognitive function tasks. As expected, performance on this task was particularly well correlated with perfor-mance on the Symbol Digit task, indicating high levels of similarity in the cognitive operations involved. Correlations between the NANA tasks and the NART measure of prior cognitive ability were generally lower than with the measures of current cognitive function, indicating that the NANA tasks were better measures of current, rath-er than prior, cognitive ability. As with most of the standard cognitive tasks, all of the NANA tasks also correlated with age, showing their sensitivity to age-related change.
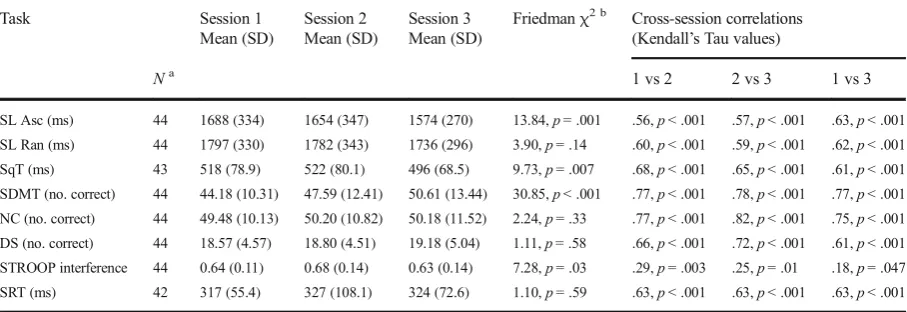
The results of the reliability analyses are shown in Table 3. They show that cross-session correla-tions in performance were significant for all of the NANA and standard cognitive tasks. The strength of the correlation coefficients for the NANA tasks were similar in magnitude to those of the speeded reaction time task, indicating comparable levels of reliability.
Some of the NANA tasks and standard cognitive tasks also showed evidence of significant improvements in performance across the sessions. Pairwise Wilcoxon signed rank tests (one-tailed, uncorrected for multiple comparisons) showed that, for the ascending version of the Shopping List task and the Squares task, there were significant improvements in performance between ses-sions 2 and 3 (Z= 3.18,p= 0.001;Z= 3.20,p< 0.001, respectively), but not between sessions 1 and 2 (Z= 1.21, p= 0.12; Z= 0.14, p= 0.45, respectively). For the Stroop task, significant reductions in interfer-ence were seen between sessions 1 and 2 (Z= 2.03,
p= 0.02), but not between sessions 2 and 3 (Z= 1.43,
in performance across sessions for the random version of the Shopping List task (Table3).
Discussion
Both the Shopping List and the Squares task show validity as reliable tests of processing speed, which has been considered a biomarker of cognitive aging (Deary et al. 2010). There were also significant associations with measure of executive function and verbal episodic memory, perhaps reflecting the fundamental role of processing speed in these higher cognitive abilities (Tucker-Drob 2011), as well as with participant age. Although there was evidence of practice effects for the
ascending version of the Shopping List task and the Squares task, no significant practice effects were ob-served for the random version of The Shopping List task. This task also showed larger correlations with the standard cognitive tasks and participant age than the other NANA tasks, making it the psychometrically strongest of the three.
Study 2
[image:10.547.46.500.67.141.2]The aim of study 2 was to examine the performance of the two NANA cognitive tasks when used by participants, in their own homes, without a researcher being present, over micro-longitudinal timescales. This was done as part of a
Table 2 Kendall’s Tau correlation coefficients between session 1 performance on the NANA tasks, standard cognitive battery, and
participant age in study 1
1 2 3 4 5 6 7 8 9 10 11 12 13 14
1 SL Asc - - -
-2 SL Ran .53*** - - - - - - - - - - - -
-3 SqT .32** .47*** - - -
-4 MMSE -.30** -.41*** -.36** - - -
-5 SDMT -.55*** -.61*** -.40*** .43*** - - -
-6 NC -.28** -.30** −.24* .26* .42*** - - - - - - - -
-7 Im Rec -.37*** -.38*** -.25** .29** .45*** .30** - - - - - - -
-8 Del Rec -.36*** -.41*** -.30** .42*** .52*** .29** .69*** - - -
-9 DS -.38*** -.44*** −.20* .32** .44*** .27** .28** .35** - - -
-10 Trails A .43*** .35*** .27** -.28** -.36*** -.30** -.26** -.31** -.48*** - - - -
-11 Trails B .42*** .42*** .26** -.27** -.51*** -.32** -.34*** -.32** -.40*** .37*** - - -
-12 Stroop -.29** -.28** −.23* .24* .26** .11 .15 .24* .22* -.25** -.17 - -
-13 SRT .20* .24* .34** −.22* -.26** −.10 −.09 −.18* −.19* .21* .25** -.18* -
-14 NART .15 .25** .20* -.28** -.27** −.15 −.24* −.25** −.19* .19* .31** −.09 .25*
-15 Age .29** .36*** .37*** -.31** -.33** -.50*** -.28** -.25* -.20* .24* .23* -.24* .07 .03
SL AscShopping List task with ascending response order,SL RanShopping List task with random response order,SqTSquares Task,MMSE
Mini-Mental Status Examination,SDMTSymbol Digit Modality Test,NCNumber Copy,Im RecImmediate Recall,Del RecDelayed
Recall,DSDigit Span,SRTSpeeded Reaction Time,NARTNational Adult Reading Test,GDSGeriatric Depression Scale,PAPositive
[image:10.547.48.500.400.620.2]Affect,NANegative Affect.*p< 0.05;**p< 0.01;***p< 0.001 (for one-tailed tests)
Table 1 Accuracy rates for the ascending and random order versions of the Shopping List task in each testing session of study 1
Session 1 % accuracy of responses
Session 2 % accuracy of responses
Session 3 % accuracy of responses
Friedmanχ2(d.f. = 2)
Mean (range) Mean (range) Mean (range)
Ascending order 98.41 (85–100) 98.86 (80–100) 98.52 (85–100) 1.25,p= 0.53
larger validation study of the entire NANA toolkit, which included computer-based measures of participants’dietary intake, mood, appetite, grip strength, physical activity, and exhaustion (Astell et al.2014).
Methods
Participants
Forty community-living adults (24 female, 16 male) aged 64–88 years (mean age = 72 years) gave written informed consent to participate in this study, which had been approved by the Fife and Forth Valley Committee on Medical Research Ethics (Ref: 08/S0501/104) and the University of St Andrews Teaching and Research Ethics Committee.
NANA cognitive function tasks
The two NANA cognitive tasks were again administered on a 15″ touchscreen Asus EeeTop computer (model ET1610PT), which formed part of the NANA system hardware. In addition to the cognitive tasks, the NANA system was being used to record dietary intake, physical activity, mood, appetite, grip strength, and exhaustion (Astell et al.2014). A webcam (used for photographing participants’dietary intake as part of the dietary assess-ment function of NANA) was therefore attached to the
top of the computer. In order to integrate the cognitive tasks into the NANA software, they were re-programmed (in C#). During this integration period, some changes to the software were made, as detailed below.
[image:11.547.47.501.68.224.2]As the psychometric properties of the random version of The Shopping List task were shown to be better than those of the ascending version, all of the response options for this task were presented in a randomly determined order in study 2. As in study 1, a random order was created each time the task was administered, and this same random order was then retained for the duration of the task. The response options were presented along with the shopping list, in white text in light gray boxes. The light gray color was used to indicate that the response buttons were not yet active. After theBhow many^ ques-tion stem had been presented for 2000 ms, one of the four shopping list items was presented, and the color of the response boxes turned from gray to green, to indicate that they were now active. The text remained on screen until a response was made or for a maximum of 15 s if no response made. This Btimeout^ period was 5 s longer than in study 1 to allow for a greater range of response times that might occur in the unsupervised test setting. After the question stem and word disappeared from the screen, the color of the response buttons turned back to gray for 1000 ms, before the next trial began. Ten, rather than 20, trials were presented in each iteration of the task due to the larger number of tasks that participants were required to complete in this study. The identity of the food
Table 3 Mean performance levels for the NANA and standard cognitive tasks that were administered in all three testing sessions in study 1
Task Session 1
Mean (SD)
Session 2 Mean (SD)
Session 3 Mean (SD)
Friedmanχ2 b Cross-session correlations
(Kendall’s Tau values)
Na
1 vs 2 2 vs 3 1 vs 3
SL Asc (ms) 44 1688 (334) 1654 (347) 1574 (270) 13.84,p =.001 .56,p <.001 .57,p <.001 .63,p <.001 SL Ran (ms) 44 1797 (330) 1782 (343) 1736 (296) 3.90,p =.14 .60,p <.001 .59,p <.001 .62,p <.001 SqT (ms) 43 518 (78.9) 522 (80.1) 496 (68.5) 9.73,p =.007 .68,p <.001 .65,p <.001 .61,p <.001 SDMT (no. correct) 44 44.18 (10.31) 47.59 (12.41) 50.61 (13.44) 30.85,p <.001 .77,p <.001 .78,p <.001 .77,p <.001 NC (no. correct) 44 49.48 (10.13) 50.20 (10.82) 50.18 (11.52) 2.24,p =.33 .77,p <.001 .82,p <.001 .75,p <.001 DS (no. correct) 44 18.57 (4.57) 18.80 (4.51) 19.18 (5.04) 1.11,p =.58 .66,p <.001 .72,p <.001 .61,p <.001 STROOP interference 44 0.64 (0.11) 0.68 (0.14) 0.63 (0.14) 7.28,p =.03 .29,p =.003 .25,p =.01 .18,p =.047 SRT (ms) 42 317 (55.4) 327 (108.1) 324 (72.6) 1.10,p =.59 .63,p <.001 .63,p <.001 .63,p <.001
SL AscShopping List Task with ascending response order,SL RanShopping List Task with random response order,SqTSquares Task,
SDMTSymbol Digit Modality Test,NCNumber Copy,DSDigit Span,SRTSpeeded Reaction Time
aNote that 44 participants completed all three testing sessions. However, the SqT was not administered to one participant, and the SRT was
not administered to two participants
b
item was randomly determined on each trial, with the restriction that the same food name was never presented twice in succession.
For the Squares task, the initial instruction was al-tered toBTouch the white squares as quickly as you can^ to reflect the different color of the stimuli. As with the Shopping List task, the locations of the four response buttons were presented on screen throughout the task. They remained gray for the first 1500 ms of each trial, and then turned from gray to green to indicate that they were active. When they turned green, a white square was presented in one of the four boxes. The boxes remained green until the participant made a response, or for a maximum of 15 s if no response was made. All four boxes then reverted to the light gray color (with no white square) for 1500 ms, before the next trial began. Four rather than one response option were presented so that accuracy as well as speed of responses could be measured. As the response boxes remained on screen throughout this task, no fixation crosses were presented between trials. Ten trials were presented in each iteration of the task. The location of the white square was ran-domly determined on each trial, with the constraint that no two consecutive trials were the same.
Standard cognitive battery
A subset of the standardized cognitive tests used in study 1 was also administered to participants to assess concur-rent validity of the NANA tasks. This battery comprised the following: the SDMT (Smith1982), Number Copy Task and Part A of the Trail Making Test (Spreen and Strauss1998) to measure processing speed; Part B of the Trail Making Test (Spreen and Strauss1998) to measure executive function; the immediate and delayed recall parts of the Word Recall task to measure verbal episodic memory; the MMSE (Folstein et al. 1975) to measure global cognitive function; and the NART (Nelson1982) to measure prior cognitive ability.
Procedure
Each participant was given the NANA system to use in their home for three periods, each of approximately 7 days in duration, and with a break of approximately 3 weeks between each period of use. At the start of the first period of use, the participant was given the chance to practice brief versions of all the tasks and assessments in the presence of a researcher until they felt comfortable
using the system. They were also given a simple manual for the system and a researcher’s contact number to use if they had problems.
In each period of use, participants were asked to use the NANA system to record everything they ate and drank, as well as to perform various assessments of their physical activity, grip strength, exhaustion, mood, appe-tite, and cognitive function. The two NANA cognitive tasks were scheduled to be administered once per day, following some brief assessments of self-reported mood and appetite (Brown et al. 2016). Participants were prompted to perform these tasks when they interacted with the system by an on-screen message indicating that readings or exercises were due. They were given the option to complete the tasks then or postpone them to later. When an assessment was not completed before the next one was due, multiple assessments would be ad-ministered within a single session, in the same order that they had been scheduled to be completed. Postponed assessments continued to be shown on the system until completed. The number of cognitive assessment due was denoted by a digit on an icon of a head and cog-wheel silhouette in the bottom left hand corner of the screen.
The standard cognitive test battery was administered at baseline (i.e., before the NANA system was installed in the participant’s home) and again at the end of the third period of use. Other data (including measures of depression, weight, physical functioning, and blood and urine analysis) were also collected at times before and after the periods of NANA system use, as part of the wider system validation. These are reported in detail in Astell et al. (2014) and Timon et al. (2015).
Data analysis
As we were interested in establishing the validity of the tests during a single session as well as across a longer period of time, two different time periods of data collection were assessed: first, each participant’s aver-age response time across the whole of the first testing period was calculated. This was done by first calculating their median response time of the 10 trials administered for each test session, and then taking the mean of these values from all of the sessions completed during the first weekly session. The first testing period was selected due to having the closest temporal proximity with the base-line pen and paper cognitive tasks used to assess valid-ity. Second, in order to examine validity for a single test session, the median response time for a single test ses-sion from the middle of the first testing period was extracted. For both of these calculations, only response times to correct trials were included.
In order to determine the reliability of the NANA tasks, Kendall’s Tau tests were used to examine the degree of correlation between average response times across the three testing sessions. Friedman and Wilcoxon tests of difference were used to determine whether any changes in reaction time occurred across the three testing sessions.
Results
Participant characteristics and data collection
The mean MMSE score of the participants was 28.63 (SD = 1.64). Thirty-six of the participants (90 %) report-ed that they had previously usreport-ed a computer, and 32 (80 %) reported being Internet users.
Although each participant was scheduled to complete seven sessions of each NANA cognitive task in each testing period, in some cases, the number of datasets collected was greater or less than this. Reasons for this included the following: administrative errors that result-ed in the systems being collectresult-ed too early, or the wrong number of trials being programmed; technical problems with the systems that led to additional trials being pre-sented; and participants being away from home for part of the measurement period. Some of the datasets that were collected for each task were also subsequently excluded from the final analyses. Specifically, 42 datasets for each of the tasks (5.09 % of total datasets) were excluded as they were collected within 15 min of a previous data collection period, and therefore not con-sidered to truly represent a separate period of assess-ment. An additional four data sets for the Shopping List task and one for the Squares task were also excluded as data from the corresponding cognition or mood tasks had not been collected, indicating an anomaly with the data collection session. The final analysis therefore re-lated to 781 datasets (each containing one participant’s responses to 10 trials of the Shopping List task and 10 trials of the Squares task): 248, 264, and 269 datasets from the first, second, and third testing period, respectively.
NANA task performance
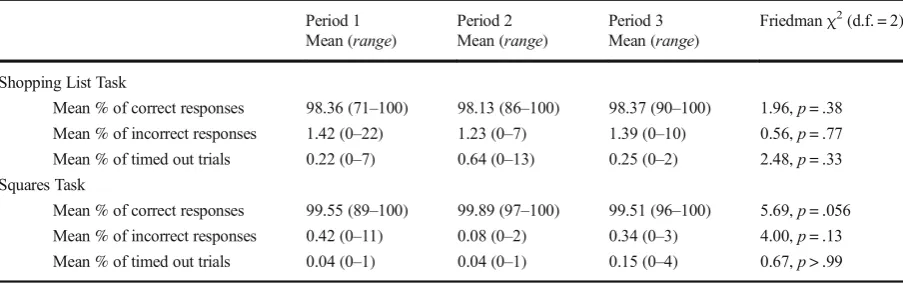
[image:13.547.48.500.517.659.2]As can be seen in Table4, response rates were very high for both tasks, with far less than 1 % of trialsBtiming out^ before a response was made. Average accuracy rates were also very high, and showed no significant changes across the three testing periods (Table 4).
Table 4 Mean percentages of correct, incorrect, andBtimed out^responses made for each NANA task in each of the three testing
periods of study 2
Period 1 Period 2 Period 3 Friedmanχ2(d.f. = 2)
Mean (range) Mean (range) Mean (range)
Shopping List Task
Mean % of correct responses 98.36 (71–100) 98.13 (86–100) 98.37 (90–100) 1.96,p= .38
Mean % of incorrect responses 1.42 (0–22) 1.23 (0–7) 1.39 (0–10) 0.56,p= .77
Mean % of timed out trials 0.22 (0–7) 0.64 (0–13) 0.25 (0–2) 2.48,p= .33
Squares Task
Mean % of correct responses 99.55 (89–100) 99.89 (97–100) 99.51 (96–100) 5.69,p= .056
Mean % of incorrect responses 0.42 (0–11) 0.08 (0–2) 0.34 (0–3) 4.00,p= .13
Only two participants performed one of the tasks at accuracy levels below 40 % (one completed the Shopping List task on one occasion with an accuracy rate of 10 %, and another completed the Squares task on one occasion with an accuracy rate of 30 %, and these were both in the first task session of the first testing period), and these data were removed from the subse-quent validity and reliability analyses. All other tasks were completed at accuracy rates above this, demon-strating that participants were able to understand and complete the tasks, even without a researcher being present.
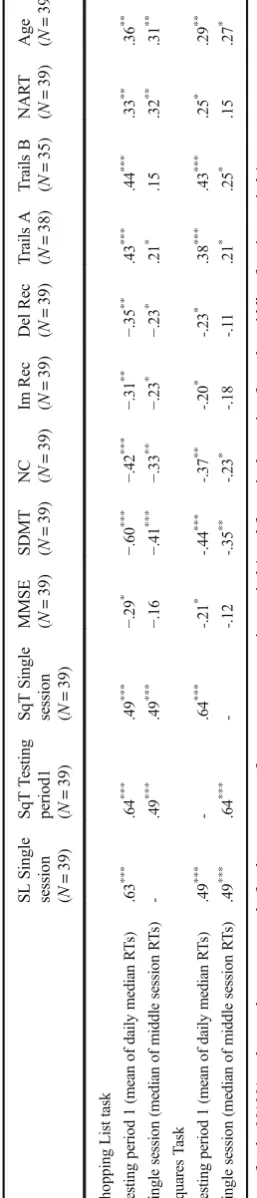
As can be seen in Table 5, response times in the Shopping List and Squares tasks during testing period 1 were significantly correlated with performance on all of the baseline cognitive tests and participant age and at similar levels to those seen in study 1. As in study 1, the strongest correlations were with the SDMT (processing speed) task, and the strength of correlations was greater for the Shopping List than the Squares task. The corre-lations for response times in single task sessions were also significant in most cases, although were generally of a lower magnitude than for performance averaged across the testing period. However, the single session response time data for the two NANA tasks were sig-nificantly and strongly (rτ= .49, p< 0.001) correlated
with one other. Taken together, these results are consis-tent with performance averaged across the session pro-viding a valid measure of average processing speed, and performance within a single session providing a valid measure ofBmomentary^processing speed.
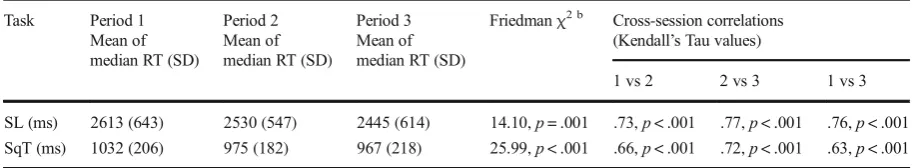
Table6 shows the results of the reliability analyses for the 38 participants who contributed data to all three testing sessions. As with study 1, cross-session correla-tions in performance were significant for all tasks. The strengths of the correlations were generally greater than in study 1, probably because the average session scores for study 2 are calculated from more data points than in study 1. Both tasks also showed evidence of improve-ments in performance across the sessions (Table 6). Pairwise Wilcoxon signed rank tests (one-tailed) showed that these improvements were significant be-tween sessions 1 and 2 (Z= 1.86,p< 0.05) and 2 and 3 (Z= 2.26,p< 0.05) for the Shopping List task. For the Squares task, there were also significant improvements between sessions 1 and 2 (Z= 3.06,p< 0.01), but the change between sessions 2 and 3 did not reach signifi-cance (Z= 1.31,p= 0.096), suggesting a plateauing of
practice effects. Ta
b le 5 Ken d all ’ s T au cor re lat ion coef fic ient s b etw ee n pe rf orma nce o n the NANA tasks and each of th e b ase line standa rd co gniti ve task s and par tic ipant age for study 2 SL Single se ssion ( N = 39) SqT T es tin g
period1 (N
= 39) SqT S ingle sess ion ( N = 39) MM SE ( N = 39)
SDMT (N
=
39)
NC (N
= 39) Im Rec ( N = 39) De l R ec ( N = 39) T ra ils A ( N = 38) T ra ils B ( N = 35) NA R T ( N = 39)
Age (N
[image:14.547.326.455.55.656.2]Discussion
The results of study 2 show that the NANA cognitive tasks were feasible and valid measures of various do-mains of processing speed when administered in partic-ipants’homes, without a researcher being present. This was true even when considering performance during 10-trial sessions of each task, showing that they are suitable for assessing patterns of cognitive function over micro-longitudinal timescales, and alongside other measures of function and behavior. As in study 1, performance on the Shopping List task was more strongly associated with standard cognitive tasks and participant age then performance on the Squares task was, suggesting that the former is better suited to tracking age-related pat-terns of cognitive functioning.
Performance on both of the NANA tasks showed evidence of some practice effects over the three testing periods, although these seemed to be plateauing out for the Squares task. In order to be able to more accurately detect changes in performance that are independent of practice effects, participants may therefore need to use the tasks for a longer period until asymptotic learning levels are reached (Blatter and Cajochen2007).
General discussion
P a tt e r n s o f c o g n i t i v e f u n c t i o n o v e r m i c r o -longitudinal (hours–days) timescales are under-researched (Schmiedek et al. 2013), and yet are essential to our understanding of the mechanisms of cognitive aging (Lindenberger et al. 2007). To this end, we validated two simple cognitive tasks that can be administered in participants’ homes, without a researcher being present, as part of a broader battery of health and behavioral measures. Both tasks were shown to be usable and reliable and showed concurrent validity with a range of standard
tests of cognition known to be sensitive to age- and health-related decline. The tasks therefore show promise as being informative measures of process-ing speed when administered without a researcher present.
Response times for both NANA tasks were correlat-ed with performance on a range of standard cognitive tasks, although these correlations were stronger for the Shopping List task than the Squares task. The Shopping List task was designed to capture the principles of symbol substitution tasks, which are considered to large-ly depend on attention (Strauss et al.2006) and process-ing speed (Deary et al.2010), and to be markers of age-and health-related cognitive change (Lara et al.2013). The strongest correlations for both NANA tasks were with the symbol substitution task, indicating that close operational correspondence was achieved. In addition, performance on the NANA tasks also correlated with measures of executive function (TMTB, Stroop, and digit span) and verbal episodic memory, consistent with the notion that processing speed underpins these higher-order abilities (Baltes and Lindenberger1997; Tucker-Drob 2011). This demonstrates the advantage of mea-suring a more fundamental function, such as processing speed, in holistic assessment contexts such as the NANA system, as the increased efficiency of single tests minimizes the overall number of assessments that need to be administered.
[image:15.547.45.502.67.151.2]The NANA tasks also show promise as indicators of more general changes in participants’health and func-tion. That is, although the predictive ability of the NANA cognitive tasks has not yet been assessed, they have shown convergent validity with other cognitive tasks that have been associated with a range of health outcomes. Importantly though, as the current studies were not designed to measure predictable patterns of cognitive change, such as those associated with diurnal variability (Baddeley et al. 1970) or experimentally induced physiological challenges (Balata et al. 2003;
Table 6 Mean performance levels for the NANA cognitive tasks in each of the three testing periods of study 2
Task Period 1 Period 2 Period 3 Friedmanχ2 b Cross-session correlations
(Kendall’s Tau values)
Mean of median RT (SD)
Mean of median RT (SD)
Mean of median RT (SD)
1 vs 2 2 vs 3 1 vs 3
SL (ms) 2613 (643) 2530 (547) 2445 (614) 14.10,p= .001 .73,p< .001 .77,p< .001 .76,p< .001
SqT (ms) 1032 (206) 975 (182) 967 (218) 25.99,p< .001 .66,p< .001 .72,p< .001 .63,p< .001
b
Somerfield et al.2004), the ability of the tasks to reliably measure within-person changes in cognitive processing speed over micro-longitudinal timescales has yet to be established. The ability of the NANA tasks to reliably measure and predict changes in health and functional status therefore now needs to be formally tested in longitudinal studies.
Although the NANA tasks have been developed to assess micro-longitudinal patterns of cognitive process-ing speed in older adults, it is possible that they may also be useful for examining cognitive patterns in other populations of interest and over different timescales. For instance, the simple nature of the tasks, which were intentionally designed to be comprehensible without the need for a researcher, means that they may also be well suited for use with populations of children, or people with learning disabilities or cognitive impairment. Their use of response times rather than accuracy rates as a dependent variable also means that performance on the tasks will be less affected by ceiling effects. Again, further validation of the NANA cognitive tasks is now required in order to determine their suitability for use with other populations.
There are some limitations of the current re-search. First, the participants who took part in both validation studies had relatively high levels of education and computer experience and showed little evidence of cognitive impairment. It is there-fore unclear how well the tasks would perform, and be tolerated by, more diverse populations of older adults, or those with higher levels of cogni-tive impairment. Second, as the tasks involve lan-guage, images, and motor responses, they may be less well suited to older adults with language comprehension difficulties, or those with severe visual or motor impairments. Finally, the psycho-metric properties of the NANA cognitive tasks were only assessed over three occasions that were relatively close together. As practice effects (Strauss et al. 2006) and levels of acceptability (Palmier-Claus et al. 2013) can change over time, further exploration of the performance of these tests over different timescales is now required.
In conclusion, the results of these studies show that the two computerized cognitive tasks developed for use in older people’s homes enable valid mea-sures of cognitive processing speed to be collected without a researcher being present. Performance on the tasks was shown to be correlated with standard
tasks of a range of cognitive functions that are considered markers of healthy aging (Lara et al.
2013), providing convincing evidence that the NANA tasks will also demonstrate predictive valid-ity of general health and functional abilvalid-ity. Further studies are now needed to determine the validity and usability of these tests when used in more diverse populations, and also to establish their ability to sensitively and reliably measure changes in cogni-tive function over various timescales.
Acknowledgments This work was supported by grant number
ES/G008779/1 awarded to Arlene Astell, Elizabeth Williams, Faustina Hwang, and Tim Adlam from the New Dynamics of Ageing (NDA) Programme. The funding partners of the NDA are as follows: Economic and Social Research Council (ESRC), Engineering and Physical Sciences Research Council (EPSRC), Biotechnology and Biological Sciences Research Council (BBSRC), Medical Research Council (MRC), and Arts and Hu-manities Research Council (AHRC). The authors would like to thank Mr. Ken Munro of the University of St Andrews for pro-gramming all of the momentary tests of cognitive function in study 1, and Sarah Forster, Alan Godfrey, and Simon Halsey for their contributions to the broader NANA project.
Compliance with ethical standard
Conflict of interest The authors report that there are no conflicts
of interest in this work.
Open AccessThis article is distributed under the terms of the
Creative Commons Attribution 4.0 International License (http://creativecommons.org/licenses/by/4.0/), which permits unrestricted use, distribution, and reproduction in any medium, provided you give appropriate credit to the original author(s) and the source, provide a link to the Creative Commons license, and indicate if changes were made.
References
American Psychiatric Association (2013) Diagnostic and Statistical Manual of Mental Disorders, 5th edn. Washington DC.
Antunes HKM, Santos-Galduroz RF, Lemos VDA, Bueno OFA, Rzezak P, de Santana MG, De Melo MT (2015) The influ-ence of physical exercise and leisure activity on
neuropsy-chological functioning in older adults. Age 37. doi:10.1007
/s11357-015-9815-8.
Astell A, Hwang F, Brown L, Timon C, Maclean L, Smith T, Adlam T, Khadra H, Williams E (2014) Validation of the NANA (Novel Assessment of Nutrition and Ageing) touchscreen system for use at home by older adults. Exp
Gerontol 60:100–107
Baddeley AD, Hatter JE, Scott D, Snashall A (1970) Memory and
Balata S, Damink SWMO, Ferguson K, Marshall I, Hayes PC, Deutz NEP, Williams R, Wardlaw J, Jalan R (2003) Induced hyperammonemia alters neuropsychology, brain MR spec-troscopy and magnetization transfer in cirrhosis. Hepatology
37:931–939
Baltes PB, Lindenberger U (1997) Emergence of a powerful connection between sensory and cognitive functions across the adult life span: a new window to the study of cognitive
aging? Psychol Aging 12:12–21
Bird CM, Papadopoulou K, Ricciardelli P, Rossor MN, Cipolotti L (2004) Monitoring cognitive changes: psychometric
proper-ties of six cognitive tests. Brit J Clin Psychol 43:197–210
Blatter K, Cajochen C (2007) Circadian rhythms in cognitive performance: methodological constraints, protocols,
theoret-ical underpinnings. Physiol Behav 90:196–208
Brown LJE, Adlam T, Hwang F, Khadra H, Maclean LM, Rudd B, Smith T, Timon C, Williams EA, Astell AJ (2016) Computerized self-administered measures of mood and ap-petite for older adults: the Novel Assessment of Nutrition and
Ageing (NANA) toolkit. J Appl Gerontol. doi:10.1177
/0733464816630636
Brown LJE, Ferner HS, Robertson J, Mills NL, Pessotto R, Deary IJ, MacLullich AMJ (2011) Differential effects of delirium on fluid and crystallised abilities. Arch Gerotol Geriat 52:153–158
Capéraà P, Genest C (1993) Spearman’spis larger than Kendall’s
τfor positively dependent random variables. J Nonparametr
Stat 2:183–194
Crawford JR, Deary IJ, Starr J, Whalley LJ (2001) The NART as an index of prior intellectual functioning: a retrospective validity study covering a 66-year interval. Psychol Med 31:
451–458
Deary IJ, Johnson W, Starr JM (2010) Are processing speed tasks
biomarkers of cognitive aging? Psychol Aging 25:219–228
Field A (2013) Discovering statistics using IBM SPSS statistics, 4th edn. Sage, London
Folstein MF, Folstein SE, McHugh PR (1975)‘Mini Mental State
’: a practical method for grading the cognitive state of patients
for the clinician. J Psychiatr Res 12:189–198
Gamaldo AA, Allaire JC (2015) Daily fluctuations in everyday
cognition. Is it meaningful? J Aging Health. doi:10.1177
/0898264315611669
Graveson J, Bauermeister S, McKeown D, Bunce D (2015) Intraindividual reaction time variability, falls, and gait in old age: a systematic review. J Gerontol B-Psychol. doi:10.1093/geronb/gbv027
Iverson G (1998) Interpretation of mini-mental state examination scores in community-dwelling elderly and geriatric
neuro-psychiatry patients. Int J Geriatr Psych 13:661–666
Jensen AR (1992) The importance of intraindividual variation in
reaction time. Pers Indiv Differ 13:869–881
Lara J, Godfrey A, Evans E, Heaven B, Brown LJE, Barron E, Rochester L, Meyer T, Mathers JC (2013) Towards measure-ment of the Healthy Ageing Phenotype in lifestyle-based
intervention studies. Maturitas 76:189–199
Lezak MD, Howieson DB, Bigler ED, Tranel D (2012) Neuropsychological assessment, 5th edn. Oxford University Press, Oxford
Li S-C, Lindenberger U, Hommel B, Aschersleben G, Prinz W, Baltes P (2004) Transformations in the couplings among intellectual abilities and constituent cognitive processes
across the life span. Psychol Sci 15:155–163
Lindenberger U, Li S-C, Lövdén M, Schmiedek F (2007) The Center for Lifespan Psychology at the Max Planck Institute for Human Development: overview of conceptual agenda
and illustration of research activities. Int J Psychol 42:229–
242
MacDonald SWS, Hultsch DF, Dixon RA (2003) Performance variability is related to change in cognition: evidence from
the Victoria Longitudinal Study. Psychol Aging 18:510–523
May CP, Hasher L, Stoltzfus ER (1993) Optimal time of day and the magnitude of age differences in memory. Psychol Sci 4:
326–330
McGurn B, Starr JM, Topfer JA, Pattie A, Whiteman MC, Lemmon HA, Whalley LJ, Deary IJ (2004) Pronunciation of irregular words is preserved in dementia, validating
premorbid IQ estimation. Neurology 62:1184–1186
Mueller ST (2009) The PEBL manual (version 1.0).http://pebl.
sourceforge.net. Accessed May 2010.
Nelson HE (1982) National Adult Reading Test (NART): Test Manual. NFER-Nelson, Windsor
Palmier-Claus JE, Myin-Germeys I, Barkus E, Bentley L, Udachina A, Delespaul PAEG, Lewis SW, Dunn G (2011) Experience sampling research in individuals with mental illness: reflections and guidance. Acta Psychiat Scand 123: 12–20
Palmier-Claus JE, Rogers A, Ainsworth J, Machin M, Barrowclough C, Laverty L, Barkus E, Kapur S, Wykes T, Lewis SW (2013) Integrating mobile-phone based
assess-ment for psychosis into people’s everyday lives and clinical
care: a qualitative study. BMC Psychiatry 13:34
Paradee CC, Rapport LJ, Hanks RA, Levy JA (2005) Circadian preference and cognitive functioning among rehabilitation
inpatients. Clin Neuropsychol 19:55–72
Patterson CJS, Gauthier S, Bergman H, Cohen CA, Feightner JW, Feldman H, Hogan DB (1999) The recognition, assessment and management of dementing disorders: conclusions from the Canadian Consensus Conference on Dementia. Can Med
Assoc J 160:s1–s15
Schmiedek F, Lövdén M, Lindenberger U (2013) Keeping it steady: older adults perform more consistently on cognitive
tasks than younger adults. Psychol Sci 24:1747–1754
Sheik JI, Yesavage JA (1986) Geriatric Depression Scale (GDS): recent evidence and development of a shorter version. In: Brink TL (ed) Clinical gerontology: a guide to assessment
and intervention. Hawthorn Press, New York, pp 165–173
Shipley BA, Der G, Taylor MD, Deary IJ (2007) Association between mortality and cognitive change over 7 years in a large representative sample of UK residents. Psychosom Med
69:640–650
Smith A (1982) Symbol Digit Modalities Test (SDMT). Manual (revised). Western Psychological Services, Los Angeles. Somerfield AJ, Deary IJ, Frier BM (2004) Acute hyperglycemia
alters mood state and impairs cognitive performance in
peo-ple with type 2 diabetes. Diabetes Care 27:2335–2340
Spreen O, Strauss E (1998) A compendium of neuropsychological tests: administration, norms, and commentary, 2nd edn. Oxford University Press, Oxford
Steinborn MB, Langner R, Flehmig HC, Huestegge L (2015) Everyday life cognitive instability predicts simple reaction time variability: analysis of reaction time distributions and
Strauss E, Sherman EMS, Spreen O (2006) A compendium of neuropsychological tests: administration, norms, and commentary, 3rd edn. Oxford University Press, Oxford
Stroop JR (1935) Studies of interference in serial verbal reactions.
J Exp Psychol 18:643–662
Sullivan K (2005) Alternate forms of prose passages for the assessment of auditory-verbal memory. Arch Clin
Neuropsych 20:745–753
Tierney MC, Naglie G, Upshur R, Moineddin R, Charles J, Jaakkimainen RL (2014) Feasibility and validity of the
self-administered computerized assessment of mild cognitive im-pairment with older primary care patients. Alz Dis Assoc Dis
28:311–319
Timon CM, Astell AJ, Hwang F, Adlam TD, Smith T, Maclean L, Spurr D, Forster SE, Williams EA (2015) The validation of a computer-based food record for older adults: the Novel Assessment of Nutrition and Ageing (NANA) method. Brit
J Nutr 113:654–664
Tucker-Drob EM (2011) Global and domain-specific changes in