R E S E A R C H
Open Access
Free health care for under-fives, expectant
and recent mothers? Evaluating the impact
of Sierra Leone
’
s free health care initiative
Ijeoma Edoka
1*, Tim Ensor
2, Barbara McPake
3,4, Rogers Amara
5, Fu-Min Tseng
6and Joseph Edem-Hotah
5Abstract
This study evaluates the impact of Sierra Leone’s 2010 Free Health Care Initiative (FHCI). It uses two nationally representative surveys to identify the impact of the policy on utilisation of maternal care services by pregnant women and recent mothers as well as the impact on curative health care services and out-of-pocket payments for consultation and prescription in children under the age of 5 years. A Regression Discontinuity Design (RDD) is applied in the case of young children and a before-after estimation approach, adjusted for time trends in the case of expectant and recent mothers. Our results suggest that children affected by the FHCI have a lower probability of incurring any health expenditure in public, non-governmental and missionary health facilities. However, a proportion of eligible children are observed to incur some health expenditure in participating facilities with no impact of the policy on the level of out-of-pocket health expenditure. Similarly, no impact is observed with the utilisation of services in these facilities. Utilisation of informal care is observed to be higher among non-eligible children while in expectant and recent mothers, we find substantial but possibly transient increases in the use of key maternal health care services in public facilities following the implementation of the FHCI. The diminishing impact on utilisation mirrors experience in other countries that have implemented free health care initiatives and demonstrates the need for greater domestic and international efforts to ensure that resources are sufficient to meet increasing demand and monitor the long run impact of these policies.
Background
The destruction of health infrastructure and flight of qualified health professionals following 11 years (1991– 2002) of brutal civil war contributed to the collapse of Sierra Leone’s health care system. Although some pro-gress has been made in rebuilding the health care sys-tem, Sierra Leone has one of the world’s highest child mortality rates and maternal mortality ratios [1]. Charac-terised by weak infrastructure, shortage of equipment, medical supplies and qualified health professionals, the health care system lacks the capacity to provide ad-equate quality of care. Furthermore, high costs of care and the fear of incurring such costs deter the use of health care services when needed [2].
Against this backdrop, the Free Health Care Initiative (FHCI) was launched on 29th April 2010 to increase
access to formal health care services and address poor maternal and child health outcomes [3, 4]. Under the FHCI, children under the age of 5 years, pregnant women and mothers of young babies (lactating) are exempted from paying any medical charges including consultation fees, medicines and medical supplies in all government health care facilities as well as in facilities contracted by the government to provide free health care under the initiative. Unlike pre-existing national health care exemption rules, the FHCI received significant fi-nancial backing from the Sierra Leone Government and international donor agencies [5, 6]. Furthermore, the FHCI was accompanied by a range of health sector re-forms to improve efficiency in the delivery of health care services. These reforms, which include strengthening the procurement and supply chain management system, strengthening and redistribution of the health workforce as well as payroll cleansing, were to ensure the adequate flow of medical supplies and equipment to points of * Correspondence:ijeoma.edoka@wits.ac.za
1PRICELESS, Wits School of Public Health, Johannesburg, South Africa Full list of author information is available at the end of the article
need as well as the supply of trained health workers particularly to rural areas experiencing critical shortages [3, 7].
In the first few months following the implementa-tion of the FHCI, utilisaimplementa-tion of health service in-creased sharply amongst all beneficiary groups [4, 8]. For example, use of health care services by children under 5 years increased 2.5-fold, the number of preg-nant women making at least one antenatal care (ANC) visit increased by 20 % and average monthly institu-tional deliveries increased by approximately 18 % [4]. In another study, Groen, Kamara [9] reported a 500 % increase in the number of children under 5 years re-ceiving surgical care, which was considerably larger than the 17 % increase observed in children over 5 years.
Studies on the impact of the FHCI are limited and have either been descriptive in design or restrictive in sample sizes, thus limiting the strength of the findings. This study attempts to quantify the impact of the FHCI on child and maternal health care service-use and on out-of-pocket expenditure using large scale national data. For children, we use a Regression Discontinuity Design (RDD) and for maternal health care, a time trend-adjusted before-after estimation approach is ap-plied. Our results suggest that while children under the age of five are less likely to incur out-of-pocket health expenditure, particularly consultation fees, no difference is observed in the absolute level of out-of-pocket ex-penditure incurred as well as in the use of curative health care services in facilities where the FHCI applies. For key maternal health services we find substantial, sig-nificant but possibly transient increases after the imple-mentation of the FHCI.
The rest of the paper is structured as follows: the Methods section provides a description of the survey data used, key study variables and an outline of the esti-mation strategies; the results are presented and dis-cussed in the third and fourth sections, respectively and the fifth section concludes the paper.
Methods
Data and variable description
The study makes use of two recent household sur-veys—the 2011 Sierra Leone Integrated Household Survey (SLIHS), to estimate the effect of the FHCI in children under the age of 5 years and the 2013 Sierra Leone Demo-graphic and Health Survey (DHS), to estimate the effect on maternal health care seeking behaviours.
Sierra Leone Integrated Household Survey (SLIHS)
The 2011 SLIHS is a nationally representative sample of households in Sierra Leone. Approximately 6800 households were selected using a two-stage sampling
process [10] and interviewed between January and De-cember 2011. Data were collected on a wide range of individual and household characteristics, including health service use and health care expenditure. Utilisa-tion of curative health services and out-of-pocket ex-penditure were obtained from the health module questionnaire completed by household heads or household representative persons for each household member. For utilisation, respondents are asked to list two out-patient facilities and health worker cadre vis-ited in a 2-week period preceding the interview. Data on health expenditure and the owner of health facility (for example government/private/non-governmental organisation (NGO)/missionary-owned) were collected only for the first visit. Therefore, we define utilisation as the first out-patient health care facility visited when sick. Given that the FHCI applies only to public facil-ities as well as contracted NGOs and missionary health facilities, we estimate the effect of the FHCI in a subsample of those utilising these facilities. As a ro-bustness check, a subsample of those utilising formal private and informal1 health facilities is used. Total out-of-pocket health expenditure2 is estimated as the sum of consultation and prescription expenditure in-curred for the first out-patient visit. The final sample consists of children between 0 and 10 years who re-ported being ‘sick’ in the past 2 weeks and had complete data on health service utilisation, health ex-penditure, individual and household characteristics.
Demographic and Health Survey (DHS)
The most recent Sierra Leone DHS was conducted be-tween June and December 2013 and interviewed 16,658 women of reproductive age (15–49). It collected detailed experiences of women relating to their most recent child birth over a 5-year recall period. This includes place of delivery, ANC and postnatal care, staff attending, deliv-ery complications, content of ANC and vaccinations given to the baby during its first year. The 5-year retro-spective nature of the survey means that information ex-ists on births occurring both before and after the FHCI was introduced. Mothers’ and households’ socio-demographic characteristics are available in the 2013 DHS and used as controls. These include mothers’age, education (no formal education/ primary/secondary/ higher education) and religion (Christian/others); house-hold location (rural/urban and region—Western, Eastern, Northern and Southern) and, household asset index quintile (lowest/second/third/fourth/highest).
Estimation strategy
The Regression Discontinuity Design
age of 5 years. The RDD is favoured over other quasi-experimental approaches for two reasons. First, RDD is applicable to a single cross-sectional survey when information on multiple time points is not available. Although an earlier survey was conducted in 2003, dif-ferences in survey design and data collection method-ologies meant that data from the 2003 SLIHS were not always comparable to 2011. For example in 2003, data were not collected on prescription expenditure. Second, while a dummy variable approach3can be ap-plied to a single cross-sectional survey data, the fun-damental difference between children between the age of 0–4 years (treatment group) and 5–10 years (con-trol group) could result in biased estimate of the treat-ment effect. The RDD allows the use of one cross-sectional survey data while accounting for bias arising from potentially incomparable groups. It exploits the local randomisation of children around the eligibility threshold of the FHCI to identify the treatment effect. This implies that the level of treatment is discontinu-ous at a cut-off point or threshold value of the assign-ment variable (here, when age is greater or equal to 5 years). As a result of exposure to treatment, a causal effect can be inferred under the following identifica-tion assumpidentifica-tions [11, 12]: the change in the level of treatment at the eligibility threshold is truly discon-tinuous and the assignment variable is observed with-out error; in the absence of the treatment, the outcome of interest is a continuous function of the as-signment variable at the eligibility threshold; and the eligibility threshold is exogenously determined. The last identification assumption which rules out sorting of individuals around the eligibility threshold assumes that individuals are randomly assigned around the lo-cale of the threshold, resulting in a local randomized experiment [11, 12]. In other words, children just below the eligibility threshold are considered to be comparable to children just above the threshold. In this study the presence of a discontinuity in utilisation and out-of-pocket health expenditure at the eligibility threshold is tested using parametric regression ana-lysis [12, 13].
Under the FHCI, all children under the age of five should automatically be eligible for free health care. However, due to limited compliance in some health fa-cilities, not all eligible children receive free health care [14, 15]. Furthermore, some non-eligible children would have continued to receive free health care under pre-FHCI exemptions guidelines. Therefore, the receipt of free health care is not strictly determined by the eligibil-ity rule. Under this scenario, the fuzzy RDD can be used as opposed to the sharp RDD [12].
The fuzzy RDD can be estimated using the instrumen-tal variable approach:
Oi¼ τ0þτ1Fi þ f Zð Þ þi ei ð1Þ
Fi ¼ α0þ α1Ti þg Zð Þ þi i ð2Þ
wheres Oirepresents the study outcomes for child i,
in-cluding utilisation and out-of-pocket health expenditure;F is a binary treatment indicator which equals 1 when child
ireceives free health care and zero otherwise;Ziis age in
months, rescaled to zero at the cut-off point (i. e. Zi= Aɡei−60); Ti is the eligibility indicator which takes the
value of 1 if childi’s age is greater than or equal to 5 years and 0, otherwise (Ti= 1 {Zi≥5 years});f (Zi)andɡ(Zi)are
polynomial functions representing the relationship be-tween the rescaled age variable and the outcome variables; andeiand s iare random error terms.
In this study, F is not directly observed as data were not collected on the receipt of free health care. There-fore we estimate an intention-to-treat (ITT) effect, τ3
(equation 3), by substituting equation (2) into (1) to yield the reduced form [12]:
Oi¼ τr0þτ3Ti þ frð Þ þZi eri ð3Þ
where τ3 captures the difference between the
out-comes of children above and below the eligibility threshold. A linear probability model is applied to esti-mate the effect on health service utilisation (and the probability of receiving free4health care services). For total health care expenditure, a two-part model [16] is applied.
For each outcome, three models are specified to test the robustness of the results to different func-tional forms of f (Zi): a simple linear specification, a
linear interaction specification and a quadratic linear specification. The quadratic specification allows for non-linear relationships between (rescaled) age and the outcome variables, while the interaction specifi-cations allows this relationship (or slope) to vary at either side of the eligibility threshold. The model that best fits the data or the optimal model specifi-cation is determined using the Akaike Information Criteria (AIC)5 [12].
Finally, the differential effect of the FHCI is estimated by disaggregating the full sample into subsamples de-fined by household location (rural/urban) and socioeco-nomic status (below and above median total household expenditure).
Time Trend-adjusted Before-After Estimation Approach
time trends to assess the impact of the FHCI on the utilisation of maternal health care services.
Four key behaviours are examined as binary out-come variables: obtaining four or more ANC visits (the WHO minimum recommendation during preg-nancy) at a public facility (ANC4); delivery in a pub-lic facility and with a skilled health worker; postnatal care obtained within 48 h within a public facility to-gether with vitamin A supplementation 2 months after birth; and uptake of child vaccination during the first year of birth (diphtheria, pertussis, tetanus plus hepatitis and haemophilus influenza type B
given as part of a three course combined
vaccination).
For delivery, postnatal care and vaccinations, we assume that births from May 2010 are affected by the launch of the FHCI. For antenatal outcomes, it is assumed that births after January 2011 are af-fected by the policy. The end date for maternal care was taken to be the month prior to the date of interview. For vaccinations the end date was taken as 1 year prior to the interview to ensure that adequate time had been given to provide the full course of inoculations.
First, we use a mixed effects multilevel logit model [17] unadjusted for time trends (Model 1) to estimate changes in maternal outcomes:
Oijm¼ϕ0þ ϕ2Pm þ ∅Xijm þ ejþvmþ uijm ð4Þ
Where Oijm are the study outcomes for individual i
in districtj at month m; Pm is a policy variable which
that takes a value of 1 when outcomes occur after the FHCI was implemented and 0 otherwise; Xijmis a
vec-tor of covariates including asset index quintiles, age of mother, maternal education and whether location of birth was rural or urban, ej and vm are district and
time specific random effects and uijm is an individual
random error.
A weakness of the before and after design is that, in the absence of a counterfactual, there is no way of knowing whether the outcomes of interest would have changed in the absence of the FHCI. Although there is no comparison group, we mitigate this problem by in-corporating a monthly time trend variable (Mm)
(equa-tion 5) and investigating whether the trend changes after policy implementation. The time trend, Mm, is
coded from 1 (July 2008) to 61 (July 2013). Interaction between the month and policy variables (Mm * Pm) is
added to allow for a different trend effect following the implementation of FHCI. The revised model (Model 2) becomes:
Oijm¼γ0þγ1Mm þ γ2Pm þ γ3MmPm
þΛXijm þ εjþηmþ μijm ð5Þ
Where, εj and ηm are district and time specific
ran-dom effects and μijm is an individual random error.
We use a two-step test for plausible causality to examine whether the structural break in the data oc-curs after policy implementation. Rolling time-series estimation of average monthly outcomes for the en-tire sample period was obtained. Since average out-comes are proportions and so bounded between zero and one, a tobit model is specified using the rolling Stata function (window = 20). The resulting regres-sion coefficients can then be graphed to visually identify structural breaks. A Stata function (estat sbsingle) is then also used to identify an unknown structural break date in the data. Any identified break in the data can in turn be used as an add-itional breakpoint for testing the effect of policy as well as acting as test of plausible causality since a break occurring before or distant from policy imple-mentation suggests that some other factor is causing the change.
Results
Impact on utilisation and out-of-pocket health expenditure in children under 5 years
An important assumption of the RDD is that sort-ing of individuals around the eligibility threshold is completely random [12]. While this assumption cannot be directly tested, it implies similar distri-bution of individual characteristics on both sides of the eligibility threshold. Table 1 show that the two study groups appear balanced for the majority of observed characteristics except for two characteris-tics—age of household head and proportion of household heads with no formal education—both are higher in the group of children over the age of 5 years.
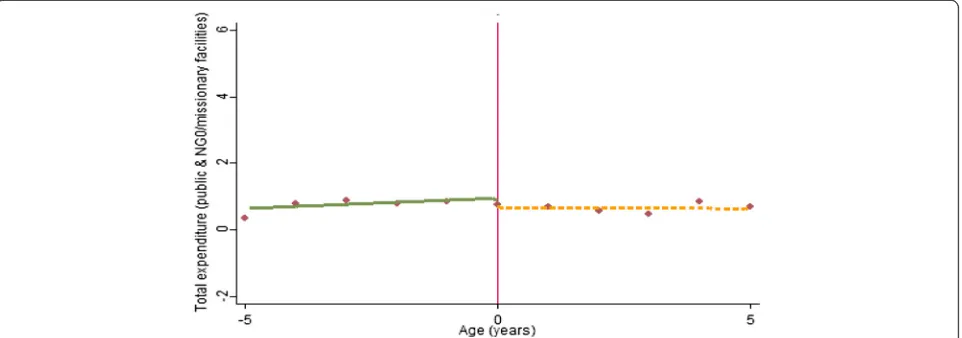
children reporting zero health expenditure—children just under the age of 5 years are more likely to report zero consultation and prescription expend-iture (Fig. 2a). This effect appears to be driven by a higher likelihood of reporting zero consultations (Fig. 2b), as opposed to prescription expenditure where no discontinuity is observed (Fig. 2c). How-ever, for children with a positive expenditure, no clear discontinuity is observed (Fig. 3).
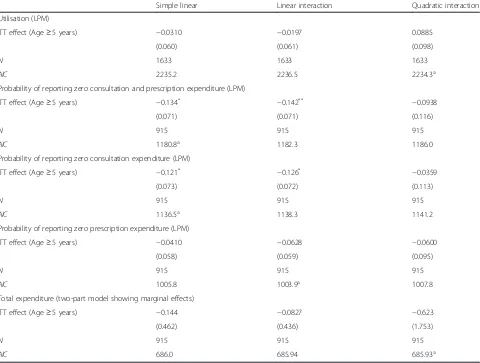
To provide statistical inferences on the presence of discontinuities at the eligibility threshold, we esti-mate a series of parametric models (Table 2). For each outcome, three models are specified—simple linear, linear interaction and quadratic interaction, and the optimal model specification identified on the basis of the lowest AIC. The result shows similar trends seen in Figs. 1, 2, 3. For example, at the opti-mal model specification (linear interaction), non-Table 1Descriptive statistics (if sick)
(1) (2) (3) (4)
Eligible children Non-eligible children Difference (2)–(1) All study children
Child Characteristics
Age in years 2.264 7.355 5.09*** 4.944
Male 0.544 0.525 −0.019 0.534
Household Characteristics
Rural 0.644 0.683 0.039 0.665
Western region 0.123 0.0948 −0.028 0.108
Eastern region 0.128 0.136 0.008 0.132
Northern region 0.422 0.474 0.052* 0.449
Southern region 0.327 0.296 −0.032 0.311
Household size 6.921 7.113 0.192 7.022
Household total expenditure per capita (US$) 293.8 276.2 −17.60 284.6
Head of Household Characteristics
Married 0.851 0.865 0.014 0.859
Age 43.22 45.33 2.11*** 44.33
Male 0.759 0.748 −0.01 0.753
Christian 0.175 0.157 −0.017 0.165
No education 0.693 0.752 0.059** 0.724
Observations 761 872 1633
*
p< 0.1,**
p< 0.05,***
p< 0.01
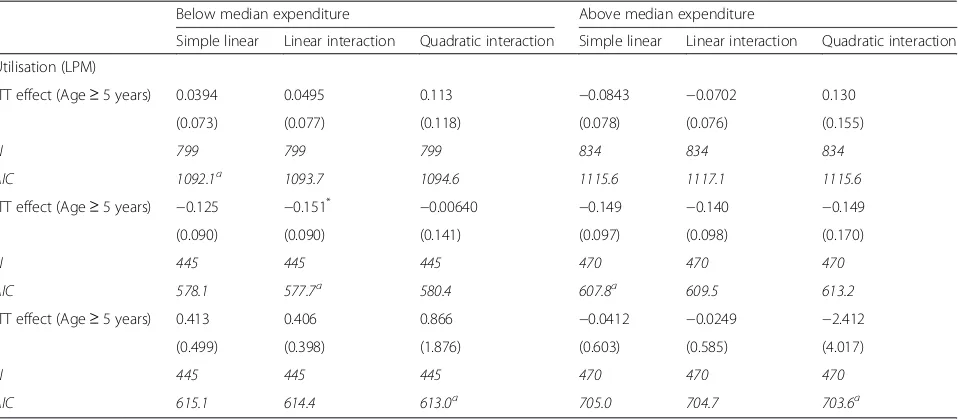
[image:5.595.58.541.97.377.2] [image:5.595.59.537.552.715.2]eligible children are less likely to report zero con-sultation and prescription expenditure. This appears to be driven largely by the lower likelihood of reporting zero consultation expenditure (at p> 0.1 in the optimal model specification). For those making positive payments, no statistically significant differ-ence is observed with the level of total health ex-penditure. Similar to the full sample, the FHCI effect is also observed in children from more deprived backgrounds (children living in rural areas and in poorer households, Appendix 1: Table 6 and Appendix 2: Table 7 respectively). However, these effects are only significant at a 10 % level in the optimal model specification.
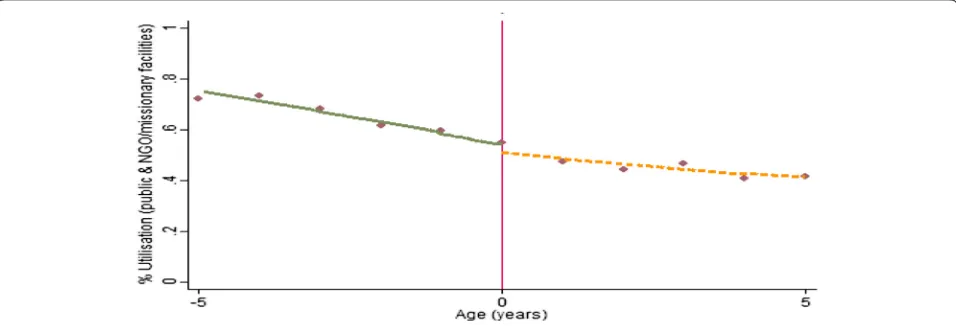
The only departure from the Figures is observed with utilisation of health care services where a
positive ITT effect (higher utilisation in the non-eligible) is observed in the optimal model specifica-tion (Table 2). However, this effect is not statistically significant.
Impact on formal private and informal/other health care service use
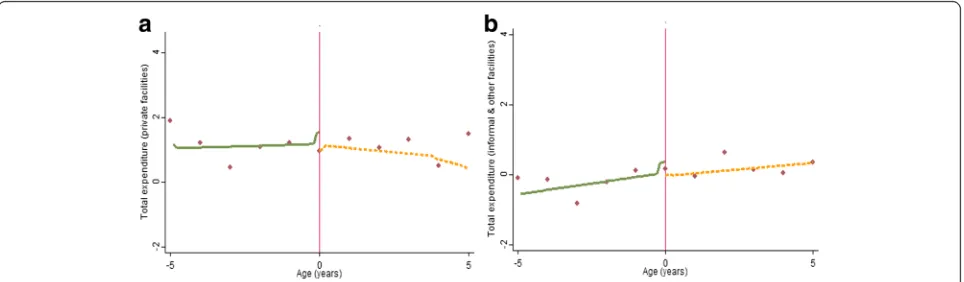
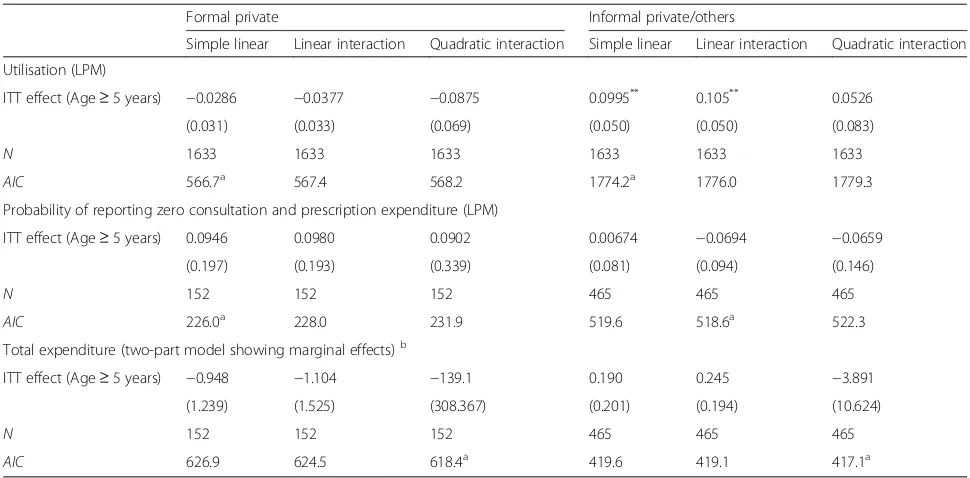
Figures 4, 5, 66 graphically depict the effect of the FHCI on private and informal/other health care service use and out-of-pocket health expenditure. A distinct jump is observed at the eligibility threshold for informal service use—children over the age of 5 years are more likely to use these services (Fig. 4b). The result is confirmed by the parametric model which shows a statistically significant difference (of approximately 10 percentage points) (Table 3).
Fig. 2Non-parametric regression plots showing the probability of reporting zero health expenditure (for those who visit a public health facility), below and above the eligibility threshold (a): Zero consultation and prescription expenditure (b): Zero consultation expenditure (c): Zero prescription expenditure
[image:6.595.57.543.88.260.2] [image:6.595.59.540.534.703.2]Table 2The impact of the FHCI in public/NGO/missionary health facilities
Simple linear Linear interaction Quadratic interaction
Utilisation (LPM)
ITT effect (Age≥5 years) −0.0310 −0.0197 0.0885
(0.060) (0.061) (0.098)
N 1633 1633 1633
AIC 2235.2 2236.5 2234.3a
Probability of reporting zero consultation and prescription expenditure (LPM)
ITT effect (Age≥5 years) −0.134* −0.142** −0.0938
(0.071) (0.071) (0.116)
N 915 915 915
AIC 1180.8a 1182.3 1186.0
Probability of reporting zero consultation expenditure (LPM)
ITT effect (Age≥5 years) −0.121* −0.126* −0.0359
(0.073) (0.072) (0.113)
N 915 915 915
AIC 1136.5a 1138.3 1141.2
Probability of reporting zero prescription expenditure (LPM)
ITT effect (Age≥5 years) −0.0410 −0.0628 −0.0600
(0.058) (0.059) (0.095)
N 915 915 915
AIC 1005.8 1003.9a 1007.8
Total expenditure (two-part model showing marginal effects)
ITT effect (Age≥5 years) −0.144 −0.0827 −0.623
(0.462) (0.436) (1.753)
N 915 915 915
AIC 686.0 685.94 685.93a
Control variables includes region dummies, head of households’age and education Standard errors in parentheses
LPMlinear probability model *
p< 0.1,**p< 0.05 a
Optimal model specification
[image:7.595.56.537.560.700.2]Although there appears to be a discontinuity in the proportion of those reporting zero health expend-iture within formal private health facilities (Fig. 5a), this effect is statistically insignificant (Table 3). This is unsurprising given the high variance observed in the data points, particular above the eligibility threshold (Fig. 5a). Overall, for all those utilising for-mal private or inforfor-mal health care services there appears to be no difference between both groups in the level of total health expenditure.
Impact on maternal health seeking behaviours
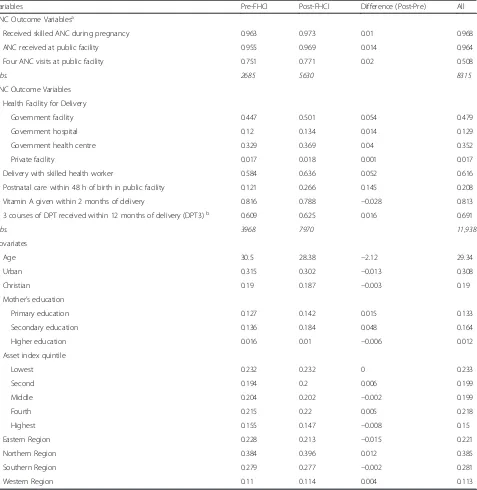
Approximately two thirds of the sample gave birth after the FHCI was in place and so were assumed to be affected by the policy (Table 4). The mean values of most covariates are similar for observations in the pre- and post-FHCI period although the proportion with secondary education is higher in the post-FHCI period. The majority of study outcomes are higher in the post-FHCI group. Of particular note is the in-crease in proportion receiving timely postnatal care
(by 14.5 percentage points). Delivery with a skilled health worker and delivery at a government facility are 5.2 and 5.4 percentage points, respectively, higher in the post-FHCI period.
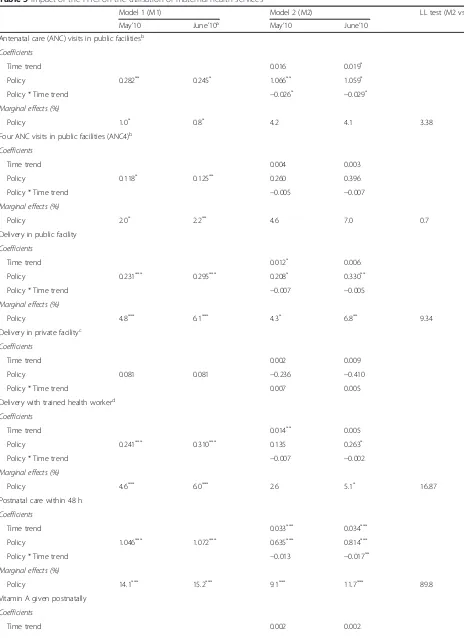
The regression models are estimated for two struc-tural ‘breakpoints’. The first structural breakpoint is based on the official start of the policy. Given that the FHCI was introduced at the end of April 2010, a break point of May 2010 is used. The second is based on the rolling tobit estimation. Visual inspec-tion and the use of the structural break funcinspec-tion find a shift in the intercept for key variables around 2 months after policy implementation.7 Finding a lagged effect is perhaps not surprising since it is likely to take time for health care seeking behaviour to change. Both models are estimated for both policy breakpoints.
A simple before and after comparison, based on equation (4) suggests a statistically significant in-crease (p< 0.01) in ANC4, public facility deliveries, delivery with skilled health workers, postnatal care
Fig. 5Non-parametric regression plots showing the probability of reporting zero health expenditure (for those who visit a health facility), below and above the eligibility thresholdaPrivate formal health facilitiesbInformal/other health facilities
[image:8.595.57.540.88.224.2] [image:8.595.58.540.563.704.2]and 3rd course DPT in the post-FHCI period (Table 5, Model 1). Similar changes in the propor-tion of women reporting each outcome (marginal effects) are reported for the two breakpoints. As ex-pected, given that the FHCI mostly only applies to public services, there is no significant increase in private delivery care.
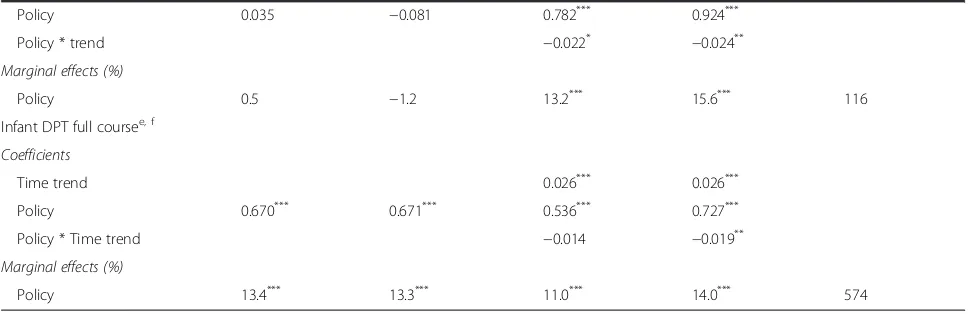
Incorporating month and interaction terms into the model helps to separate the effect of the inter-vention from general trends in outcome variables (Table 5, Model 2). The marginal effects of the im-mediate policy impact are mostly larger in Model 2 compared to Model 1 particularly for services pro-vided postnatally: 15.6 % for vitamin A supplementa-tion (p< 0.01) and 14.0 % for full course DPT vaccination for infants (p< 0.01). The modest increase in delivery with a trained health worker (5.1 %, p< 0.1) contrasts with the larger impact (6.8 %, p< 0.05) for delivery in a government facility suggesting that some of the ef-fect of the policy may be to incentivise women to de-liver in a facility rather than with a trained health worker at home. The effects are generally larger for the breakpoint of June rather than May, supporting a lagged effect of the policy change. Likelihood ratio tests justify selection of Model 2 over Model 1 for all but use of private facilities and ANC4.
A general improvement in outcomes over time, in-dependent of the policy, is suggested for delivery with a trained health worker, use of postnatal care and full course DPT to infants. The negative coefficients on most of the policy-time trend interactions suggest that the policy effect may diminish over time. In most cases this coefficient is lower in absolute value than the general trend term suggesting that outcomes con-tinue to improve but at a slower rate than in the past. The results are robust to disaggregation by region and into rural and urban areas (the impact is slightly larger in rural areas).
Discussion
[image:9.595.55.540.97.336.2]This study investigates the extent to which Sierra Leone’s FHCI increased access to health care ser-vices and reduced financial risks associated with seeking health care among beneficiaries of the pol-icy. Our results suggest that children under the age of 5 years (eligible children), are less likely to pay consultation and prescription charges in public health facilities where the FHCI applies. However this effect fails to translate into a discernible im-pact on children’s use of health care services. One reason why the FHCI may have had less impact than expected on utilisation is the costs that are Table 3The impact of the FHCI in formal and informal health facilities
Formal private Informal private/others
Simple linear Linear interaction Quadratic interaction Simple linear Linear interaction Quadratic interaction
Utilisation (LPM)
ITT effect (Age≥5 years) −0.0286 −0.0377 −0.0875 0.0995** 0.105** 0.0526
(0.031) (0.033) (0.069) (0.050) (0.050) (0.083)
N 1633 1633 1633 1633 1633 1633
AIC 566.7a 567.4 568.2 1774.2a 1776.0 1779.3
Probability of reporting zero consultation and prescription expenditure (LPM)
ITT effect (Age≥5 years) 0.0946 0.0980 0.0902 0.00674 −0.0694 −0.0659
(0.197) (0.193) (0.339) (0.081) (0.094) (0.146)
N 152 152 152 465 465 465
AIC 226.0a 228.0 231.9 519.6 518.6a 522.3
Total expenditure (two-part model showing marginal effects)b
ITT effect (Age≥5 years) −0.948 −1.104 −139.1 0.190 0.245 −3.891
(1.239) (1.525) (308.367) (0.201) (0.194) (10.624)
N 152 152 152 465 465 465
AIC 626.9 624.5 618.4a 419.6 419.1 417.1a
Control variables includes region dummies, head of households’age and education Standard errors in parentheses
LPMlinear probability model **
p< 0.05 a
Optimal model specification b
still incurred by users. Although our findings show that eligible children are on average less likely to incur any out-of-pocket health expenditure in pub-lic facilities, a proportion of eligible children still do at levels comparable to non-eligible children. These findings are consistent with other studies which have shown that other beneficiaries of the FHCI (pregnant women and recent mothers), often
[image:10.595.62.539.99.589.2]bear the cost of medicines and medical supplies in public health care facilities [14, 15, 19]. In public health facilities, medicines are available either as FHCI drugs for FHCI beneficiaries or as cost re-covery drugs for non-beneficiaries. Apparent short-ages of FHCI medicines in these facilities often result in beneficiaries paying for medicines under the cost recovery scheme [14, 15]. The limited Table 4Mean characteristics of women before and after the FHCI
Variables Pre-FHCI Post-FHCI Difference (Post-Pre) All
ANC Outcome Variablesa
Received skilled ANC during pregnancy 0.963 0.973 0.01 0.968
ANC received at public facility 0.955 0.969 0.014 0.964
Four ANC visits at public facility 0.751 0.771 0.02 0.508
Obs. 2685 5630 8315
PNC Outcome Variables
Health Facility for Delivery
Government facility 0.447 0.501 0.054 0.479
Government hospital 0.12 0.134 0.014 0.129
Government health centre 0.329 0.369 0.04 0.352
Private facility 0.017 0.018 0.001 0.017
Delivery with skilled health worker 0.584 0.636 0.052 0.616
Postnatal care within 48 h of birth in public facility 0.121 0.266 0.145 0.208
Vitamin A given within 2 months of delivery 0.816 0.788 −0.028 0.813
3 courses of DPT received within 12 months of delivery (DPT3)b 0.609 0.625 0.016 0.691
Obs. 3968 7970 11,938
Covariates
Age 30.5 28.38 −2.12 29.34
Urban 0.315 0.302 −0.013 0.308
Christian 0.19 0.187 −0.003 0.19
Mother’s education
Primary education 0.127 0.142 0.015 0.133
Secondary education 0.136 0.184 0.048 0.164
Higher education 0.016 0.01 −0.006 0.012
Asset index quintile
Lowest 0.232 0.232 0 0.233
Second 0.194 0.2 0.006 0.199
Middle 0.204 0.202 −0.002 0.199
Fourth 0.215 0.22 0.005 0.218
Highest 0.155 0.147 −0.008 0.15
Eastern Region 0.228 0.213 −0.015 0.221
Northern Region 0.384 0.396 0.012 0.385
Southern Region 0.279 0.277 −0.002 0.281
Western Region 0.11 0.114 0.004 0.113
a
Policy implementation assumed to be 9 months prior to delivery date b
Table 5Impact of the FHCI on the utilisation of maternal health services
Model 1 (M1) Model 2 (M2) LL test (M2 vs. M1)
May’10 June’10a May’10 June’10
Antenatal care (ANC) visits in public facilitiesb
Coefficients
Time trend 0.016 0.019*
Policy 0.282** 0.245* 1.066** 1.059*
Policy * Time trend −0.026* −0.029*
Marginal effects (%)
Policy 1.0* 0.8* 4.2 4.1 3.38
Four ANC visits in public facilities (ANC4)b
Coefficients
Time trend 0.004 0.003
Policy 0.118* 0.125** 0.260 0.396
Policy * Time trend −0.005 −0.007
Marginal effects (%)
Policy 2.0* 2.2** 4.6 7.0 0.7
Delivery in public facility
Coefficients
Time trend 0.012* 0.006
Policy 0.231*** 0.295*** 0.208* 0.330**
Policy * Time trend −0.007 −0.005
Marginal effects (%)
Policy 4.8*** 6.1*** 4.3* 6.8** 9.34
Delivery in private facilityc
Coefficients
Time trend 0.002 0.009
Policy 0.081 0.081 −0.236 −0.410
Policy * Time trend 0.007 0.005
Delivery with trained health workerd
Coefficients
Time trend 0.014** 0.005
Policy 0.241*** 0.310*** 0.135 0.263*
Policy * Time trend −0.007 −0.002
Marginal effects (%)
Policy 4.6*** 6.0*** 2.6 5.1* 16.87
Postnatal care within 48 h
Coefficients
Time trend 0.033*** 0.034***
Policy 1.046*** 1.072*** 0.635*** 0.814***
Policy * Time trend −0.013 −0.017**
Marginal effects (%)
Policy 14.1*** 15.2*** 9.1*** 11.7*** 89.8
Vitamin A given postnatally
Coefficients
impact of the FHCI in removing or reducing finan-cial barriers to accessing care may therefore
ex-plain the limited impact observed with the
utilisation of public health facilities.
Additional factors that may be impeding greater im-pact include the remaining costs of accessing ‘free’care, such as transportation costs which can be significant and sometimes more significant than user fees them-selves [20]; and the extent to which human resource fac-tors are successfully addressed and support positive staff attitudes to patients claiming exemptions and constrain the denial of exemptions or emergence of informal charges [21].
As expected, no effect is observed with the use of formal private care facilities but interestingly, we ob-serve a significantly higher use of informal health care services among non-eligible children. This has important implications for the health of non-eligible children who appear to be seeking less expensive and potentially lower quality care from informal health providers and vendors. The absence of an ef-fect on the probability of paying for health care ser-vices (and with the level of payments made) is expected given that the FHCI does not apply in in-formal health facilities.
For maternal care, the before- after analysis ad-justed for time-trends suggests that the use of pub-lic facilities for delivery and postnatal care by women as well as for vaccination of infants in-creased in the post-FHCI period. The improvement is greater if a lagged effect (2 months) of policy is
assumed. The policy changes are statistically signifi-cant and substantial but the impact seems to
de-grade over time, reflected in the negative
interaction terms that reduce the pre-policy trend improvements in outcomes. These findings are sup-ported by other studies which showed that the positive effect of the FHCI on utilisation observed within the first few months of implementation was not sustained [4, 8].
While not a focus of this study, it is worth not-ing that the improvements observed in the use of maternal health services may not necessarily trans-late into better health outcomes for mothers and children. For example, between the 2008 and 2013 DHS, no significant change was observed in infant and under-five mortality. Maternal mortality on the other hand appeared to have increased (although not statistically significant). Nevertheless in 2013, Sierra Leone ranked highest globally in terms of maternal mortality ratio [22].
[image:12.595.56.540.101.258.2]Limitations of this study relate to methods and the time period for which data are available. The policy was introduced at a single time point for the whole country, which did not allow for control groups suit-able for comparing with those affected. For the ana-lysis of maternal health-seeking behaviour, the lack of a control group means that we cannot compare changes in the intervention group with a comparable counterfactual. We mitigate this to some extent by examining the effect on service use in the months before and after the implementation of the policy
Table 5Impact of the FHCI on the utilisation of maternal health services(Continued)
Policy 0.035 −0.081 0.782*** 0.924***
Policy * trend −0.022* −0.024**
Marginal effects (%)
Policy 0.5 −1.2 13.2*** 15.6*** 116
Infant DPT full coursee, f
Coefficients
Time trend 0.026*** 0.026***
Policy 0.670*** 0.671*** 0.536*** 0.727***
Policy * Time trend −0.014 −0.019**
Marginal effects (%)
Policy 13.4*** 13.3*** 11.0*** 14.0*** 574
All models control for covariates listed in Table4& estimated with district and time (month) random effects *
p< 0.1,**p< 0.05,***p< 0.01 a
Alternative policy impact date suggested by the breakpoint function utilised b
Policy implementation assumed to be 9 months prior to delivery date c
Marginal effects could not be estimated d
Includes doctor, midwife and MCH aide e
Slightly lower but still significant result recorded where mother reported vaccinations also included f
and incorporate a monthly time-trend into the model. We cannot be sure, however, that a similar change would not have occurred in a counterfactual group although it does seem unlikely that the same monthly changes would have been observed unless a separate policy with similar expected effects had been implemented at the same time. We are not aware of such a policy.
For the effect on children, the RDD approach per-mits the identification of effect using one time period. However, we are unable to verify causality of effect [23]. Instead an intention- to-treat effect is es-timated due to lack of direct information on whether children were completely exempted from paying any fees in public health facilities. In this study receipt of free health care was inferred from responses to two survey questions – the use of health care ser-vices and consultation and prescription expenditure incurred as a result. We assume that children re-ceived free health care if no consultation and pre-scription expenditure was reported following a visit to a health facility. However, we cannot rule out payments made for the use of other health services such as diagnostic services. Furthermore, frequent medicine and medical supply shortages and stock-outs within health facilities [14, 15, 19] may result in ‘zero’ prescription expenditure being reported not because medication was received free of charge but because prescribed medicines were not available. A future household survey might aim to include a question about the exemption experience of children and mothers to allow identification of causal effects. Furthermore, the RDD is undertaken using data that were collected relatively soon after policy implemen-tation. It may be that as the policy becomes better known and embedded in the system, the effect may increase. The declining effect on maternal service use is salutary, however, suggesting if anything, a re-ducing impact over time. Of course, in the period in which it might have settled and stabilised, the Ebola outbreak disrupted every aspect of health care provision in the country and therefore the availabil-ity of further data for later periods will not be able to settle this question.
Conclusion
As with other cases of policy that focuses on re-lieving demand side constraints to health service use, impact is constrained by supply side capacity [21, 24]. In Sierra Leone’s case, a number of mea-sures were taken to strengthen supply-side capacity, especially in relation to human resources [7, 21]. While some progress appears to have been made
with the health workforce [7], the evidence
suggests that supply side reforms were insufficient [21], perhaps especially in relation to ensuring suf-ficient medicines supply to support those receiving services under the FHCI. It is possible that the in-significant apparent effect of the FHCI on out-of-pocket expenditures made on behalf of children reflects weak monitoring and accountability within the medicines procurement and supply chain
sys-tem [14, 15, 19]. Problems of service
under-utilisation cannot be resolved by addressing the de-mand-side constraints only and supply-side con-straints will have to be sufficiently addressed before the full potential of the FHCI can be realised. For example, governance and accountability within health facilities might be reinforced through the use of payment mechanisms (such as payment for performance) that explicitly reimburse health facil-ities for providing services to beneficiaries of the FHCI [25]. Other supplementary demand-side pol-icies that address physical barriers to accessing health facilities are equally germane particularly in rural areas where health facilities are sparsely dis-tributed and accessibility made worse by poor road networks [26].
The 2014–15 Ebola out-break in Sierra Leone has cast the failings of its health system into sharp relief, but may also be the harbinger of new resources and commitment to health system strengthening, through which a reinforced FHCI might achieve its undoubted potential to improve women and children’s access to health care.
Endnotes
1
These include traditional healers, traditional birth attendants, spiritualist, patent medicine vendors and other health workers in undefined facilities.
2
Health care expenditure was originally collected in Leones. We converted this to USD using 2011 exchange rate.
3
Here, a binary variable that describes beneficiaries of the FHCI captures the treatment effect as the differ-ence in outcomes between beneficiaries and non-beneficiaries.
4
Free health care is inferred from reporting visits to a health care facility and zero consultation and prescrip-tion expenditure.
5
Model specification yielding the lowest AIC is consid-ered the optimal specification that best fits the data.
6
Figures 4, 5, 6 are estimated similarly to Figs. 1, 2, 3. 7
Appendix 1
[image:14.595.58.539.130.339.2]Appendix 2
Table 6Impact of the FHCI in Public/NGO/Missionary Health Facilities by Household Location
Rural Urban
Simple linear Linear interaction Quadratic interaction Simple linear Linear interaction Quadratic interaction
Utilisation (LPM)
ITT effect (Age≥5 years) −0.0614 −0.0534 −0.0516 −0.0243 −0.0039 0.265
(0.057) (0.063) (0.102) (0.124) (0.120) (0.195)
N 1200 1200 1200 433 433 433
AIC 1554.1a 1555.9 1559.5 587.2 587.7 581.8a
ITT effect (Age≥5 years) −0.136*
−0.143**
−0.162 −0.159 −0.169 0.113
(0.073) (0.072) (0.119) (0.173) (0.174) (0.256)
N 707 707 707 208 208 208
AIC 900.3a 902.0 905.9 283.3a 285.0 285.6
ITT effect (Age≥5 years) −0.210 −0.276 0.563 0.709 0.517 −4.024
(0.424) (0.508) (1.302) (1.165) (0.915) (4.105)
N 707 707 707 208 208 208
AIC 586.2 585.9 585.6a 878.4 876.2 875.7a
Control variables includes region dummies, head of households’age and education Standard errors in parentheses
LPMlinear probability model *
p< 0.1,**
p< 0.05 a
Optimal model specification
Table 7Impact of the FHCI in Public/NGO/Missionary Health Facilities by Total Household Expenditure
Below median expenditure Above median expenditure
Simple linear Linear interaction Quadratic interaction Simple linear Linear interaction Quadratic interaction
Utilisation (LPM)
ITT effect (Age≥5 years) 0.0394 0.0495 0.113 −0.0843 −0.0702 0.130
(0.073) (0.077) (0.118) (0.078) (0.076) (0.155)
N 799 799 799 834 834 834
AIC 1092.1a 1093.7 1094.6 1115.6 1117.1 1115.6
ITT effect (Age≥5 years) −0.125 −0.151* −0.00640 −0.149 −0.140 −0.149
(0.090) (0.090) (0.141) (0.097) (0.098) (0.170)
N 445 445 445 470 470 470
AIC 578.1 577.7a 580.4 607.8a 609.5 613.2
ITT effect (Age≥5 years) 0.413 0.406 0.866 −0.0412 −0.0249 −2.412
(0.499) (0.398) (1.876) (0.603) (0.585) (4.017)
N 445 445 445 470 470 470
AIC 615.1 614.4 613.0a 705.0 704.7 703.6a
Control variables includes region dummies, head of households’age and education Standard errors in parentheses
LPMlinear probability model *p
< 0.1 a
[image:14.595.60.539.480.690.2]Authors’contributions
IE undertook the SLIHS analysis and produced the first draft of the manuscript; TE undertook the DHS analysis and contributed to the overall structure of the manuscript; BM contributed to the interpretation and discussion of the results; FT contributed to the design of the parametric models; RA and JEH provided access to the SLIHS and contributed to the discussion of the results. All authors read, edited and approved the final manuscript.
Competing interests
The authors declare that they have no competing interests.
Author details
1PRICELESS, Wits School of Public Health, Johannesburg, South Africa. 2Institute of Health Sciences, University of Leeds, Leeds, UK.3Institute for Global Health and Development, Queen Margaret University Edinburgh, Edinburgh, UK.4Nossal Institute for Global Health, University of Melbourne, Melbourne, Australia.5Rebuild Consortium, College of Medicine and Allied Health Sciences, University of Sierra Leone, Freetown, Sierra Leone. 6Department of Surgery and Cancer, Imperial College London, London, UK.
Received: 7 April 2016 Accepted: 13 May 2016
References
1. UNDP, United Nations Human Development Reports- Sierra Leone. New York, USA: United Nations Development Programme (UNDP); 2013. 2. Amnesty Internationa. Out of reach: cost of maternal health in Sierra Leone.
London: Amnesty International; 2009.
3. GoSL. Free healthcare services for pregnant and lactating women and young children in Sierra Leone. Freetown: Government of Sierra Leone; 2009.
4. MoHS. 2010 health sector performance report. Sierra Leone: Ministry of Health and Sanitation; 2012.
5. Donnelly J.How did Sierra Leone provide free health care?The Lancet. 2011;377(9775):1393–6.
6. Yates R. Insight on free health care launch in Sierra Leone. London: DFID Human Development Resource Centre; 2010.
7. Witter S, Wurie H, Bertone MP. The free health care initiative: how has it affected health workers in Sierra Leone? Health Policy Plan. 2015;0(0):1–9.
8. Liaqat S, Ferry J. Free health care six months on: what does it mean for child health in Northern Bombali? London: Health Poverty Action; 2011.
9. Groen RS et al. Free health care for under 5 year olds increases access to surgical care in Sierra Leone: an analysis of case load and patient characteristics. World J Surg. 2013;37:1216–9.
10. Statistics Sierra Leone. Sierra Leone integrated household survey (SLIHS) 2011 enumerators manual. Freetown: Statistics Sierra Leone (SSL); 2011. 11. Imbens G, Lemieux T. Regression discontinuity designs: a guide to practice.
J Econ. 2008;142(2):615–35.
12. Lee DS, Lemieux T. Regression discontinuity designs in economics. J Econ Lit. 2010;48(2):281–355.
13. Jacob R et al. A practical guide to regression discontinuity. New York: MDRC; 2012.
14. Amnesty International. At a crossroads: Sierra Leone’s free health care policy. London: Amnesty International; 2011.
15. Moszynski P. Sierra Leone’s maternal health reforms fail to deliver free treatment, says Amnesty International. BMJ. 2011;343:d5645.
16. Mullahy J. Much ado about two: reconsidering retransformation and the two-part model in health econometrics. J Health Econ. 1998;17(3):247–81. 17. StataCorp. Multilevel Mixed-Effects Reference Manual: Stata Release 13
Statistical Software. College Station, Texas, USA: StataCorp LP; 2013. 18. Imbens G, Kalyanaraman K. Optimal bandwidth choice for the regression
discontinuity estimator. Rev Econ Stud. 2012;79(3):933–59. 19. Maxmen A. Sierra Leone’s free health-care initiative: work in progress.
Lancet. 2013;381(9862):191–2.
20. James C et al. To retain or remove user fees? Appl Health Econ Health Policy. 2006;5(3):137–53.
21. Mcpake B et al. Removing financial barriers to access reproductive, maternal and newborn health services: the challenges and policy implications for human resources for health. Hum Resour Health. 2013;11(1):46. 22. WHO et al. Trends in maternal mortality: 1990–2013. Estimates by WHO,
UNICEF, UNFPA, the world bank and the united nations population division. Geneva: WHO; 2014.
23. Hahn J, Todd P, Van der Klaauw W. Identification and estimation of treatment effects with a regression-discontinuity design. Econometrica. 2001;69(1):201–9.
24. Mcpake B et al. Removing user fees: learning from international experience to support the process. Health Policy Plan. 2011;26 suppl 2:ii104–17. 25. OECD and WHO. Paying for Performance in Health Care: Implications for
health system performance and accountability, ed. C. Cashin, et al. 2014: Open University Press - McGraw-Hill.
26. Pushak N, Foster V. Sierra Leone’s infrastructure: a continental perspective. In: Africa infrastructure country diagnostic report. Washington DC: The International Bank for Reconstruction and Development & The World Bank; 2010.
Submit your manuscript to a
journal and benefi t from:
7Convenient online submission 7Rigorous peer review
7Immediate publication on acceptance 7Open access: articles freely available online 7High visibility within the fi eld
7Retaining the copyright to your article