Review
Large portion sizes increase bite size and eating rate in
overweight women
Eva Almiron-Roig
a, Melina Tsiountsioura
a, Hannah B. Lewis
a, Jianhua Wu
a,
Ivonne Solis-Trapala
a, Susan A. Jebb
a,b,⁎
a
MRC Human Nutrition Research, Elsie Widdowson Laboratory, 120 Fulbourn Road, Cambridge CB1 9NL, UK bNuffield Department of Primary Care Health Sciences, University of Oxford, UK
H I G H L I G H T S
•Increasing the portion size of a meal is associated with marked changes in eating behavior.
•Average bite size increased by 0.22 g for every 100 g increase in portion size.
•Larger portions led to an increase in eating rate up to about 540 g.
•Meal duration increased by 22.5% for every 100 g increase in portion size.
•Reducing bite size and slowing eating rate may reduce the risk of overconsumption.
a b s t r a c t
a r t i c l e i n f o
Article history: Received 4 June 2014
Received in revised form 10 November 2014 Accepted 12 November 2014
Available online 18 November 2014
Keywords: Portion size Bite size Eating rate Meal microstructure
Objective:Larger food portions lead to increased intake but the mechanism behind this effect is unclear. We investigated the effect of portion size on bite size, eating rate, deceleration rate, and meal duration.
Design and methods:Thirty-seven overweight women attended 5 visits after a 3 h fast and consumed a 229, 303, 400, 529 or 700 g portion of a lunch meal in random order. Meal eating parameters were measured with the Sussex Ingestion Pattern Monitor. Data were analyzed with mixed effects models.
Results:Average bite size increased by 0.22 g for every 100 g increase in portion size (p = 0.001); portion size had a non-linear effect on eating rate, increasing with portion sizes up to about 540 g (p = 0.01). Deceleration rate (reduction in speed of eating) decreased by 20% (pb0.001) and meal duration increased by 22.5% for every 100 g increase in portion size (pb0.001), relative to the smallest portion.
Conclusions:Increasing portion size led to a larger bite size and faster eating rate, but a slower reduction in eating speed during the meal. These changes may underlie greater energy intakes with exposure to large portions. Interventions to reduce bite size and slow eating rate may provide individuals with strategies to reduce the risk of overconsumption.
© 2014 Elsevier Inc. This is an open access article under the CC BY license (http://creativecommons.org/licenses/by/3.0/).
Contents
1. Introduction . . . 298
2. Methods and procedures . . . 298
2.1. Participants and recruitment . . . 298
2.2. Measurement of eating behavior parameters . . . 298
2.3. Training session . . . 298
2.4. Experimental procedures . . . 298
2.5. Appetite ratings . . . 299
2.6. Test foods . . . 299
2.7. Statistical analyses . . . 299
3. Results . . . 299
3.1. Participants . . . 299
⁎ Corresponding author at: Nuffield Department of Primary Care Health Sciences, University of Oxford, UK. Tel.: +44 1865 617826. E-mail address:[email protected](S.A. Jebb).
http://dx.doi.org/10.1016/j.physbeh.2014.11.041
0031-9384/© 2014 Elsevier Inc. This is an open access article under the CC BY license (http://creativecommons.org/licenses/by/3.0/). Contents lists available atScienceDirect
Physiology & Behavior
3.2. Effect of portion size on eating behavior microstructure parameters . . . 299
3.3. Debriefing . . . 300
4. Discussion . . . 300
5. Conclusion . . . 301
Conflicts of interest . . . 301
Acknowledgments . . . 301
Appendix A. Supplementary data . . . 301
References . . . 301
1. Introduction
Exposure to larger portion sizes has been linked with increased intake both in children and adults, and across a variety of foods and settings[1,2]although, the mechanisms underpinning this effect are unclear. Secular increases in portion sizes of many foods mean that individuals may need to develop personal coping strategies to avoid overeating. Understanding the factors associated with overeating in the face of larger portions may help to develop weight management interventions.
The microstructure of meal eating (the behavioral components asso-ciated with eating, including bite size, eating rate, meal duration, and the reduction in eating rate, also known as deceleration rate) is of in-creasing interest in the attempt to identify targets for interventions to constrain energy intake. Previous work has suggested that larger por-tions lead to an increase in bite size[3–5], as people increase the amount on their utensil in response to larger amounts on the plate[5]. A recent systematic review of controlled laboratory studies has shown that a faster eating rate is associated with greater energy intake[6]. Some of these parameters are inherently linked, for example, eating rate is affected by bite size[7,8], which is associated with the amount of food eaten[3,9].
Current evidence on how portion size affects eating behavior micro-structure is limited to observing the number of bites in order to estimate bite size[5]but modern technology now allows the precise measure-ment of bite size and other related parameters[10]. The current study tested the hypothesis that increasing the portion size of a meal would lead to an increase in bite size. Secondary objectives were to explore changes in overall eating rate, deceleration rate and meal duration. We focused on overweight women only to make our sample more homogeneous especially as the portion size effect may differ across genders[11,12].
2. Methods and procedures
2.1. Participants and recruitment
Healthy women aged 18–60 years with a BMI between 25 and 35 kg/m2were recruited from Cambridge and surroundings. As eating
behavior microstructure parameters may differ between males and females[13]only women were recruited to reduce heterogeneity. It was estimated that 35 women were required to achieve 90% power (at a significance level of 0.05) to detect a 2.4 g difference in average bite size when portion size is doubled[5], assuming a standard devia-tion within-subjects (women) of 3 g/bite[13]. To account for possible drop outs, 40 women were recruited.
To avoid alterations in normal eating behavior due to knowledge of the true study aims, the study was advertised as“investigating the influence of the eating environment on meal satisfaction”. Exclusion criteria included: smoking; currently dieting; consuming breakfast less than 5 days per week; being pregnant, planning a pregnancy or breastfeeding; disliking or restricting of the test foods (e.g. vegetarian-ism, food allergies); presence of an eating disorder, defined as a score
≥11 on the Eating Attitudes Test (EAT-26)[14,15]; having a medical condition (e.g. gastro-intestinal disorders) or taking medication
(e.g. antidepressants) that can affect appetite; self-reported depres-sion, mental illness or psychiatric disorder; excessive alcohol intake (N14 units/week); and performing≥10 h/week intense physical activ-ity. Weight and height were recorded at a screening visit with a SECA scale and stadiometer to the nearest 0.1 kg and 0.1 cm respectively, from which BMI was calculated. Candidates completed the EAT-26 questionnaire. Those meeting eligibility criteria for BMI and EAT-26 scores were asked to attend a training session.
2.2. Measurement of eating behavior parameters
The Sussex Ingestion Pattern Monitor (SIPM) was used to measure bite size, eating rate, deceleration rate and meal duration[10]. The SIPM consists of a concealed scale (Sartorius Cubis model), connected with a serial line to a PC, and secured beneath a purpose-built table under a hole, on top of which a place mat was secured to allow position-ing of the plate. For this study, the software in the PC was programmed to record weight readings from the scale at 2 second intervals (precision 0.1 g), from which average bite size (the difference between each two consecutive weight records), eating rate (grams consumed per minute) and deceleration rate (grams consumed per squared minute) were cal-culated. The meal duration was divided into quartiles to explore chang-es in eating parameters over time[16]. Due to the high sensitivity of the SIPM equipment the data for bite size required cleaning. Records ofb1 g orN23.4 g were excluded on the basis that they represented scale back-ground noise or the result of the participant unknowingly applying weight or movement while sitting at the SIPM. These cut-off values were chosen after verifying the minimum and maximum weights of the test food that could realistically be loaded on the study fork.
2.3. Training session
The training session was designed to familiarize the participant with the individual eating booth and equipment where the SIPM was installed to minimize erroneous readings. Participants were asked to taste and rate the pleasantness of 4 foods, one of which was the test food (orange juice, tomato and cheese pasta bake, chili-con-carne, choc-olate mousse), using electronic, 100 mm visual analogue scales (VAS). Immediately after the taste test participants were served 125 g of a chocolate mousse and asked to consume it in full while following explic-it instructions to avoid leaning on the table while eating, posexplic-ition the spoon outside the bowl afterfinishing, and avoid tampering with the table and settings (i.e. placemat and screen). In line with the cover story, the volunteers were told that the eating and sitting requirements were necessary to standardize eating environment conditions across the participants. After the training session one participant disliking (i.e. a liking scoreb40 mm) the chili-con-carne meal was excluded and replaced.
2.4. Experimental procedures
meal presented in random order (see“Test foods”below). Each visit was scheduled between 2 and 20 days apart. The participants were asked to consume their usual breakfast at home at the same time on each study day, to avoid alcohol and to keep evening meals and activity levels similar the morning of and the day before each visit. On arrival to the volunteer suite, the participants were given 200 ml of water to con-sume in full to standardize thirst levels and completed pre-meal appe-tite ratings using electronic VAS questionnaires at the eating monitor station. The participants were then presented with one of the portions of the test meal and asked to consume it in full while following the same instructions specified at the training session. Time for eating the lunch was unrestricted. Immediately after eating, the participants com-pleted another set of electronic VAS appetite questionnaires. To avoid any confounding effects on meal parameters, drinks were not allowed during the meal but ad libitum water was offered at the end of the ses-sion. At the end of the last visit, the participants completed the Three Factor Eating Questionnaire[17]and were debriefed about the true pur-pose of the study. After the debriefing the investigator asked the partic-ipants if they were aware of the true purpose of the study and recorded any spontaneous comments (such as noticing changes in portion sizes across sessions and being aware of the covert equipment). Ethical ap-proval for the study was obtained from the University of Cambridge, Psychology Research Ethics Committee. The participants gave written informed consent and were compensated for participation.
2.5. Appetite ratings
Pre- and post-meal hunger and fullness levels were assessed using validated, electronic visual analogue scales (VAS) programmed as part of the SIPM[18]. The post-meal questionnaire included three distractor questions on liking, satisfaction and the extent to which eating environ-ment had affected meal satisfaction, which were not analyzed.
2.6. Test foods
The lunch meal consisted of chili-con-carne sauce with rice, provid-ed in portion sizes of 229 g, 303 g, 400 g, 529 g or 700 g (representing 1.3, 1.7, 2.2, 2.9 and 3.8 MJ/portion respectively). The proportion of sauce to rice used was 220 g of sauce for each 180 g of cooked rice
[19]. All food portions were weighed both prior and after meals using Salter™scales (precision 1 g). The energy density of thefinal meal was of 1.32 kcal/g (5.5 kJ/g). Thefive selected portion sizes represented 5 equally spaced portions in logarithmic units, based on human percep-tion laws[20]. The largest and smallest portions represented a 75% increase, and a 43% decrease, respectively from the average portion of a chili-con-carne main course (400 g)[19]. Pilot testing in a sample of 7 non-participating women showed that they were able to consume portions of the test meal in the range of 566–800 g. All meals were presented in exactly the same format, and accompanied by the same crockery and cutlery.
2.7. Statistical analyses
Outcome variables (bite size, eating rate, deceleration rate, and meal duration) were checked for normality using histograms and quantile– quantile plots. Deceleration rate and meal duration were not normally distributed so all analyses were performed on natural logarithm trans-formed data.
Linear mixed effect models werefitted to the four outcome variables separately. Wefitted each outcome variable with a linear mixed effect model including a linear term (or a categorical variable, see Supplemen-tary information) for portion size, participant characteristics (age, BMI, chili-con-carne liking score, TFEQ restraint, disinhibition and suscepti-bility to hunger scores), visit number, and pre-meal hunger and fullness as covariates. The effects of covariates in the models were considered to be statistically significant at the 5% level. All models included a random
intercept to account for the repeated observations for each individual. All models werefitted using maximum likelihood estimation and likeli-hood ratio tests were used for model selection. Plots of residuals were used to check the goodness offit of the selected models for each outcome.
Thefinal models for bite size and eating rate included portion size, visit number and pre-meal fullness as covariates, whereas those for meal duration and deceleration rate included portion size and pre-meal fullness.
Statistical analyses were performed using the R-language free soft-ware, version 3.0.2 (R Project for Statistical Computing,www.r-project. org).
3. Results
3.1. Participants
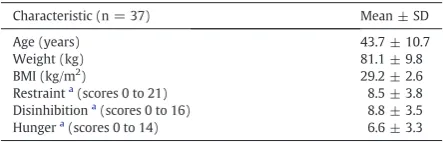
A total of 40 female participants were enrolled in the study. Three participants did not complete the study due to conflicting commitments and were excluded from the analysis. Three subjects left more than 100 g (~ 15%) of the meal in the largest portion condition, and a fourth subject left more than 30% (351 g). Based on the main out-come variables (bite size, eating rate, deceleration rate and meal dura-tion) none of these subjects were considered outliers therefore data for these participants were included in the analyses. Characteristics of the 37 participants included in the analysis are shown inTable 1.
3.2. Effect of portion size on eating behavior microstructure parameters
To provide a description of the dataTable 2shows the sample mean (±SD) for each outcome variable, lunch intake, and pre- and post-meal appetite ratings across portion size conditions. Due to equipment faults (i.e. scale not measuring food weight continuously), and/or participants unconsciously unsettling the equipment, 33% of the data for bite size, 7% for eating rate, deceleration rate and meal duration, and 1% for pre-meal hunger and post-meal hunger could not be recovered. Missing values were missing completely at random with respect to the portion size condition, thus only available data were used for further analysis.
The estimated regression coefficient of portion size on bite size was 0.0022 (95% CI: 0.00077, 0.0037; p = 0.001). This suggests that for every 100 g increase in portion size there is an estimated 0.22 g increase in bite size (Fig. 1a).
The regression coefficient of portion size on eating rate was 0.027 (95% CI: 0.013, 0.041; pb0.001). The regression coefficient of the qua-dratic term for portion size was −0.00012 (95% CI: −0.00022,
−0.00003; p = 0.01). The quadratic term suggests that eating rate in-creases in response to portion sizes up to 540 g, but reduces in response to portion sizes larger than this (Fig. 1b).
[image:3.595.325.547.656.727.2]The regression coefficient of portion size on meal duration was 0.0020 (95% CI: 0.0018, 0.0022; pb0.001). Therefore for every 100 g increase in portion size, the meal duration increases by an estimated 22.5% (Fig. 1c).
Table 1
Participant characteristics.
Characteristic (n = 37) Mean ± SD
Age (years) 43.7 ± 10.7
Weight (kg) 81.1 ± 9.8
BMI (kg/m2
) 29.2 ± 2.6
Restrainta
(scores 0 to 21) 8.5 ± 3.8
Disinhibitiona
(scores 0 to 16) 8.8 ± 3.5
Hungera
(scores 0 to 14) 6.6 ± 3.3
BMI: body mass index. a
The regression coefficient of portion size on deceleration rate was
−0.0018 (95% CI:−0.0022,−0.0014; pb0.001). Therefore for every 100 g increase in portion size, the deceleration rate reduces by an estimated 20% (Fig. 1d).
Visual inspection of the temporal curves for the main outcome vari-ables over the course of the meal revealed no differences in the temporal bite size and eating rate across conditions. However there appeared to be a greater reduction in deceleration rate over the course of the meal in the smaller portion sizes compared with the larger ones (data not shown).
Estimates comparing the mean outcome variable for each portion size condition with that of the smallest portion size can be found in the Supplementary information.
3.3. Debriefing
Thirty-two out of the 37 participants reported noticing a change in the portion size of the test meal over the course of the study. Only four partic-ipants reported being aware of or suspecting the existence of covert equipment as part of the eating station. Two reported that they thought the purpose of the study included measuring the speed of eating.
4. Discussion
[image:4.595.36.551.87.194.2]Large portions, in particular of high energy dense foods, challenge innate human appetite control systems and may lead to weight gain
Table 2
Mean ± SD bite size, eating rate, deceleration rate, meal duration, lunch intake, and pre- and post-meal appetite ratings (taken immediately before and after the meal) across portion size conditions.
Portion size
229 g 303 g 400 g 529 g 700 g
Average bite size (g) 8.1 ± 1.8 8.2 ± 2.2 8.9 ± 2.2 9.4 ± 2.2 9.1 ± 2.2
Average eating rate (g/min) 56 ± 17 63 ± 21 66 ± 23 67 ± 18 64 ± 22
Average deceleration rate (g/min2 )a
12.6 ± 2.0 11.9 ± 2.1 10.1 ± 1.9 7.9 ± 1.8 5.4 ± 2.1
Meal duration (min)a
4.1 ± 1.4 5.0 ± 1.4 6.3 ± 1.4 8.2 ± 1.3 11.1 ± 1.4
Lunch intake (g) 228.0 ± 1.4 298.5 ± 11.7 392.8 ± 27.7 521.5 ± 13.2 673.4 ± 67.5
Pre-meal hunger 79.0 ± 14.0 76.5 ± 18.5 75.0 ± 19.9 75.7 ± 18.1 79.7 ± 16.4
Pre-meal fullness 20.4 ± 20.4 22.7 ± 20.8 18.8 ± 18.0 21.2 ± 18.2 19.2 ± 17.9
Post-meal hunger 24.7 ± 21.3 19.8 ± 23.7 14.1 ± 21.1 4.6 ± 9.2 1.1 ± 2.2
Post-meal fullness 67.9 ± 18.9 79.7 ± 16.4 85.8 ± 12.6 90.4 ± 13.0 97.7 ± 4.6
a
This variable was logetransformed for analysis. Geometric mean and SD are presented.
[image:4.595.94.495.373.719.2][21,22]. This study showed that increasing the portion size of a main meal from around half of a standard portion to 75% larger led to marked changes in eating behavior which provide new insights into appetite control. As portion size increased, there was a linear increase in bite size. Average bite size increased by 0.22 g for every 100 g increase in portion size, this represents a 2–3% increase above the average bite size observed in our study (8–9 g); and a 3–4% increase of a typical bite size reported in the literature (5–8 g)[23]. This confirms and ex-tends previousfindings[5]by using a tightly controlled environment and highly sensitive modern equipment that allows the precise mea-surement of individual bites together with other components of eating behavior[10]. In ad libitum studies larger bite sizes have been shown to increase eating rate, likely mediated by a reduction in meal duration
[24]. However in the larger portion size conditions in our study, the meal duration and eating rate also increased, suggesting that the effects of these different parameters of eating behavior may be independent.
Overall, an increase in portion size was associated with an increase in eating rate. Previous research has shown that presenting overweight participants with a liked food, in large amounts, increases the desire to eat[25]which could translate into an urge to eat the food more quickly. This could represent a decrease in the oral processing time per gram, probably independent of chewing speed though, which is very constant in humans[23]. However unlike the linear increase in bite size and meal duration, we observed a threshold, at about 540 g, around 15% greater than a reference portion size, beyond which eating rate began to de-crease. Although the specific reason for this is unclear, portion sizes greater than 540 g are particularly large (35% larger than the national reference portion) and, unusually, the participants were required to consume the full portion. This may have encouraged the participants to artificially‘pace’their eating rate throughout the meal, relative to a more naturalistic context. This threshold may also be related to the asymmetry of appetite control whereby hunger cues are stronger than satiety signals[26]. Thus smaller portions may prompt differential effects on the microstructure of eating, relative to portion sizes above conventional norms.
Progressive reductions in the speed of eating (deceleration rate) occurred in each quarter of the meal in all portion conditions, however the speed of eating reduced more quickly in the smaller portion size conditions and over a shorter absolute time-period. In other words, the speed of eating was more consistent (i.e. did not decrease so quick-ly) with larger portions. A gradual attenuation in eating speed, starting very early in the meal, is a common trait of human eating behavior and is associated with parallel increases in satiation at 1–2 min after the start of the meal[16]. The reason for the slower deceleration in the larger portions is unclear, but may have been attributable to the requirement tofinish an unusually large portion. This on the other hand may have been perceived as a single unit, thus prompting plate-cleaning (unit bias effect)[27]. Further research is needed to determine if this also occurs in an ad libitum setting. If this is a reproduciblefinding, it is plausible that deceleration may be related to a priming effect of the food that is left on the plate, whereby the participants took longer to slow down their eating speed with larger portion sizes because they continued to be exposed to a large quantity of food for longer relative to the smaller portion size conditions[28]. Therefore they maintained their initial eating speed for longer in an attempt tofinish the meal more quickly to satisfy a pre-defined hunger goal[29].
This was a controlled experimental study in overweight women only to decrease variability, the results may not be generalizable to other groups and free-living conditions where the participants are eating ad libitum.
The inter-relationships between the various meal eating parame-ters is complex and affected by many factors, some of which were not measured in this study. This includes the number of bites, chewing speed[8,23], oral processing time[9,23], the food'sflavor and textural properties and its ability to elicit sensory-specific satiety[9,30–32]. Some of these factors may influence people's perceptions of how
much they are eating which may in turn affect their coping strategies when exposed to large portion sizes. We did not seek to study the im-pact of any post-prandial compensatory behavior or later changes in perceived appetite or satiety peptides[16,33]. Although we observed slightly higher hunger ratings immediately after consumption of the smaller portion sizes compared with the larger ones, the magnitude of these changes was small (20 mm in a scale of 100, similar results for fullness). These results are in agreement with some studies in the liter-ature suggesting that altering portion size is not necessarily linked with increases in perceived hunger[34,35]and, as manipulating eating rate does not appear to alter perceived appetite[6], strategies leading to por-tion control via reducpor-tions in eating rate may be sustainable.
5. Conclusion
This study shows that changing portion sizes alters the microstruc-ture of eating. Changes in eating rate and bite size with larger portions may underpin increased energy intakes, while reductions in these parameters with small portions may explain why smaller portions can help constrain intake[36]. While excessive portion sizes persist in the environment, interventions to reduce bite size and slow eating rate may provide individuals with coping strategies to reduce the risk of overconsumption.
Conflicts of interest
The authors report no conflicts of interest.
Acknowledgments
This study was funded by the U.K. Medical Research Council (Programme U105960389). The funding body had no direct involve-ment in the collection, analysis or interpretation of data.
EAR, HL and SAJ conceived the study; EAR and MT collected and prepared the data for analysis; JW and IST performed the statistical analyses. All authors were involved in writing the paper and hadfinal approval of the submitted and published versions.
The authors would like to thank Jennifer Gatzemeier, Trine Visby and Kirsty Davies for technical assistance; Dr Luigi Palla for initial statis-tical advice and sample size calculations; Sherley Beasley and Catherine Galloway for data checking and to all the volunteers for participating.
Appendix A. Supplementary data
Supplementary data to this article can be found online athttp://dx. doi.org/10.1016/j.physbeh.2014.11.041.
References
[1]Ello-Martin JA, Ledikwe JH, Rolls BJ. The influence of food portion size and energy density on energy intake: implications for weight management. Am J Clin Nutr 2005;82(Suppl. 1):236S–41S.
[2]Rolls BJ, Roe LS, Meengs JS. The effect of large portion sizes on energy intake is sustained for 11 days. Obesity (Silver Spring) 2007;15(6):1535–43.
[3]Orlet Fisher J, Rolls BJ, Birch LL. Children's bite size and intake of an entree are greater with large portions than with age-appropriate or self-selected portions. Am J Clin Nutr 2003;77(5):1164–70.
[4]Fisher JO. Effects of age on children's intake of large and self-selected food portions. Obesity (Silver Spring) 2007;15(2):403–12.
[5]Burger KS, Fisher JO, Johnson SL. Mechanisms behind the portion size effect: visibility and bite size. Obesity 2011;19:546–51.
[6]Robinson E, Almiron-Roig E, Rutters F, De Graaf C, Forde CG, Jebb SA. A systematic review and meta-analysis examining the effect of eating rate on energy intake and hunger. Am J Clin Nutr 2014;100(1):123–51.
[7]De Wijk RA, Zijlstra N, Mars M, de Graaf C, Prinz JF. The effects of food viscosity on bite size, bite effort and food intake. Physiol Behav 2008;95(3):527–32.
[8]Spiegel TA. Rate of intake, bites, and chews—the interpretation of lean–obese differ-ences. Neurosci Biobehav Rev 2000;24:229–37.
[10]Yeomans MR. Rating changes over the course of meals: what do they tell us about motivation to eat? Neurosci Biobehav Rev 2000;24:249–59.
[11]Brunstrom JM, Rogers PJ, Pothos EM, Calitri R, Tapper K. Estimating everyday portion size using a 'method of constant stimuli': in a student sample, portion size is predict-ed by gender, dietary behaviour, and hunger, but not BMI. Appetite 2008;51(2): 296–301.
[12]Rolls BJ, Roe LS, Meengs JS, Wall DE. Increasing the portion size of a sandwich in-creases energy intake. J Am Diet Assoc 2004;104(3):367–72.
[13]Laessle RG, Lehrke S, Duckers S. Laboratory eating behavior in obesity. Appetite 2007;49:399–404.
[14]Gardner DM, Olmsted MP, Bohr Y, Garfinkel PE. The eating attitudes test: psycho-metric features and clinical correlates. Psychol Medicine 1982;12(4):871–8. [15]Orbitello B, Ciano R, Corsaro M, Rocco PL, Taboga C, Tonutti L, et al. The EAT-26 as
screening instrument for clinical nutrition unit attenders. Int J Obes 2006;30(6): 977–81.
[16]Westerterp-Plantenga MS. Eating behavior in humans, characterized by cumulative food intake curves—a review. Neurosci Biobehav Rev 2000;24(2):239–48. [17]Stunkard AJ, Messick S. The Three-Factor Eating Questionnaire to measure dietary
restraint, disinhibition and hunger. J Psychosom Res 1985;29:71–83.
[18]Hill A, Blundell JE. Nutrients and behaviour: research strategies for the investigation of taste characteristics, food preferences, hunger sensations and eating patterns in man. J Psychiatr Res 1982;17(2):203–12.
[19]FSA, Food Standards Agency. Food portion sizes. In: Agency FS, editor. 3rd ed. London: The Stationary Office; 2002.
[20]Macmillan NA, Creelman DC. Detection theory: a user's guide. Cambridge: Cambridge University Press; 1991.
[21]Prentice AM, Jebb SA. Fast foods, energy density and obesity: a possible mechanistic link. Obes Rev 2003;4(4):187–94.
[22]Wansink B, van Ittersum K. Portion size me: downsizing our consumption norms. J Am Diet Assoc 2007;107(7):1103–6.
[23]Forde CG, van Kuijk N, Thaler T, de Graaf C, Martin N. Oral processing characteristics of solid savoury meal components, and relationship with food composition, sensory attributes and expected satiation. Appetite 2013;60(1):208–19.
[24]Spiegel TA, Kaplan JM, Tomassini A, Stellar E. Bite size, ingestion rate, and meal size in lean and obese women. Appetite 1993;21:131–45.
[25]Burger KS, Cornier MA, Ingebrigtsen J, Johnson SL. Assessing food appeal and desire to eat: the effects of portion size & energy density. Int J Behav Nutr Phys Act 2011;8: 101.
[26]Prentice A, Jebb S. Energy intake/physical activity interactions in the homeostasis of body weight regulation. Nutr Rev 2004;62(7 Pt 2):S98–S104.
[27]Geier AB, Rozin P. Univariate and default standard unit biases in estimation of body weight and caloric content. J Exp Psychol Appl 2009;15(2):153–62.
[28]Wansink B, Cheney MM. Super Bowls: serving bowl size and food consumption. JAMA 2005;293:1727–8.
[29]Mishra A, Mishra H, Masters TM. The influence of bite size on quantity of food consumed: afield study. J Consum Res 2011;38(February) [p. DOI: 10.1086]. [30]De Wijk RA, Polet IA, Bult OHF. Bitesize is affected by food aroma presented at
sub-or peri threshold concentrations. Chem Senses 2009;34(7) [p. 0379-864X]. [31]Forde CG, van Kuijk N, Thaler T, de Graaf C, Martin N. Texture and savoury taste
in-fluences on food intake in a realistic hot lunch time meal. Appetite 2013;60(1): 180–6.
[32]Zijlstra N, Mars M, de Wijk RA, Westerterp-Plantenga MS, de Graaf C. The effect of viscosity on ad libitum food intake. Int J Obes 2008;32(4):676–83.
[33]Kokkinos A, le Roux CW, Alexiadou K, Tentolouris N, Vincent RP, Kyriaki D, et al. Eat-ing slowly increases the postprandial response of the anorexigenic gut hormones, peptide YY and glucagon-like peptide-1. J Clin Endocrinol Metab 2010;95(1):333–7. [34]Rolls BJ, Morris EL, Roe LS. Portion size of food affects energy intake in
normal-weight and overnormal-weight men and women. Am J Clin Nutr 2002;76(6):1207–13. [35]Kral TV, Roe LS, Rolls BJ. Combined effects of energy density and portion size on
energy intake in women. Am J Clin Nutr 2004;79(6):962–8.