White Rose Research Online URL for this paper: http://eprints.whiterose.ac.uk/121996/
Version: Accepted Version
Article:
Guye, S. and von Bastian, C.C. (2017) Working memory training in older adults: Bayesian evidence supporting the absence of transfer. Psychology and Aging, 32 (8). pp. 732-746. ISSN 0882-7974
https://doi.org/10.1037/pag0000206
[email protected] https://eprints.whiterose.ac.uk/ Reuse
Unless indicated otherwise, fulltext items are protected by copyright with all rights reserved. The copyright exception in section 29 of the Copyright, Designs and Patents Act 1988 allows the making of a single copy solely for the purpose of non-commercial research or private study within the limits of fair dealing. The publisher or other rights-holder may allow further reproduction and re-use of this version - refer to the White Rose Research Online record for this item. Where records identify the publisher as the copyright holder, users can verify any specific terms of use on the publisher’s website.
Takedown
If you consider content in White Rose Research Online to be in breach of UK law, please notify us by
(c) 2017 APA http://dx.doi.org/10.1037/pag0000206
This manuscript is published in:
Guye, S., & von Bastian, C. C. (in press). Working Memory Training in Older Adults: Bayesian Evidence Supporting the Absence of Transfer. Psychology and Aging. doi: 10.1037/pag0000206
This article may not exactly replicate the authoritative document published in the APA journal. It is not the copy of record. The final publication is available on the APA website:
http://dx.doi.org/10.1037/pag0000206
Working Memory Training in Older Adults: Bayesian Evidence Supporting the Absence of
Transfer
Sabrina Guye
University of Zurich
Claudia C. von Bastian
Bournemouth University
Author Note
Sabrina Guye, University Research Priority Program (URPP) “Dynamics of Healthy
Aging”, University of Zurich, Switzerland; Claudia C. von Bastian, Department of
Psychology, Bournemouth University, United Kingdom.
Claudia C. von Bastian is now at the Department of Psychology, University of
This work was supported by grants awarded to the first author from the Suzanne and
Hans Biäsch Foundation for Applied Psychology (Ref. 2014/32), the Forschungskredit of the
University of Zurich (FK-16-062), and financial support of the URPP “Dynamics of Healthy
Aging” of the University of Zurich. This work was presented at the International Max Planck
Research School on the Life Course (LIFE) Academies in Ann Arbor (2015), Öhningen
(2015), and Charlottesville (2016); the Conference of the Schweizerische Gesellschaft für
Gerontologie (SGG SSG) in Freiburg, 2016; the Annual Meeting of the Gerontological
Society of America in New Orleans, 2016; the International Conference Aging and Cognition
in Zurich, 2017; the European Congress of Psychology in Amsterdam, 2017, and the
Conference of the European Society for Cognitive Psychology in Potsdam, 2017. The data
are available on the Open Science Framework (osf.io/zrj3q). Some of this data have been
used in a prior publication (Guye, De Simoni, & von Bastian, currently under review
elsewhere).
We thank Enrico Capelli, Aline Gaillard, Sabrina Müller, and Michel Wälti for their
assistance with collecting the data. We also thank Annia Rüesch Ranganadan for her help in
preparing the participant feedback.
During the work on her dissertation, Sabrina Guye was a pre-doctoral fellow of LIFE
(participating institutions: MPI for Human Development, Humboldt-Universität zu Berlin,
Freie Universität Berlin, University of Michigan, University of Virginia, University of
Zurich).
Correspondence concerning this article should be addressed to Sabrina Guye,
University of Zurich, University Research Priority Program “Dynamics of Healthy Aging”,
Abstract
The question of whether working memory training leads to generalized improvements in
untrained cognitive abilities is a longstanding and heatedly debated one. Previous research
provides mostly ambiguous evidence regarding the presence or absence of transfer effects in
older adults. Thus, to draw decisive conclusions regarding the effectiveness of working
memory training interventions, methodologically sound studies with larger sample sizes are
needed. In this study, we investigated whether or not a computer-based working memory
training intervention induced near and far transfer in a large sample of 142 healthy older
adults (65-80 years). Therefore, we randomly assigned participants to either the experimental
group, which completed 25 sessions of adaptive, process-based working memory training, or
to the active, adaptive visual search control group. Bayesian linear mixed-effects models
were used to estimate performance improvements on the level of abilities, using multiple
indicator tasks for near (working memory) and far transfer (fluid intelligence, shifting, and
inhibition). Our data provided consistent evidence supporting the absence of near transfer to
untrained working memory tasks and the absence of far transfer effects to all of the assessed
abilities. Our results suggest that working memory training is not an effective way to
improve general cognitive functioning in old age.
Working Memory Training in Older Adults: Bayesian Evidence for Supporting the Absence
of Transfer
On average, advancing age is accompanied by deterioration in multiple cognitive
domains, with fluid abilities, such as processing speed, reasoning, and memory declining
earlier than crystallized abilities (e.g., Horn & Cattell, 1967; Salthouse, 2004). In recent
years, this has led to the development of computer-based cognitive training interventions,
both in the “brain training” industry and in the cognitive training research community. The
main goal of these interventions is to maintain or improve cognitive functions such as
working memory (WM) that are relevant for daily life activities (e.g., Feldmann Barrett,
Tugade, & Engle, 2004). WM is a capacity-limited system coordinating representations
needed for ongoing cognitive processing. Individual differences in WM capacity (WMC)
have been shown to be strongly related to other higher-order cognitive abilities, including
fluid intelligence, attention, shifting, inhibition (Kyllonen & Christal, 1990; Miyake et al.,
2000; Miyake & Shah, 1999; Oberauer, Süß, Wilhelm, & Wittmann, 2008; Süß, Oberauer,
Wittmann, Wilhelm, & Schulze, 2002), and a wide variety of complex everyday tasks (see
Feldmann Barrett et al., 2004 for an overview). Based on the process overlap theory (Kovavs
& Conway, 2016), the theoretical rationale behind WM training is that extensive practice on
a set of WM tasks enhances not only WMC, but also transfers to non-trained but related
cognitive tasks or abilities that share cognitive processes with WM.
Inconclusive Evidence for the Effectiveness of Cognitive Training Interventions
“Brain training” interventions have proven popular especially among older adults as a
promising way to counteract age-related cognitive decline, although there is little scientific
support for the effectiveness of commercially available cognitive training interventions (see
training interventions, numerous WM training studies have generated consistent evidence for
large improvements in the trained tasks in younger and older adults alike (see Karbach &
Verhaeghen, 2014; Melby-Lervåg, Redick, & Hulme, 2016 for meta-analyses). Whether WM
training leads to transfer effects, is, however, less clear. After some promising early findings
reporting far transfer to, for instance, intelligence in younger adults (e.g., Jaeggi, Buschkuehl,
Jonides, & Perrig, 2008), there is accumulating evidence against a generalized effect of WM
training interventions in younger adults coming from methodologically sound studies (e.g.,
De Simoni & von Bastian, 2017; Redick et al., 2013; see also Melby-Lervåg & Hulme, 2013;
Melby-Lervåg et al., 2016 for meta-analyses). Far fewer WM training studies exist that
examined the effectiveness of WM training in older adults, the majority of which reported
transfer effects to not explicitly practiced WM tasks (i.e., near transfer; e.g., Borella et al.,
2014; Borella, Carretti, Riboldi, & De Beni, 2010; Brehmer, Westerberg, & Bäckman, 2012;
Buschkuehl et al., 2008; Richmond, Morrison, Chein, & Olson, 2011), to untrained other
cognitive abilities (i.e., far transfer; Borella et al., 2010, 2014; Brehmer et al., 2012), or to
lab-based everyday life performance measures (Cantarella, Borella, Carretti, Kliegel, & de
Beni, 2017). So far, there are only few studies that have reported the absence of generalized
effects transfer effects in older adults (e.g., von Bastian, Langer, Jäncke, & Oberauer, 2013).
Thus, a recent meta-analysis concluded that, compared to active controls, WM and executive
control training leads to substantial training and near transfer, and to smaller but significant
far transfer effects (Karbach & Verhaeghen, 2014, but see Melby-Lervåg et al., 2016).
The absence of studies reporting null findings may indicate that older adults are more
susceptible to WM training interventions than younger adults, as there might be more room
for improvement for individuals starting at lower levels of baseline performance and
subsequently benefitting more from training. However, it is also possible that methodological
nature of the control group) in the reported studies caused these effects. Most training studies
in older adults are severely underpowered due to small sample sizes (e.g., meta-analysis of
Lampit, Hallock, & Valenzuela, 2014; median group size of 22), which is associated with
two major statistical problems (cf. von Bastian, Guye, & De Simoni, 2017). On the one hand,
low power can drastically inflate effect sizes of individ ual studies (Halsey, Curran-Everett,
Vowler, & Drummond, 2015), leading to biased estimates in meta-analyses evaluating the
overall effect of cognitive training (Bogg & Lasecki, 2015). On the other hand, p-values can
vary greatly in the presence of small sample sizes (referred to as “the dance of the p-value”
by Cumming, 2011), with the low statistical power increasing the risk of not only
false-negative, but also false-positive findings (Button et al., 2013). A suitable alternative to the
traditional p-value is the Bayes Factor (BF), which is the ratio between the likelihood of the
data under one hypothesis (typically the alternative hypothesis, H1) relative to another
hypothesis (typically the null hypothesis, H0). Considering the controversy regarding the
(in-)effectiveness of cognitive training interventions, BFs offers an important advantage.
Whereas significant p-values indicate the presence of a hypothesized effect, non-significant
p-values only indicate the absence of evidence for a hypothesized effect. Hence,
non-significant p-values do not distinguish between evidence for the null hypothesis and the lack
of evidence for either of the two hypotheses. In contrast, BFs allow for drawing conclusions
about the evidence supporting the presence of an effect (i.e., whether the data are more likely
under the alternative hypothesis), the evidence supporting the absence of an effect (i.e.,
whether the data are more likely under the null hypothesis), or whether there is not enough
evidence to support either of the two hypotheses sufficiently, as indicated by ambiguous BFs
(for a more detailed discussion, see e.g., Dienes, 2014). Thus, BFs constitute an adequate
So far, only few studies have applied BFs to evaluate the effectiveness of cognitive
training (but see De Simoni & von Bastian, 2017; Guye, De Simoni, & von Bastian, 2017;
Sprenger et al., 2013; von Bastian & Oberauer, 2013). Based on the meta-analysis from
Au et al., (2015), Dougherty, Hamovitz, and Tidwell (2016) re-evaluated the effectiveness of
n-back training in terms of far transfer to intelligence in younger adults using BFs. They
demonstrated that studies with passive control groups strongly favored the alternative
hypothesis (i.e., the presence of the effect), but those with active controls moderately favored
the null hypothesis (i.e., the absence of the effect). In a similar vein, to investigate the
(in-)effectiveness of WM training interventions in older adults, we re-evaluated the
meta-analysis from Lampit et al. (2014) using Bayesian statistics. Our results show that overall,
most studies produced only ambiguous evidence regarding near and far transfer effects,
providing insufficient statistical support for either the alternative or the null hypothesis (von
Bastian et al., 2017). Thus, the debate of whether or not WM training is effective in older
adults cannot be settled based on the current body of literature.
In addition, poor design choices such as the nature of transfer assessment or the
control group can further limit the inferences permitted by individual studies (cf. Guye,
Röcke, Mérillat, von Bastian, & Martin, 2016; Noack, Lövdén, Schmiedek, & Lindenberger,
2009; Shipstead, Redick, & Engle, 2012). For example, many studies relied on only single
indicators when assessing transfer, thereby potentially mistaking task-specific effects with
generalized transfer effects (e.g., Borella et al., 2010, 2014; Brehmer et al., 2012). As each
task contains paradigm-specific variance, stimulus material-specific variance, and some
measurement error, using multiple indicators per cognitive ability and thus inferring from a
combined score, minimizes random sources of error (cf. Moreau, Kirk, & Waldie, 2016).
Another issue is the lack of adequate control groups. Although a passive control group
effects of any kind of cognitive stimulation), it cannot do so for unspecific intervention
effects (e.g., regularly spending time on a computer, social contacts during the assessments,
changes in training-related motivation or beliefs). Controlling for such effects requires an
active control group that engages in an alternative, plausible training intervention comparable
to the experimental training intervention that only differs in the ability that is being trained by
keeping all other intervention-specific and -unspecific factors constant (e.g., duration,
intensity, adaptive task difficulty, stimulus material).
In sum, although a number of training studies with older adults have been published
in recent years, the evidence regarding transfer effects is still relatively ambiguous in either
direction (i.e., presence or absence of transfer effects; cf. von Bastian et al., 2017). Thus,
before concluding about the general effectiveness of WM training in older adults,
methodologically sound studies (i.e., adequate control group and transfer assessment) with
large samples are needed to provide decisive evidence for or against transfer effects.
The Present Study
The main goal of this study was to investigate training and transfer effects after a
process-based WM training intervention in older adults using Bayesian statistics by
overcoming the methodological issues outlined above. We conducted a
randomized-controlled, double-blind study trial and assigned the participants to either the experimental
(WM) group or to an active control group practicing visual search (VS). As previous research
found that conjunction search efficiency is unrelated to WM capacity (e.g., Kane, Poole,
Tuholski, & Engle, 2006), VS training constitutes a plausible cognitive control condition (cf.
Harrison et al., 2013; Redick et al., 2013). The training interventions were comparable in
length and duration, as both groups received five weeks of intensive training intervention
consisting of 25 training sessions. WM training consisted of heterogeneous WM tasks,
task-specific processes (cf. Schmidt & Bjork, 1992). Based on the work by Wilhelm,
Hildebrandt, and Oberauer (2013), we selected three well-established WM tasks shown to be
reliable indicators of the WMC construct, namely an updating task, a binding task, and a
complex span task. For both training interventions, solely visuo-spatial stimulus material was
used to prevent the application of verbal strategies such as imagery or rehearsal (cf.
Zimmermann, von Bastian, Röcke, Martin, & Eschen, 2016). Based on the assumption that
plasticity is driven by a prolonged mismatch between task demands and cognitive capacity
(Lövdén, Bäckman, Lindenberger, Schaefer, & Schmiedek, 2010), we implemented an
adaptive training algorithm in both training groups that increased the level of difficulty
depending on participants’ performance.
The effectiveness of the WM training intervention in eliciting training, near and far
transfer effects was evaluated using BFs, as they allow for quantifying the strength of
evidence for the alternative hypothesis (i.e., presence of training/transfer effects) and the null
hypothesis (i.e., absence of training/transfer effects). Training effects were quantified by
administering test versions of the WM and VS training tasks in addition to measuring
performance improvements during training, as the latter is potentially confounded with initial
level of performance (cf. von Bastian & Oberauer, 2013). Transfer effects were assessed by
comparing pre- and post-training performance in multiple tasks per cognitive ability (cf.
Shipstead et al., 2012). Near transfer was measured using three structurally dissimilar
visuo-spatial WM tasks. Further, we assessed far transfer to multiple measures of fluid intelligence,
shifting, and inhibition. Fluid intelligence has been shown to be strongly correlated with WM
(Engle, Tuholski, Laughin, & Conway, 1999; Salthouse & Pink, 2008; Süß et al., 2002), and
both shifting, the ability encompassing control processes in situations where individuals
to suppress inappropriate behavioral responses, share common variance with WM updating
according to Miyake et al.’s three-factor model of executive functions (Miyake et al., 2000).
Method
Participants
Older adults (65 – 80 years, M = 70.35, SD = 3.66) were recruited through the
participant database of the University Research Priority Program (URPP) “Dynamics of
Healthy Aging” of the University of Zurich, lectures at the Senior Citizens’ University of
Zurich, flyers, online announcements, and word-of-mouth. Interested seniors were informed
that they would participate in a “brain jogging” study and that they had the right to withdraw
at any time. Written informed consent was obtained from all participants. The study was
approved by the ethics committee of the Department of Psychology of the University of
Zurich (in compliance with the Helsinki Declaration).
Participants were retired, German speaking seniors who had access to a computer
with Internet connection at home and basic experience in using the computer and Internet.
After study completion, they received CHF 150 (approx. USD 150). We refrained from using
estimates from previous training studies for power analyses, as they are likely severely
underpowered (Bogg & Lasecki, 2015), and therefore, probably yielded inflated effect size
estimates (Halsey et al., 2015). Instead, we aimed to recruit at least three times as many
participants than previous training studies with older adults (i.e., n = 66 per group; cf. Lampit
et al., 2014). A total of 194 seniors were individually screened for ongoing neurological and
psychiatric disorders, psychotropic drug use, and severe sensory impairments (motor,
hearing, or vision disabilities) potentially impacting cognitive performance. Further,
participants were screened for color blindness using the Ishihara Test (Ishihara, 1917), for
subclinical depression using the German version of the Geriatric Depression Scale (GDS;
German version of the Mini-Mental State Examination (MMSE; Folstein, Folstein, &
McHugh, 1975: cut-off criterion = 26). During the screening session participants additionally
completed three computer-based questionnaires, including a demographic questionnaire, a
health questionnaire, and a questionnaire assessing computer and Internet experience. In
addition, everyday problem solving abilities were assessed using an adapted version of the
multiple-choice Everyday Problems Test (EPT; Willis & Marsiske, 1993). The EPT is an
objective measure for the ability to solve everyday activities on printed material. Results on
the EPT are reported elsewhere (Guye et al., 2017).
Three participants were ineligible for the study due to self-reported psychotropic drug
use, self-reported psychiatric disease, and subclinical depression symptoms as assessed by the
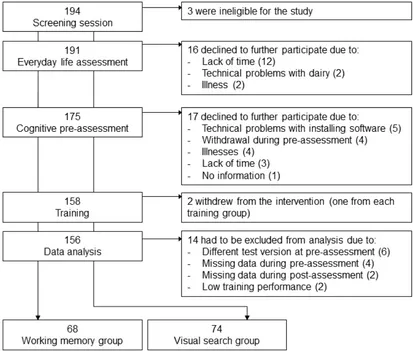
GDS, respectively. Of the remaining 191 participants, 16 participants withdrew their
participation during the everyday life assessment due to the reasons shown in Figure 1. The
remaining 175 participants entered the subsequent study phase (i.e., pre-assessment, training,
and post-assessment), 17 of which withdrew their participation before beginning with the
training intervention (attrition rate of 10%). During the training intervention, two additional
participants (one of each training group) withdrew their participation due to low training
motivation (approx. 1%). Further, we had to exclude 14 participants: the first six participants
of the study had to be excluded as they were administered a longer test battery during
pre-assessment including additional tasks, which we afterward decided to remove due to time
restrictions. Data from six participants were excluded as they did not complete one or more
tasks during cognitive pre- or post-assessment. Moreover, two individuals were excluded
because they performed below chance level in more than 25 % of the training sessions. Thus,
Figure 1. Flow chart of participant recruitment.
To assign participants to groups, they were given a random identification number. A
randomization list was created stratified by age (65–69; 70–74; 75–80) and gender. A random
sequence of experimental group and active control group assignments was generated within
each age and gender group and participants were assigned accordingly by the research
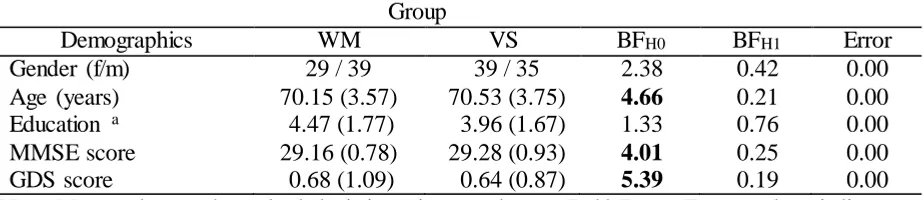
manager. As listed in Table 1 (see Table S1 for null hypothesis significance testing [NHST]
results), the two groups were comparable in age, education, cognitive functioning (MMSE),
and depressive symptoms (GDS), with ambiguous evidence regarding group differences in
education (with the experimental group, on average, having obtained a slightly higher
Table 1
Participant Demographics
Group
Demographics WM VS BFH0 BFH1 Error
Gender (f/m) 29 / 39 39 / 35 2.38 0.42 0.00
Age (years) 70.15 (3.57) 70.53 (3.75) 4.66 0.21 0.00 Education a 4.47 (1.77) 3.96 (1.67) 1.33 0.76 0.00
MMSE score 29.16 (0.78) 29.28 (0.93) 4.01 0.25 0.00
GDS score 0.68 (1.09) 0.64 (0.87) 5.39 0.19 0.00
Note. Mean values and standard deviations in parentheses. Bold Bayes Factor values indicate
substantial evidence for the respective hypothesis. Bayes Factors were determined by Bayesian
two-tailed independent t-tests (chi-square test in the case of gender). WM = working memory;
VS = visual search; BF = Bayes Factor; H0 = null hypothesis; H1 = alternative hypothesis;
MMSE = Mini-Mental State Examination; GDS = Geriatric Depression Scale.
aThe scale for education ranged from 0 (no formal education) to 7 (doctorate).
Design and Material
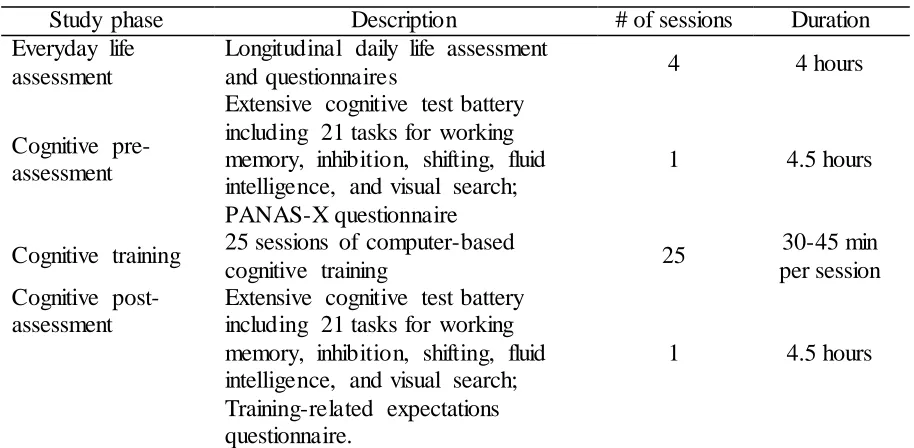
Table 2 lists the four phases of the study: (1) an everyday life assessment, (2) a
cognitive pre-assessment, (3) an intensive training regime, and (4) a cognitive
post-assessment. We used a randomized controlled double-blind pretest/posttest trial comparing
the WM group with the VS group. Neither the participants nor the research assistants
collecting the outcome measures had knowledge of the group to which they were assigned,
[image:14.595.73.535.129.229.2]Table 2
Overview of the Study Phases
Study phase Description # of sessions Duration
Everyday life assessment
Longitudinal daily life assessment
and questionnaires 4 4 hours
Cognitive pre- assessment
Extensive cognitive test battery including 21 tasks for working memory, inhibition, shifting, fluid intelligence, and visual search; PANAS-X questionnaire
1 4.5 hours
Cognitive training 25 sessions of computer-based
cognitive training 25
30-45 min per session Cognitive
post-assessment
Extensive cognitive test battery including 21 tasks for working memory, inhibition, shifting, fluid intelligence, and visual search; Training-related expectations questionnaire.
1 4.5 hours
Note. Everyday life assessment and cognitive training were self-administered and cognitive
pre- and post-assessments were conducted in-lab.
Everyday life assessment. Eligible participants took part in a longitudinal daily life
assessment and completed several questionnaires. During the one-week daily life assessment,
participants were asked to complete a modified and translated online version of the Day
Reconstruction Method (DRM; Kahneman, Krueger, Schkade, Schwarz, & Stone, 2004) at
three predefined days. To assess general activity involvement, participants were asked to
complete a modified version of the Adult Leisure Activity Questionnaire (Jopp & Hertzog,
2010). In addition, participants completed several questionnaires including the NEO
Five-Factor Inventory (Costa & McCrae, 1992), Grit scale (Duckworth, Peterson, Matthews, &
Kelly, 2007), Need for Cognition scale (Cacioppo & Petty, 1982), Theories of Intelligence
scale (Dweck, 2000), General Self-Efficacy scale (Schwarzer & Jerusalem, 1995), and the
Cognitive Failure Questionnaire (Broadbent, Cooper, FitzGerald, & Parkes, 1982), results of
[image:15.595.72.529.125.349.2]Cognitive training interventions. Training procedures were identical for both groups
if not mentioned otherwise. The interventions were self-administered at home using Tatool
(von Bastian, Locher, & Ruflin, 2013). After each session, data were automatically uploaded
to a webserver running Tatool Online, allowing for monitoring participants’ compliance
throughout the training phase.
Participants were instructed to complete 25 sessions of intensive cognitive training
(30-45 minutes per session) distributed equally across five weeks, with most participants
completing training sessions on 5 days a week. To enhance training commitment, participants
were individually reminded via e-mail if they fell behind their training schedule. Moreover, at
the beginning of every training week, participants received an e-mail with information on
their training status and a motivating slogan (e.g., “If you always do what you’ve always
done, you’ll always get what you’ve always got”). In case of technical problems, participants
could contact the study manager via phone or e-mail.
Participants practiced three cognitive tasks, each lasting approximately 10 min per
session. Task order was randomized to avoid sequence effects. Each task was automatically
terminated if task duration exceeded 15 min to prevent training sessions longer than 45 min.
Before each session, participants were asked to complete a shortened version of the
PANAS-X (Grühn, Kotter-Grühn, & Röcke, 2010) assessing their current affect. They had to indicate
their agreement or disagreement with the adjectives on an 8-point Likert scale. At the
beginning of and mid-way through training (sessions 2 and 14), we assessed participants’
training motivation using an adapted version the Intrinsic Motivation Inventory (Deci &
Ryan, 2016). Results of affective and motivational correlates during training will be the focus
of a different manuscript.
Working memory training. Training consisted of a complex span task, a binding task,
memoranda) and the response time limit varied depending on the level of task difficulty set
by the adaptive training algorithm (see below). In each session, participants completed up to
15 trials per task.
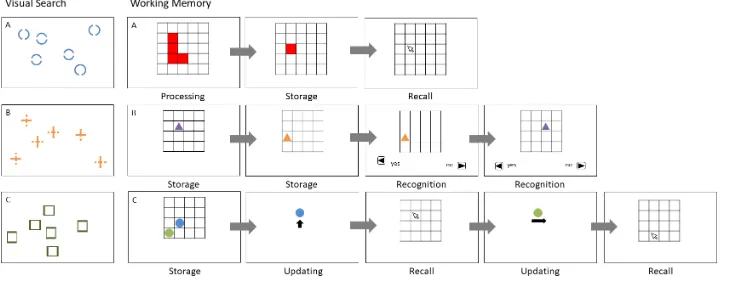
Complex span task. We used the figural-spatial complex span task from von Bastian
and Eschen (2016). In each trial, participants had to memorize a series of positions of red
squares in a 5 x 5 grid. Presentation of memoranda was interleaved by a distracting task, in
which participants had to determine as quickly and as accurately as possible whether a
L-shaped figure composed of red grid cells was oriented vertically or horizontally. At the end
of each trial, participants had unlimited time to recall the grid positions in correct serial order
by mouse-click. Memoranda were presented for 1000 ms each. Response time during the
distractor task was limited (see adaptive task difficulty).
Binding task. We used an adapted version of the local-recognition task (e.g.,
Oberauer, 2005), in which participants had to memorize a series of colored triangles and their
position in a 4 x 4 grid. Afterward, as many probes as memoranda were presented, for each of
which participants had to decide whether it matched the triangle that was previously
presented at that position. Across all 15 trials, 50 % of the probes were positive, 25 % were
distractors (i.e., triangles in colors not presented within this trial), and 25 % were intrusions
(i.e., triangles in colors that had been presented within this trial but at a different position).
Memoranda were displayed for 900 ms (with an additional 100 ms inter stimulus interval)
Figure 2. Schematic overview of the visual search training tasks: A) circles task, B) crosses task, C) rectangles task and the working memory
Memory updating task. We used an adapted version of the task used by De Simoni
and von Bastian (2017; cf. Schmiedek, Lövdén, & Lindenberger, 2014). First, participants
had to memorize the locations of colored circles presented simultaneously in a 4 x 4 grid.
Thereafter, one of the circles appeared on a white background alongside an arrow.
Participants had to update the circle’s position by mentally moving it to the adjacent cell in
the direction the arrow pointed toward (up, down, left, or right). Participants indicated the
new position of the circle by mouse click. Each trial consisted of nine updating steps of
which four to five were switch and repetition trials, respectively. During switch trials, the
to-be-updated circle changed compared with the preceding trials, whereas during repetition
trials the to-be-updated circle did not change. Memoranda were displayed for 500 ms and
time to respond was restricted (see adaptive task difficulty).
Visual search training. Based on Kane et al.'s (2006) experiments, we developed
three conjunction search tasks to improve visual search tasks using different stimulus
material such as circles, crosses, and rectangles (cf. De Simoni & von Bastian, 2017).
Participants had to identify a target stimulus as quickly and as accurately as possible among
distractors. All stimuli appeared in a warped 8 x 7 grid, resulting in an irregular distribution
of the stimuli on the screen. For each task and each session, half of the trials contained a
target.
In the circles task (cf. von Bastian, Langer, et al., 2013) the target stimulus was a
circle with a gap facing up, right, down, or left. Distractors were circles with two gaps either
facing left and right, or up and down. In the crosses task, the target stimulus was a cross with
a gap at the upper, right, lower, or left bar. Distractors were crosses with two gaps either at
the left and right bar, or at the upper and lower bar. Finally, in the rectangles task, the target
stimulus was a rectangle with a bold side facing up, right, down or left. Distractors were
indicate the presence of a target by pressing the corresponding arrow key or by pressing the
A key if there was no target present during the trial. Participants completed up to 70 trials per
task and time to respond was unrestricted.
Adaptive task difficulty. We used the default adaptive score and level handler included
in Tatool (von Bastian, Locher, et al., 2013). In the first training session, participants’
performance was assessed and task difficulty possibly increased after every 7 % of trials (1
trial in WM training and 5 trials in VS training), ensuring participants to quickly reach their
individual baseline cognitive capacity limit and so maximizing the time exposed to
challenging task demands. After the first session, performance was assessed and task
difficulty possibly after every 40 % of trials (6 trials in WM training and 28 trials in VS
training). In the WM tasks, difficulty was raised by either reducing the response time limit by
300 ms (four subsequent level-ups) or by increasing the set size by one additional
memorandum (fifth level-up, which also reset the response time limit) if accuracy was above
80 %. The first training session started with a set size of two and a response time limit of
5000 ms per response. The maximum set size was set to 8 for the three tasks. In the VS tasks,
level of difficulty was raised by increasing the number of distractors by two if participants’
accuracy was above 95 %. The start level of difficulty was six items, the maximum set size
was set to 54 for the three tasks.
Training feedback. Performance-based trial-by-trial feedback was presented as a
green check mark for a correct response, and a red cross for an incorrect response. Moreover,
at the beginning of each session, participants were presented with their performance across
all completed training sessions in the form of a graph plotting level against session for each
of the three training tasks.
Cognitive assessment. Before and after the training intervention, participants
correlations and reliabilities). Cognitive pre- and post-assessment were conducted at the
University of Zurich in the laboratories of the URPP “Dynamics of Healthy Aging” by
trained research assistants. Participants were tested in groups of up to four individuals. Both
pre- and post-assessments took 4.5 hours including a 10-min break and two 5-min breaks.
To measure training-related improvements independent of the training situation, we
used criterion tasks identical to those practiced during WM and VS training. Near transfer
was assessed with structurally dissimilar WM tasks and different visuo-spatial stimulus
material. Far transfer was measured to fluid intelligence, shifting, and inhibition. We used
identical versions of the test battery at both cognitive assessments to facilitate comparability
between the groups and test occasions.
At the beginning of the pre-training assessment, participants completed a shortened
version of the PANAS-X (Grühn et al., 2010) assessing their general affect. At the end of the
post-assessment, self-reported training-related expectations were assessed with three items
asking participants whether they believed that they improved in the trained tasks, in the
untrained cognitive tasks, and in everyday life tasks. Participants had to respond on an
8-point Likert scale ranging from “not at all” to “very much”.
Cognitive tasks and the affect questionnaire were programmed using (von Bastian,
Locher, et al., 2013), the expectation questionnaire was in paper-pencil format. Participants
completed the pre- and post-assessment within seven days before respectively after the
Table 3
Description of the Cognitive Test Battery Used During Training and Cognitive Assessments
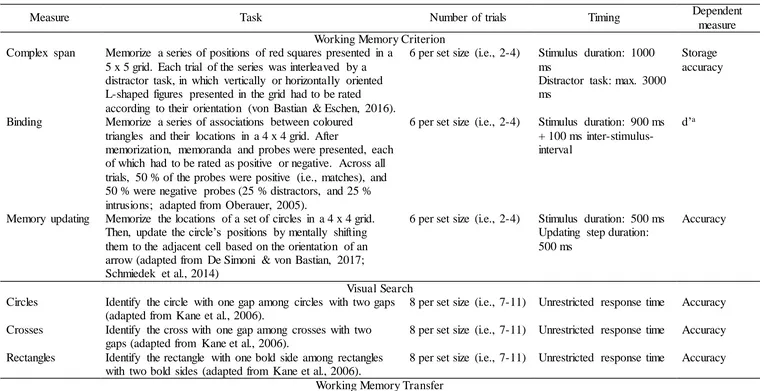
Measure Task Number of trials Timing Dependent
measure Working Memory Criterion
Complex span Memorize a series of positions of red squares presented in a 5 x 5 grid. Each trial of the series was interleaved by a distractor task, in which vertically or horizontally oriented L-shaped figures presented in the grid had to be rated
according to their orientation (von Bastian & Eschen, 2016).
6 per set size (i.e., 2-4) Stimulus duration: 1000 ms
Distractor task: max. 3000 ms
Storage accuracy
Binding Memorize a series of associations between coloured triangles and their locations in a 4 x 4 grid. After
memorization, memoranda and probes were presented, each of which had to be rated as positive or negative. Across all trials, 50 % of the probes were positive (i.e., matches), and 50 % were negative probes (25 % distractors, and 25 % intrusions; adapted from Oberauer, 2005).
6 per set size (i.e., 2-4) Stimulus duration: 900 ms + 100 ms inter-stimulus-interval
d’a
Memory updating Memorize the locations of a set of circles in a 4 x 4 grid. Then, update the circle’s positions by mentally shifting them to the adjacent cell based on the orientation of an arrow (adapted from De Simoni & von Bastian, 2017; Schmiedek et al., 2014)
6 per set size (i.e., 2-4) Stimulus duration: 500 ms Updating step duration: 500 ms
Accuracy
Visual Search Circles Identify the circle with one gap among circles with two gaps
(adapted from Kane et al., 2006).
8 per set size (i.e., 7-11) Unrestricted response time Accuracy
Crosses Identify the cross with one gap among crosses with two gaps (adapted from Kane et al., 2006).
8 per set size (i.e., 7-11) Unrestricted response time Accuracy
Rectangles Identify the rectangle with one bold side among rectangles with two bold sides (adapted from Kane et al., 2006).
8 per set size (i.e., 7-11) Unrestricted response time Accuracy
[image:22.842.71.843.124.515.2]Brown-Peterson Memorize a series of Gabor patches. Memorization phase was followed by a distractor task, in which the length of a horizontally oriented bar had to be compared to the a gap between two points (Brown, 1958; Peterson & Peterson, 1959).
4 per set size (i.e., 2-4) Stimulus duration: 1000 ms
Distractor task: max. 3000 ms
Storage accuracy
Binding Memorize a series of associations between coloured shapes and their locations in a 1 x 4 grid. After memorization, memoranda and probes were presented, each of which had to be rated as positive or negative. Across all trials, 50 % of the probes were positive (i.e., matches), and 50 % were negative probes (25 % distractors, and 25 % intrusions; adapted from Oberauer, 2005).
8 per set size (i.e., 2-4) Stimulus duration: 900 ms + 100 ms inter-stimulus-interval
d’a
Memory updating Memorize the orientation of arrows pointing in one of eight directions (i.e., cardinal directions). Then, update the arrow’s orientation by rotate them according to a presented arrow and indicate the new cardinal direction (adapted from De Simoni & von Bastian, 2017; Schmiedek et al., 2014)
8 per set size (i.e., 2-4) Stimulus duration: 500 ms Updating step duration: 500 ms
Accuracy
Fluid Intelligence RAPM Out of nine options, identify the missing element that
completes a 3 x 3 pattern matrix (Arthur & Day, 1994).
12 Task restricted to 12
minutes
Accuracy
Relationships Out of five options, select the correct Venn diagram that represents the relationship among a set of three objects (Ekstrom, French, Harman, & Derman, 1976).
2 x 15 Each block max. 4 min Accuracy
Locations Based on four dashed lines, identify the rule of the spatial distribution of x’s and place the x at the corresponding location on a fifth dashed line (Ekstrom et al., 1976).
2 x 14 Each block max. 6 min Accuracy
Shiftingb
Animacy-size (categorical)
Categorize drawings of animals and everyday objects according to two classification rules: animacy (living vs. non-living) and size (smaller vs. larger than a soccer ball) (von Bastian, Souza, & Gade, 2016).
Single blocks: 64 Mixed block: 128
Cue stimulus interval: 150 ms
Unrestricted response time
Proportional SCc and MCd
(figural) classification rules: color (green vs. blue) and shape (round vs. angular; von Bastian et al., 2016).
Mixed block: 128 ms
Unrestricted response
SCc and MCd
Parity-magnitude (numerical)
Categorize digits (1-9, excluding 5) according to two classification rules: parity (odd vs. even) and magnitude (smaller vs. greater than 5; von Bastian et al., 2016).
Single blocks: 64 Mixed block: 128
Cue stimulus interval: 150 ms
Unrestricted response time
Proportional SCc and MCd
Inhibition
Flanker
Indicate the orientation of a centrally presented target arrow, which is flanked by congruent (arrows facing toward the same direction), incongruent (arrows facing toward the opposite direction) or neutral stimuli (i.e., “XX”; (Eriksen & Eriksen, 1974).
96 per condition (i.e., neutral, congruent, incongruent)
Unrestricted response time Proportional interferencee
Stroop
Indicate the hue of a color word while inhibiting the prepotent response to read the word instead. In congruent trials, the hue matches the color word, in incongruent trials, the hue does not match the color word, and in neutral trials, a neutral stimulus (i.e., “xxxxx”) is presented (Stroop, 1935).
96 per condition (i.e., neutral, congruent, incongruent)
Unrestricted response time Proportional interferencee
Simon
Indicate the color of a green or red circle which is presented on the left, right, or in the center of the screen by pressing the corresponding arrow key (e.g., left for green circles, right for red circles). The circle can appear on the congruent (e.g., green circle on the left), incongruent (e.g., red circle on the left) or neutral position (i.e., centrally; Simon, 1969).
96 per condition (i.e., neutral, congruent, incongruent)
Unrestricted response time
Proportional interferencee
Note. RAPM = Raven Advanced Progressive Matrices; SC = switch costs; MC = mixing costs
ad’ = z(hit rate) – z(false alarms to intrusions).bShifting tasks consisted of five blocks presented in the following order: two single blocks, a
mixed block, and two single blocks in reversed order. A visual cue indicating the classification rule was presented before the stimulus. In single
switched unpredictably. Half of the trials were repetition trials (two successive trials in which the same rule had to be applied) and the other half
Results
Data are available on the Open Science Framework (OSF; osf.io/zrj3q). Data
preprocessing and data analysis were carried out with R (version 3.2.3; R Core Team, 2016).
BFs were computed using the R package “BayesFactor” (version: 0.9.12.2; Rouder & Morey,
2012) and the default prior settings (i.e., Cauchy distribution with a medium scaling factor, r =
0.707). To test the robustness of our results, we replicated the analyses across a range of priors
(i.e., r = 0.50, r = 2.00) and the conclusions remained the same. The interested reader is
referred to the analyses scripts publicly available on the OSF. BFs range from zero to infinity,
with higher values expressing stronger evidence for the respective hypothesis. An adapted
version of the verbal labels proposed by Wetzels and Wagenmakers (2012) was used to
facilitate interpretation (see Table 4). BFs favoring the null hypothesis (i.e., BFs < 1) are
expressed as 1/BF.
Table 4
Verbal Labels for Bayes Factors
BF Interpretation > 100 Decisive
30-100 Very strong 10-30 Strong 3-10 Substantial
1-3 Ambiguous
1 No evidence
Note. Adapted from Wetzels and Wagenmakers (2012). BF = Bayes Factor.
Preprocessing RT Data
Shifting scores (i.e., proportional switch costs [SC] and mixing costs [MC]) and
inhibition scores (i.e., proportional interference) were computed based on the reaction times
defined as data points that were more than three median absolute deviations away from the
overall median (Leys, Ley, Klein, Bernard, & Licata, 2013).
Training Compliance and Performance
Due to scheduling problems, seven participants completed less than 25 sessions. Three
participants from the WM group completed 21, 23, and 24 sessions and four participants from
the VS group completed 19, 20, and 24 (2 participants) sessions. As all of these participants
completed at least 75% of the training intervention, they were included in the data analysis to
enhance power.
There was substantial evidence that the WM (M = 24.97, SD = 0.71, range = 21 - 28)
and VS group (M = 24.88, SD = 0.95, range = 19 - 26) did not differ in the number of
completed training sessions as indicated by a Bayesian two-tailed independent t-test, BFH0 =
4.57 ± 0.00 %, (see Table S3 for NHST results). If participants completed more than 25
training sessions, these additional sessions were omitted from data analysis.
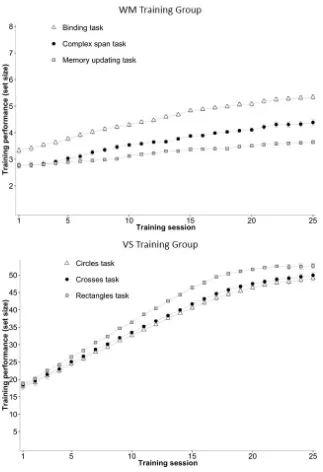
As illustrated in Figure 3, both groups showed substantial training effects for each
training task. To test if performance improved monotonically across sessions, we conducted
Bayesian linear mixed effects (LME) models with set size achieved by the end of each session
as the dependent variable and training session (coded as linear contrast) as fixed effect (see
Table S4 for NHST results). These analyses were run separately for each group and training
task, including a random effect for subject to account for variability between individuals. The
reported estimates represent the increase in set size from one session to the next around their
95% credible interval. There is decisive evidence that across the 25 training sessions,
participants in the WM group improved in the binding task (MDiff = 0.09 [0.08, 0.09]), BFH1 >
100 ± 0.98 %, the complex span task (MDiff = 0.07 [0.07, 0.07]), BFH1 > 100 ± 1.01 %, and the
memory updating task (MDiff = 0.04 [0.04, 0.04]), BFH1 > 100 ± 1.92 %. The VS group also
3.17 %, the rectangles tasks (MDiff = 1.52 [1.50, 1.55]), BFH1 > 100 ± 1.22 %, and the crosses
[image:28.595.87.410.150.622.2]task (MDiff = 1.39 [1.37, 1.42]), BFH1 > 100 ± 2.15 %.
Figure 3. Training performance during working memory and visual search training. Maximum
set size for the working memory training group was 8 items, and 54 items for the visual search
training group. Error bars represent 95% within-subjects confidence intervals calculated
according to Cousineau (2005) and Morey (2008). WM = working memory; VS = visual
Training Gains and Transfer Effects
To investigate training gains, we assessed performance improvements for both groups
on the respective test versions of the training tasks (i.e., WM and VS criterion tasks).
Moreover, we evaluated whether WM training led to near transfer to structurally dissimilar
WM tasks, and to far transfer to fluid intelligence, shifting, and inhibition.
Statistical modeling. To assess performance improvements from pre- to
post-assessment while taking potential baseline differences into account, we calculated
standardized gains scores for each cognitive task (i.e., post-assessment performance subtracted
by pre-assessment performance divided by the pre-assessment standard deviation), which were
used as dependent variables (cf. von Bastian & Eschen, 2016; von Bastian & Oberauer, 2013).
Bayesian LME models including crossed random effects were run to estimate performance
improvements on the level of cognitive abilities (as compared to individual cognitive tasks; cf.
Baayen, Davidson, & Bates, 2008; Judd, Westfall, & Kenny, 2012 for details). Training group
was included in the models as fixed effect predictor. Two random effects were included to
account for variability between the participants and to account for variability between the
tasks. The reported estimates represent the group differences in gain scores around their 95%
Table 5
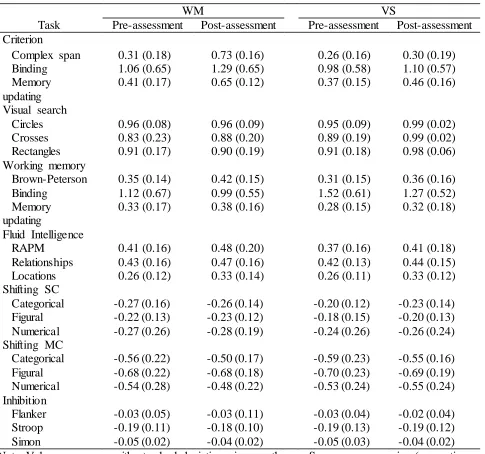
Descriptive Statistics of Cognitive Task Performance
WM VS
Task Pre-assessment Post-assessment Pre-assessment Post-assessment Criterion
Complex span 0.31 (0.18) 0.73 (0.16) 0.26 (0.16) 0.30 (0.19) Binding 1.06 (0.65) 1.29 (0.65) 0.98 (0.58) 1.10 (0.57) Memory
updating
0.41 (0.17) 0.65 (0.12) 0.37 (0.15) 0.46 (0.16)
Visual search
Circles 0.96 (0.08) 0.96 (0.09) 0.95 (0.09) 0.99 (0.02) Crosses 0.83 (0.23) 0.88 (0.20) 0.89 (0.19) 0.99 (0.02) Rectangles 0.91 (0.17) 0.90 (0.19) 0.91 (0.18) 0.98 (0.06) Working memory
Brown-Peterson 0.35 (0.14) 0.42 (0.15) 0.31 (0.15) 0.36 (0.16) Binding 1.12 (0.67) 0.99 (0.55) 1.52 (0.61) 1.27 (0.52) Memory
updating
0.33 (0.17) 0.38 (0.16) 0.28 (0.15) 0.32 (0.18)
Fluid Intelligence
RAPM 0.41 (0.16) 0.48 (0.20) 0.37 (0.16) 0.41 (0.18) Relationships 0.43 (0.16) 0.47 (0.16) 0.42 (0.13) 0.44 (0.15) Locations 0.26 (0.12) 0.33 (0.14) 0.26 (0.11) 0.33 (0.12) Shifting SC
Categorical -0.27 (0.16) -0.26 (0.14) -0.20 (0.12) -0.23 (0.14) Figural -0.22 (0.13) -0.23 (0.12) -0.18 (0.15) -0.20 (0.13) Numerical -0.27 (0.26) -0.28 (0.19) -0.24 (0.26) -0.26 (0.24) Shifting MC
Categorical -0.56 (0.22) -0.50 (0.17) -0.59 (0.23) -0.55 (0.16) Figural -0.68 (0.22) -0.68 (0.18) -0.70 (0.23) -0.69 (0.19) Numerical -0.54 (0.28) -0.48 (0.22) -0.53 (0.24) -0.55 (0.24) Inhibition
Flanker -0.03 (0.05) -0.03 (0.11) -0.03 (0.04) -0.02 (0.04) Stroop -0.19 (0.11) -0.18 (0.10) -0.19 (0.13) -0.19 (0.12) Simon -0.05 (0.02) -0.04 (0.02) -0.05 (0.03) -0.04 (0.02) Note. Values are means with standard deviations in parentheses. Scores are accuracies (proportion
correct), except for shifting (proportional switch costs and mixing costs), binding (d’), and
inhibition (proportional interference). RAPM = Raven Advanced Progressive Matrices; SC = switch
[image:30.595.73.558.118.572.2]Comparability at baseline. To ensure that the training gains and transfer effects can be
attributed to the training intervention and do not reflect baseline group differences, we compared
the groups at pre-assessment running Bayesian LME models with crossed random effects for each
ability using the pre-assessment scores as dependent variables (see Table 6, for NHST results, see
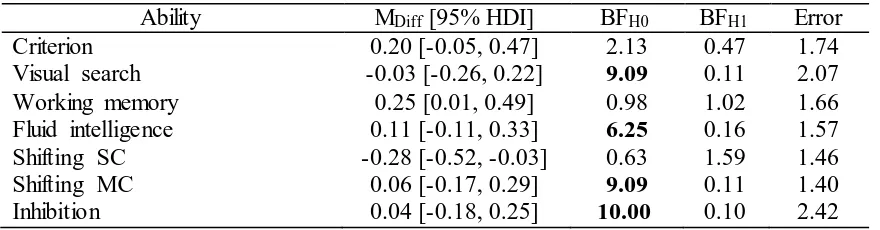
Table S5). There was no evidence for baseline differences for most abilities, although evidence
was ambiguous for the WM criterion (BFH0 = 2.13 ± 1.74 %), WM transfer (BFH1 = 1.02 ± 1.66
%), and shifting SC tasks (BFH1 = 1.59 ± 1.46 %). Further inspection of the individual tasks
revealed that there was strong evidence for a baseline difference for the shifting SC categorical
task only (BFH1 = 9.90 ± 0.00 %), with the VS group outperforming the WM group (see Table S6
for BFs and NHST). As group differences in training gains and transfer effects were assessed
using standardized gain scores, any effects observed were beyond these baseline differences.
However, results should still be interpreted cautiously as we cannot exclude regression to the mean
for these outcomes.
Training gains. Results for the Bayesian LME models are presented in Table 7 (for NHST
results, see Table S7). We found decisive evidence for an effect of group for the WM criterion
tasks, indicating that the WM group improved more from pre- to post- assessment compared to the
VS group (MDiff = 1.14 [0.93, 1.35], BFH1 > 100 ± 1.63 %). Similarly, we found strong evidence
for an effect of group for the VS criterion tasks, indicating that the VS group improved
significantly more from pre- to post-assessment on the trained VS tasks compared to the WM
Table 6
Baseline Differences in Cognitive Abilities
Ability MDiff [95% HDI] BFH0 BFH1 Error
Criterion 0.20 [-0.05, 0.47] 2.13 0.47 1.74
Visual search -0.03 [-0.26, 0.22] 9.09 0.11 2.07
Working memory 0.25 [0.01, 0.49] 0.98 1.02 1.66
Fluid intelligence 0.11 [-0.11, 0.33] 6.25 0.16 1.57
Shifting SC -0.28 [-0.52, -0.03] 0.63 1.59 1.46
Shifting MC 0.06 [-0.17, 0.29] 9.09 0.11 1.40
Inhibition 0.04 [-0.18, 0.25] 10.00 0.10 2.42
Note. Estimates are means of the sampling from the posterior distribution with 10000 iterations
based on standardized data assessed by Bayesian linear mixed-effects models. As standardized
values were used the grand mean for all abilities is zero. Bold Bayes Factors values indicate
substantial evidence for the presence or absence of baseline group differences. HDI = highest
density interval of the posterior distribution; BF = Bayes Factor; H0 = null hypothesis; H1 =
alternative hypothesis; SC = switch costs; MC = mixing costs.
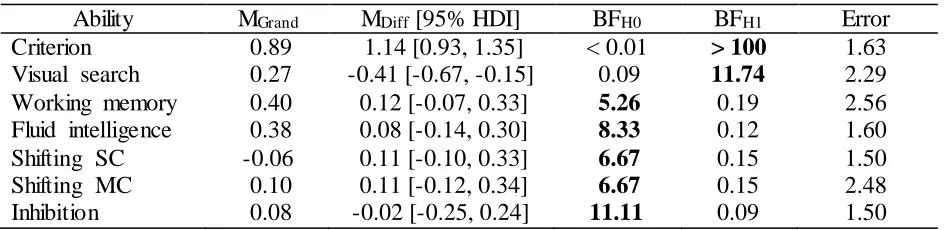
Transfer effects. Results for Bayesian LME models are presented in Table 7 (for NHST
results, see Table S7). We found substantial evidence for the absence of an effect of group for near
transfer to structurally dissimilar WM tasks (MDiff = 0.12 [-0.07, 0.33], BFH0 = 5.26 ± 2.56 %).
Moreover, there was substantial to strong evidence for the absence of an effect of group on
measures of far transfer, including fluid intelligence (MDiff = 0.08 [-0.14, 0.30], BFH0 = 8.33 ± 1.60
%), shifting SC (MDiff = 0.11 [-0.10, 0.33], BFH0 = 6.67 ± 1.50 %), shifting MC (MDiff = 0.11
[-0.12, 0.34], BFH0 = 6.67 ± 2.48 %), and inhibition (MDiff = -0.02 [-0.25, 0.24], BFH0 = 11.11 ± 1.50
[image:32.596.69.509.124.239.2]Table 7
Group Differences in Gain Scores
Ability MGrand MDiff [95% HDI] BFH0 BFH1 Error
Criterion 0.89 1.14 [0.93, 1.35] < 0.01 > 100 1.63 Visual search 0.27 -0.41 [-0.67, -0.15] 0.09 11.74 2.29 Working memory 0.40 0.12 [-0.07, 0.33] 5.26 0.19 2.56 Fluid intelligence 0.38 0.08 [-0.14, 0.30] 8.33 0.12 1.60 Shifting SC -0.06 0.11 [-0.10, 0.33] 6.67 0.15 1.50
Shifting MC 0.10 0.11 [-0.12, 0.34] 6.67 0.15 2.48
Inhibition 0.08 -0.02 [-0.25, 0.24] 11.11 0.09 1.50
Note. Estimates are means of the sampling from the posterior distribution with 10000 iterations based
on standardized data assessed by Bayesian linear mixed-effects models. Bold Bayes Factor values
indicate at least substantial evidence for the presence or absence of group differences. HDI = highest
density interval of the posterior distribution; BF = Bayes Factor; H0 = null hypothesis; H1 = alternative
hypothesis; SC = switch costs; MC = mixing costs.
Training-related expectations. Bayesian two-tailed independent t-tests were used to test
whether the groups differed in their training-related expectations. Data from four participants were
missing for expected cognitive transfer and data from three participants were missing for expected
transfer to everyday life. These individuals were excluded from the respective data analysis. We
found substantial evidence for the absence of a group differences regarding the expected training
gains between the WM group (M = 5.44, SD = 1.30) and the VS group (M = 5.47, SD 1.87), BFH0
= 5.51 ± 0.00 %. Regarding expected transfer to untrained tasks, we found decisive evidence for
participants in the WM group (M = 4.20, SD = 1.66) reporting higher levels in expected cognitive
transfer than the VS group (M = 3.15, SD 1.51), BFH1 > 100 ± 0.00 %. Finally, we found
ambiguous evidence for the absence of a difference in expected transfer to everyday life between
the WM group (M = 4.59, SD = 1.76) and the VS group (M = 4.25, SD 1.73), BFH0 = 2.97 ± 0.00
[image:33.596.70.542.124.239.2]Discussion
The goal of the study was to investigate the evidence for and against the effectiveness of
WM training in eliciting generalized performance improvements in older adults using Bayesian
statistics. To this aim, we investigated the training, near, and far transfer effects after a WM
training intervention in a fairly large sample of 142 healthy older adults. To overcome frequent
methodological issues in the cognitive training field, we conducted a randomized-controlled,
double-blind trial using an active, adaptive VS control condition. Further, training and transfer
effects to WM, fluid intelligence, shifting, and inhibition were assessed on the level of abilities,
that is, using multiple cognitive tasks as indicators for the construct of interest.
Consistent with previous literature (Karbach & Verhaeghen, 2014; Melby-Lervåg et al.,
2016), we found that WM training yielded substantial practice effects across the 25 sessions of
training in the respective WM tasks. Moreover, the WM training group also showed large
improvements from pre- to post-assessment in the criterion tasks when compared to the VS control
group. Although participants substantially improved in the trained tasks, we found substantial
evidence against near transfer effects to structurally dissimilar WM tasks, and substantial to strong
evidence against far transfer effects to fluid intelligence, shifting, and inhibition on the ability
level. Thus, our results do not support the notion of generalized enhancements in cognitive
functioning after intensive, computer-based WM training in older adults.
Absence of Transfer
At first, the absence of transfer in our study may seem contradictory to past research, as
many studies reported at least near transfer in older adults (see Karbach & Verhaeghen, 2014 for a
meta-analysis). However, our data consistently supported the absence of near transfer to
structurally different WM tasks and far transfer effects to fluid intelligence, shifting, and inhibition
(BFs from 5.26 to 11.11) which is in line with recent WM training studies with larger samples of
younger adults (De Simoni & von Bastian, 2017; Sprenger et al., 2013). This finding is especially
regarding their improvements on the cognitive transfer tasks. There are multiple possible
explanations for the absence of transfer effects found in this study.
First, the absence of near transfer to structurally dissimilar WM tasks indicates that the
training intervention did not change WMC. One possible reason is that the training intervention
was not intensive enough to change WMC and subsequently produce substantial transfer effects
(e.g., see Schmiedek, Lövdén, & Lindenberger, 2010, for a high- intensity training intervention
successfully producing positive transfer even in old age). Another possible reason is though that
the training intervention facilitated the acquisition of task-specific processes that are relevant to
perform the tasks efficiently and thus improve performance. Although we included three relatively
distinct WM training tasks to enhance variability in learning, a factor that had been suggested to
enhance generalizability of practice (Schmidt & Bjork, 1992), practicing the same set of tasks with
the same set of stimuli for 25 sessions may have still encouraged the acquisition of strategies tied
to the stimuli sets or the structure of the tasks, thus hindering the generalization of improvements
to tasks with different stimuli and surface structure (cf. Lustig, Shah, Seidler, & Reuter-Lorenz,
2009). This is in line with some recent meta-analyses suggesting that training interventions with
lower intensity (i.e., fewer or less frequent sessions) are more likely to produce transfer effects
(Lampit et al., 2014; but see Melby-Lervåg et al., 2016). In addition to task-specific processes, the
improvements observed during training and in the criterion tasks may also reflect individuals’
capacity to adapt to the training setting and the increase in confidence when performing the
computer-based cognitive tasks. Although all of our older participants were experienced in using a
computer, they were probably not familiar with practicing such relatively complex WM tasks.
Thus, it is possible that the performance increases in the trained tasks primarily reflect improved
task literacy.
Second, it is possible that WM training is effective only under certain circumstances and
for some individuals. For example, some meta-analyses suggest home-based individual training
et al., 2014), as the latter included face-to-face supervision by a trainer to guarantee compliance
and prevent cheating, provision of motivational and IT support, and nonspecific effects of social
interaction. Although we cannot completely exclude that these training-related aspects may have
limited the effectiveness of our training intervention, we minimized these issues by maximizing
personal contact throughout the study (e.g., IT support, weekly motivational quotes, and daily and
weekly feedback on training progress). Further, we ensured compliance using Tatool Online and
contacted participants if they fell behind their schedule, possibly contributing to the fact that only
two participants dropped out during the training intervention.
Further, individual differences factors such as personality, training-related beliefs, and
motivation can influence training gains and transfer effects (see Katz, Jones, Shah, Buschkuehl, &
Jaeggi, 2016 for an overview, but see Guye et al., 2017). As the heterogeneity between older
individuals might be relatively large, this may potentially masks transfer effects on the group level,
if they are assumed to be relatively small (cf. Bürki, Ludwig, Chicherio, & de Ribaupierre, 2014).
To gain insight into whether subgroups of individuals benefited more from the intervention than
others, we analyzed the training data of this study and investigated whether 29 individual
differences variables reported frequently in the literature (including demographic variables,
real-world education, motivation, training-related beliefs or personality traits) predicted change in
training performance (Guye et al., 2017). However, out of all of these investigated variables, only
one predicted change in training performance in the older adults (i.e., belief in the malleability of
intelligence; Dweck, 2000), and it did so opposite to common expectations (i.e., participants
believing more strongly in the intelligence being fixed showed larger training gains). These results
suggest that the role of individual differences in explaining variance in training gains is negligible
only. Assuming that transfer gains are a consequence of training gains, our findings thus render it
unlikely that individual differences in these commonly proposed traits can explain the
Third, it is possible that WM training effects did not generalize simply because repetitive
cognitive task practice is not effective in eliciting changes in WM capacity in general. Hence, the
near and far transfer effects reported in recent meta-analyses (e.g., Karbach & Verhaeghen, 2014)
might have been substantially overestimated due to methodological limitations of the (included)
studies (i.e., small sample sizes, passive control groups, transfer assessment on the level of
individual tasks). And, these effects may have been aggravated by more general problems in
psychology such as publication bias. For example, notoriously small sample sizes, in particular in
studies with older adults, yielding low statistical power seriously threats statistical inferences by
increasing the probability of inflated effect sizes (cf. Bogg & Lasecki, 2015; Halsey et al., 2015).
Hence, meta-analyses based on these inflated effect sizes potentially overestimate the effect of
training interventions.
Limitations and Future Research
One limitation of our study is that computer-based cognitive training interventions
generally attract highly educated and computer-versed older adults who have an inherent interest
in their cognition and in ways to improve their cognitive functioning. This self-selection bias
towards a highly functioning sample can cause a threat to the generalizability of our results to the
general population of older adults. Participants in our sample were considerably more educated
than the general population in Switzerland. In our sample, 53 % of the 65-74 years old and 48 % of
the 75-80 years old graduated from an institution for higher education (i.e., tertiary institution),
whereas only about 14 % of the 65-74 years old and 10 % of the 75-80 years old hold such a
qualification in the general population (Bundesamt für Statistik, 2016). Such high levels of
cognitive functioning in older participants may leave less room for improvements in cognitive
tasks and so could have limited the likelihood to observe transfer effects. Similarly, all participants
in our sample had to have access to a computer including Internet connection at home to be able to
receive the training intervention. This is, however, not the standard situation in the general