V. Khachatryan et al.* (CMS Collaboration)
(Received 13 October 2016; published 13 March 2017)
Differential cross sections for aWboson produced in association with jets are measured in a data sample of proton-proton collisions at a center-of-mass energy of 8 TeV recorded with the CMS detector and corresponding to an integrated luminosity of19.6fb−1. TheWbosons are identified through their decay modeW→μν. The cross sections are reported as functions of jet multiplicity, transverse momenta, and the scalar sum of jet transverse momenta (HT) for different jet multiplicities. Distributions of the angular
correlations between the jets and the muon are examined, as well as the average number of jets as a function of HT and as a function of angular variables. The measured differential cross sections are compared
with tree-level and higher-order recent event generators, as well as next-to-leading-order and next-to-next-to-leading-order theoretical predictions. The agreement of the generators with the measurements builds confidence in their use for the simulation ofWþjets background processes in searches for new physics at the LHC.
DOI:10.1103/PhysRevD.95.052002
I. INTRODUCTION
This paper presents measurements of differential cross
sections for associated production of aWboson and jets in
proton-proton collisions at a center-of-mass energy of 8 TeV at the CERN LHC. Measurements of the production of vector bosons in association with jets provide stringent tests of perturbative quantum chromodynamics (QCD). In
addition, the production of aW boson in association with
jets (Wþjets) is the main background source for rarer
standard model (SM) processes, such as top quark pro-duction and Higgs boson propro-duction in association with a
W boson, and it is also a prominent background to several
searches for physics beyond the SM.
The studies described here focus on the production of
Wþjets with the subsequent decay of the W boson
into a muon and a neutrino. The final-state topology is characterized by one isolated muon with high transverse
momentum pT, significant missing transverse energy
Emiss
T , and up to seven jets. Because of higher trigger
thresholds and additional systematic uncertainties, the
decay channel of the W boson into an electron and a
neutrino is not considered. Differential cross sections are extracted as functions of jet multiplicity, thepTof the jets,
the scalar sum of the jet transverse momenta,HT, and the
pseudorapidityηof the jets. Measurements of differential
cross sections as functions of angular correlation variables
are also performed. The average number of jets per event,
hNjetsi, is further studied as a function ofHTand angular variables.
These measurements are based on a sample of
proton-proton collisions atpffiffiffis¼8TeV recorded with the CMS
detector, corresponding to an integrated luminosity of
19.6fb−1. In order to perform differential measurements
of the Wþjets cross section, a high-purity sample of
muonicW boson decays is selected and the distributions
are corrected back to the stable-particle level by means of a regularized unfolding procedure. The measured fiducial differential cross sections are compared to the predictions
of Monte Carlo (MC) event generators for theWþnjets
hard-scattering process, with final states of different parton multiplicities matched to parton showers. The generators used are MADGRAPH5[1]interfaced withPYTHIA[2], which uses a leading-order (LO) matrix element calculation, and MADGRAPH5_aMC@NLO [3] and SHERPA 2 [4], which use next-to-leading-order (NLO) matrix element calculations. The differential cross sections are also compared with the
NLO parton-level predictions of BLACKHATþSHERPA [5]
and with a next-to-next-to-leading-order calculation (Njetti
NNLO) for the production ofWþ1jet[6,7].
Previous measurements of Wþjets production were
performed by the CDF[8]and D0[9,10]Collaborations in
proton-antiproton collisions at pffiffiffis¼1.96TeV at the
Fermilab Tevatron. The ATLAS [11] and CMS [12]
Collaborations have measured Wþjets production cross
sections in proton-proton collisions atpffiffiffis¼7TeV at the LHC, corresponding to integrated luminosities of 4.6 and
5.0fb−1, respectively.
The differential Wþjets cross sections at 8 TeV
pre-sented in this paper extend the kinematic reach of the 7 TeV
*Full author list given at the end of the article.
center-of-mass energy widens the observed ranges of kinematic quantities, such as thepTof the jets in the event
and HT for higher jet multiplicities, that are sensitive to
higher-order processes. The larger data sample motivates the increase in number and complexity of the angular correlation variables examined to more accurately under-stand how particle emissions are modeled by the MC generators used in the analysis of the LHC data and by the
most current NLO calculations. The quantity hNjetsi is
studied as a function of HT and angular correlation
variables to further explore the modeling of higher-order processes and correlations among emitted particles. In addition, the measurements are expanded to include the cross section dependence on variables, such as the dijet invariant mass in different multiplicity ranges, that are sensitive to the presence of physics beyond the SM.
This paper is organized in the following manner: SectionIIdescribes the CMS detector. SectionIIIdescribes the MC simulated samples and the data sample used for the analysis. The identification criteria for the final-state objects and the selection criteria used to selectWð→μνÞ þ
jets events are listed in Sec. IV. Section V describes
the modeling of the backgrounds. The variables used for the differential cross section measurements are detailed
in Sec. VI. The procedure used for unfolding is detailed
in Sec. VII, and Sec. VIII describes the systematic
uncertainties. Finally, Sec.IXgives the results and Sec.X
summarizes them.
II. THE CMS DETECTOR
The CMS detector consists of an inner tracking system and electromagnetic (ECAL) and hadron (HCAL) calo-rimeters surrounded by a 3.8 T superconducting solenoid. The inner tracking system consists of a silicon pixel and strip tracker, providing the required granularity and pre-cision for the reconstruction of vertices of charged particles in the range 0<ϕ<2π in azimuth and jηj<2.5 in pseudorapidity. The crystal ECAL and the brass and scintillator HCAL are used to measure with high resolution the energies of photons, electrons, and hadrons for
jηj<3.0. The three muon systems surrounding the
solenoid cover the region jηj<2.4 and are composed of drift tubes in the barrel region (jηj<1.2), cathode strip chambers in the endcaps (0.9<jηj<2.4), and resistive plate chambers in both the barrel region and the endcaps (jηj<1.6). Events are recorded based on a trigger decision using information from the CMS detector subsystems. The first level of the trigger system, composed of custom hardware processors, uses information from the calorim-eters and muon detectors to select events in a fixed time interval of less than4μs. The final trigger decision is based on the information from all subsystems, processed by the high-level trigger (HLT), which consists of a farm of
decreases the event rate from 100 kHz to less than 1 kHz, before data storage. A more detailed description of the CMS detector, together with a definition of the coordinate system used and the relevant kinematic variables, can be found in Ref.[13].
III. DATA AND SIMULATED SAMPLES
Events are retained if they pass a trigger selection
requiring one isolated muon with pT>24GeV and
jηj<2.1.
Signal and background processes are generated with various state-of-the-art generators and passed through
detector simulation based on GEANT4 [14] description of
CMS. Each simulated sample is normalized to the inte-grated luminosity of the data sample. The simulated events are required to pass an emulation of the trigger requirements applied to the data. Trigger efficiencies in the simulation are corrected for differences with respect to the data. Simulations also include additional collisions in the same or adjacent bunch crossings (pileup, PU). To model PU, minimum-bias events generated with
PYTHIA6 using the Z2* tune [15] are superimposed on the simulated events, matching the multiplicity of PU collisions observed in data, which has an average value of approximately 21.
TheWþjets signal process is simulated with the matrix
element (ME) generator MADGRAPH 5.1.1 [1] interfaced
withPYTHIA6.426 sing the Z2* tune for parton showering
and hadronization. This sample of events, denoted MADGRAPH5þPYTHIA6 (denoted as MG5þPY6 in the
figure legends), is produced with the CTEQ6L1 parton
distribution function (PDF) set [16]and is normalized to
the inclusive NNLO cross section calculated withFEWZ3.1
[17]. The MADGRAPH5þPYTHIA6 calculation includes the
production of up to four partons at LO. The jets from matrix elements are matched to parton showers following the
kT-jet MLM prescription[18], where partons are clustered
using the kT algorithm [19] with a distance parameter
of 1. The merging of parton showers and matrix elements with the MLM scheme uses a matching scale of 20 GeV.
The factorization and renormalization scales for the2→2
hard process in the event are chosen to be the transverse
mass of theWboson produced in the central process. The
kT computed for each QCD emission vertex is used as
renormalization scale for the calculation of the strong coupling constantαS of that vertex.
Background processes include t¯t, single top quark,
Z=γþjets, diboson ðZZ=WZ=WWÞ þjets, and QCD
multijet production. Their contributions, with the exception of QCD multijet production, are estimated from simulation.
The simulated samples of t¯t and Z=γþjets events are
generated with MADGRAPH version 5.1.1; the single top
using the Z2* tune. The simulations with MADGRAPHand PYTHIAuse the CTEQ6L1 PDFs, and the simulations with POWHEGuse the CTEQ6M PDFs. TheZ=γþjets sample
is normalized to the NNLO inclusive cross section
calcu-lated with FEWZ 3.1 [17]. Single top quark and diboson
samples are normalized to NLO inclusive cross sections
calculated with MCFM [24–27]. The t¯t contribution is
normalized to the predicted cross section at NNLO with next-to-next-to-leading-logarithm accuracy[28].
When comparing the measurements with the theoretical prediction, other event generators are used for theWþjets process. Those generators, which are not used for the
measurement itself, are described in Sec. IX.
IV. OBJECT IDENTIFICATION AND EVENT SELECTION
The final-state particles inWþjets events are identified and reconstructed with the particle-flow (PF) algorithm
[29,30], which optimally combines the information from
the various elements of the CMS detector.
Muon PF candidates are reconstructed as tracks in the muon system that are matched to tracks reconstructed in the
inner tracking system [31]. Muons are required to have
pT>25GeV and to be reconstructed in the HLT fiducial
volume jηj<2.1. The track associated with a muon
candidate is required to have hits in at least six strip tracker layers, at least one pixel hit, segments from at least two muon stations, and a good quality global fit withχ2per
degree of freedom <10. In order to reduce the
contami-nation due to muons that do not originate from the decay of
aW boson, an isolation requirement is imposed:
Iiso¼p1μ
T
Xcharged
pTþmax
0;X neutral
pTþX
γ
pT−0.5X
PU pT
≤0.12; ð1Þ
where the sums run over charged hadrons originating from the primary vertex of the event, neutral hadrons, photons
(γ), and charged hadrons not originating from the primary
vertex but from PU; only PF candidates with direction within a cone defined by ΔR¼pffiffiffiffiffiffiffiffiffiffiffiffiffiffiffiffiffiffiffiffiffiffiffiffiffiffiffiffiffiffiðΔϕÞ2þ ðΔηÞ2<0.4 around the direction of the muon candidate track are considered. The transverse momentum of the muon
can-didate is denoted by pμT. Because neutral PU particles
deposit on average half as much energy as charged PU particles, the contamination in the isolation cone from neutral particles coming from PU interactions is estimated as0.5PPUpT and it is subtracted in the definition ofIiso.
To reject muons from cosmic rays, the transverse impact parameter of the muon candidate with respect to the primary vertex is required to be less than 2 mm, and the longitudinal distance of the tracker track from the primary
efficiency corrections, are applied to the simulation as a
function ofpT andη on an event-by-event basis and are
generally less than 4% and 2.5%, respectively. Jets and transverse missing energyEmiss
T are also
recon-structed using the PF algorithm. The missing momentum vector ~pmiss
T of an event is defined as the negative of the
vectorialpTsum of the particles reconstructed with the PF
algorithm;EmissT is defined as the magnitude of the ~pmissT vector[32]. Jets are reconstructed using the anti-kT[19,33]
algorithm with a distance parameter of 0.5. Reconstructed
jet energies are corrected with pT- and η-dependent
correction factors to account for the following effects: nonuniformity and nonlinearity of the ECAL and HCAL energy response to neutral hadrons, the presence of extra particles from PU interactions, the thresholds used in jet constituent selection, reconstruction inefficiencies, and possible biases introduced by the clustering algorithm. Jet energy corrections are derived from simulation and
adjusted using measurements of thepTbalance in dijet and
γþjet events [34]. The jet energy resolution is
approx-imately 15% at 10 GeV, 8% at 100 GeV, and 4% at 1 TeV
[34]. Jets are required to havepT>30GeV,jηj<2.4, and a spatial separation from muon candidates of ΔR >0.5. In order to reduce the contamination from PU, jets are required to be matched to the same primary vertex as the muon candidate.
The primary background process for the measurement
of Wþjets at high jet multiplicities (4 or more) is t¯t
production. To reduce the t¯t contamination, a veto is
applied that removes events containing one or more
b-tagged jets. The tagging criteria used for this veto are
based on the combined secondary vertex algorithm (CSV)
[35], which exploits the long lifetime of b hadrons by
combining information about impact parameter signifi-cance, secondary vertices, and jet kinematic properties.
Differences in thebtagging efficiency in data and
simu-lation, as well as differences in mistagging rates, are
corrected using scale factors[35]determined as a function
of pT in multijet and t¯t events. Specifically, the tagging efficiency in simulation is decreased by randomly
untag-ging b-tagged jets such that the data and simulated
efficiencies are matched. Additionally, a small adjustment to the mistagging rates is performed by randomly tagging untagged jets in simulated events such that the data and simulated mistagging rates agree within uncertainties.
In order to select a Wð→μνÞ þjets sample, events are required to contain exactly one muon satisfying the muon selection criteria described above and one or more jets
with pT>30GeV. Events containing additional muons
with pT>15GeV are vetoed. Events are required to
have MT>50GeV, where MT, the transverse mass of
the muon and missing transverse energy, is defined as
MT¼ ffiffiffiffiffiffiffiffiffiffiffiffiffiffiffiffiffiffiffiffiffiffiffiffiffiffiffiffiffiffiffiffiffiffiffiffiffiffiffiffiffiffiffi2pμTEmissT ð1−cosΔϕÞ
p
~pT
V. ESTIMATION OF THE BACKGROUNDS
LeptonicWboson decays are characterized by a prompt,
energetic, isolated lepton and a neutrino giving rise to significant Emiss
T . Background processes with final-state
signatures similar to that of Wþjets are t¯t, single top
quark,Zþjets, dibosonðZZ=WZ=WWÞ þjets, and QCD
multijet production. All background processes except for QCD multijet production are simulated by MC event
generators and are normalized as described in Sec.III.
The multijet background is estimated using a control data sample with an inverted muon isolation requirement. In the control data sample, the muon misidentification rate is estimated in a multijet-enriched sideband region with
MT<50GeV, and the shape of the multijet distribution is
determined in the region withMT>50GeV. The template
for the multijet shape is rescaled according to the muon misidentification rate. This method of estimation was used
in the measurement of theWþjets fiducial cross sections
at 7 TeV and is described in detail in Ref. [12].
The dominant source of background comes from thet¯t
process, which is reduced by the application of the bjet
veto described in Sec.IV. For jet multiplicities of 1 to 7, the
bjet veto rejects 62%–88% of the predictedt¯tbackground,
while eliminating 4%–22% of the predicted Wþjets
signal.
VI. MEASURED OBSERVABLES
Fiducial cross sections are measured as a function of jet multiplicity, inclusively and exclusively, as a function of jet
pT and jηj, and as a function of HT. In terms of angular correlations between jets, cross sections are measured as a function of the difference in rapidity Δyðji; jkÞ, and of the difference in azimuthal angle Δϕðji; jkÞ, between theith and kth jets from thepT-ordered list of jets in the event. Cross sections are also measured as a function of the differences in rapidity and in azimuthal angle between rapidity-ordered jets, most notably ΔyðjF; jBÞ
and ΔϕðjF; jBÞ, the differences between the most
forward and the most backward jet in the event. Cross sections are measured as a function offfiffiffiffiffiffiffiffiffiffiffiffiffiffiffiffiffiffiffiffiffiffiffiffiffiffiffiffiffiffiffiffiffiffiffiffiffiffiffiffiffiffiffiffiffiffiffiffiffiffi ΔRðj1; j2Þ ¼
Δϕðj1; j2Þ2þΔyðj1; j2Þ2
p
between pT-ordered jets.
The dependence of the cross section on the invariant mass of the two leading jets for different jet multiplicities is also examined. The difference in azimuthal angle between the muon and the leading jet is measured for different jet
multiplicities. The dependence of hNjetsi on HT and on
bothΔyðj1; j2Þ andΔyðjF; jBÞ is studied for different jet multiplicities.
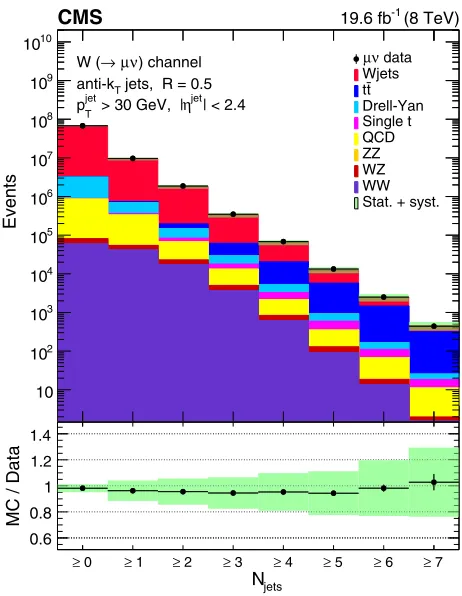
Before correcting for detector effects and determining the cross section values, we compare the kinematic
ground processes. The comparison of reconstructed data and simulated signal and background processes is shown in
Fig. 1 for the inclusive jet multiplicity. The uncertainty
band represents the total statistical and systematic uncer-tainty including uncertainties in the jet energy scale and resolution, the muon momentum scale and resolution, the integrated luminosity, the pileup modeling, the
normaliza-tions of the background processes, the modeling of theWb
contribution in the signal simulation, and the reconstruction, identification, and trigger efficiencies.
The number of events in each bin of exclusive recon-structed jet multiplicity for both data and simulated signal
and backgrounds is listed in Table I. The predicted total
yields agree well with the data yields for all the values of jet multiplicity.
VII. UNFOLDING PROCEDURE
The fiducial cross sections are obtained by subtracting the simulated backgrounds and the estimated multijet
0
≥ ≥ 1 ≥ 2 ≥ 3 ≥ 4 ≥ 5 ≥ 6 ≥ 7
Events
10
2
10
3
10
4
10
5
10
6
10
7
10
8
10
9
10
10
10
data ν μ Wjets
t t Drell-Yan Single t QCD ZZ WZ WW Stat. + syst.
[image:4.612.322.553.344.642.2]CMS 19.6 fb-1 (8 TeV)
| < 2.4 jet η > 30 GeV, | jet
T p
jets, R = 0.5 T
anti-k
) channel ν μ → W (
jets N
0
≥ ≥ 1 ≥ 2 ≥ 3 ≥ 4 ≥ 5 ≥ 6 ≥ 7
MC / Data
0.6 0.8 1 1.2 1.4
background from the data distributions and correcting the background-subtracted data distributions back to the par-ticle level using an unfolding procedure. This procedure takes detector effects such as detection efficiency and resolution into account. The unfolding procedure is
per-formed using the iterative d’Agostini method [36]
imple-mented in the RooUnfold toolkit [37]. Regularization is
achieved by choosing the optimal value of number of
iterations, based on a χ2 comparison of the unfolded
distributions, corrected with the response matrix defined below, with the reconstructed background-subtracted data distributions. To assess the dependence of the results on the unfolding method, we also used the singular-value
decom-position method [38]. The results from the two methods
agree within the uncertainties.
A response matrix, which defines the probability of event migration between the particle-level and reconstructed phase space as well as the overall reconstruction efficiency,
is constructed using a Wþjets sample simulated
with MADGRAPH5 þPYTHIA6. The particle-level selection
defines the fiducial phase space of the measurements and is identical to the selection applied to the reconstructed objects, including the requirement of exactly one muon with pT>25GeV and jηj<2.1, jet pT>30GeV and
jηj<2.4, and MT>50GeV. The particle-level EmissT is
determined using the neutrino from the decay of the W
boson. The momenta of all photons in a cone ofΔR <0.1 around the muon are added to that of the muon in order to take into account final-state radiation. The particle-level
jets are clustered using the anti-kT [33] algorithm with a
distance parameter of 0.5. The jet clustering algorithm uses all particles after decay and fragmentation, excluding
neutrinos. The b jet veto explained in Sec. IV is treated
as an overall event selection requirement, and the cross section is corrected by the unfolding procedure to
corre-spond toWboson production in association with jets of any
flavor. The contribution fromW →τνdecays resulting in a
muon in the final state is estimated to be small (∼1% of
selected signal sample), and it is therefore not considered as part of the signal definition at the particle level.
VIII. SYSTEMATIC UNCERTAINTIES
The systematic uncertainties are evaluated by repeating all of the analysis steps (including the subtraction of backgrounds and unfolding) with systematic variations corresponding to the different sources of uncertainty. The difference in each bin between the results obtained with and without the variation is taken as the systematic uncertainty.
The dominant systematic uncertainties are those asso-ciated with the jet energy scale (JES) and jet energy resolution (JER). The JES uncertainty is propagated to
the cross section measurements by varying the jetpTscale
in data by the magnitude of the uncertainty, which is
parametrized as a function ofpT andη [34]. Shifting the
value ofpT for each individual jet affectsEmiss
T , therefore
Emiss
T is recalculated. This variation also affects the value of MT, which is used in the event selection. The uncertainties related to JER are assessed by varying within their uncertainties the calibration factors applied to the simu-lation to reproduce the resolution observed in data[34]. As
in the case of JES, the changes in jetpT due to JER are
propagated to the calculation of Emiss
T andMT.
An uncertainty of 0.2% in the muon momentum scale and an uncertainty of 0.6% in muon momentum resolution are assigned[31]. The effects of these uncertainties on the measured cross sections are evaluated by varying the momentum scale and by fluctuating the muon momentum in the simulation.
The systematic uncertainty associated with the generator used to build the unfolding response matrix is assessed by weighting the simulation to agree with the data in each distribution and constructing an alternative response matrix
number of simulated signal and background events divided by the number of data events.
Njets 0 1 2 3 4 5 6 ≥7
WWþjets 18 093 24 420 13 472 3057 515 77 12 1
WZþjets 8125 6799 4153 1042 183 30 4 0
ZZþjets 932 669 384 96 18 3 0 0
QCD multijet 570 722 228 188 37 154 6734 1076 171 40 9
Single top quark 6438 14 386 9838 3444 877 196 34 7
Z=γþjets 1 935 191 265 387 51 613 9570 1697 281 48 6
t¯t 1504 7576 16 052 17 377 10 090 3487 1000 288
Wþjets 54 617 816 6 999 393 1 320 381 222 457 37 822 5857 860 139
Total 57 158 821 7 546 818 1 453 047 263 777 52 278 10 102 1998 450
Purity 0.96 0.93 0.91 0.84 0.72 0.58 0.43 0.31
Data 57 946 098 7 828 967 1 517 517 279 678 54 735 10 810 2058 441
[image:5.612.53.563.87.244.2]nominal results is taken as the systematic uncertainty associated with the unfolding response matrix. For the leading jetpTcross section, the resulting uncertainty is in the range 0.02%–10.8%. The higher values in this range, as well as in other uncertainty ranges, are caused by statistical fluctuations in the data and simulation samples in certain kinematic regions.
Other sources of systematic uncertainty include the
normalization of the background processes; b tagging
efficiency; modeling of theWb contribution in the signal
simulation; integrated luminosity; PU modeling; muon trigger, isolation, and identification criteria; and the finite number of simulated events used to build the response matrix.
Background normalization uncertainties are determined by varying the cross sections of the backgrounds within their theoretical uncertainties [24–27,39]. The theoretical
cross section uncertainties are 6% forZZandWZ, 8% for
WW, and 4% forZþjets for the regionMμμ >50GeV.
For single top quark production, the uncertainties are 6%
for the sandt channels and 9% for thetW channel. The
uncertainty in the t¯t modeling is assessed by comparing
data and simulation in a data control region with two or
moreb-tagged jets. Simulated events are rescaled to match
data in the control region, and the difference in the unfolded results with or without rescaling applied is taken as the
systematic uncertainty related to t¯t modeling. The scale
factors are about 1.26 for jet multiplicity of 2, and between 1.0 and 1.1 for jet multiplicities larger than 2, leading to uncertainties in the measured cross sections that range from 0.4% to 27% for jet multiplicities of 2 to 7. The estimate of the multijet background has an uncertainty based on the number of events in the inverted isolation sample and in the control regions where the normalization of the multijet background is calculated. In addition, the systematic variations applied to the backgrounds in the multijet control regions introduce variations in the multijet normalization and shape.
Uncertainties in the ratio of thebtagging efficiencies in
data and simulation are estimated [40], leading to
uncer-tainties in the measured cross sections in the range 0.4% to 25% for jet multiplicities of 1 to 7.
The uncertainty related to the normalization of theWb
content in the signal is estimated by examining the agree-ment between data and simulation as a function of jet multiplicity in a control region defined by requiring exactly
oneb-tagged jet. The normalization ofWb production is
found to be underestimated in the simulation by a factor of
1.3. Enhancing theWbprocess in simulation by this factor
leads to an estimated uncertainty in the measurement of up to 0.8% for a jet multiplicity of 7.
The uncertainty in the integrated luminosity is 2.6%[41]. The uncertainty in the modeling of PU in simulation is
jets N
= 0 = 1 = 2 = 3 = 4 = 5 = 6 ≥ 7
Relative Uncertainty (%)
2 − 10
1 − 10
1 10 2 10
[image:6.612.321.553.43.272.2]Total JES b tagging Background MC stat Other Statistical
FIG. 2. Systematic uncertainties in the measured cross section as a function of jet multiplicity, including uncertainties due to jet energy scale (JES), background normalization, b tagging effi-ciency, finite number of simulated events used to construct the response matrix (MC stat), and other systematic uncertainties mentioned in Sec. VIII. The largest contribution to the other uncertainties is the uncertainty on the integrated luminosity, which is 2.6%. Statistical uncertainty of the unfolded data and total uncertainty in the measured cross section are also shown.
TABLE II. Uncertainties in the measured cross section as a function of jet multiplicity, including uncertainties due to the statistical uncertainty of unfolded data (Stat), the jet energy scale (JES), pileup modeling (PU), background normalization (BG), the jet energy resolution (JER), trigger efficiency and muon identification (LepSF), b tagging efficiency, muon momentum scale (MES) and resolution (MER), the normalization of theWb content in the signal simulation (Wb), thet¯tmodeling, a finite number of simulated events used to construct the response matrix (MC stat), and integrated luminosity (Int Lumi).
Njets¼1 Njets¼2 Njets¼3
Total(%) 10 13 16
Stat(%) 0.057 0.13 0.33
JES(%) 10 12 16
PU(%) 0.025 0.26 0.35
BG(%) 0.22 0.43 1.1
JER(%) 0.43 0.23 0.29
LepSF(%) 0.35 0.50 0.72
btagging(%) 0.41 0.69 1.5
MES(%) 0.20 0.18 0.17
MER(%) 0.015 0.0016 0.017
Wbð%Þ 0.062 0.22 0.38
t¯tð%Þ 0.014 0.38 0.83
MC stat(%) 0.094 0.14 0.26
[image:6.612.314.560.535.717.2]Uncertainties in the differences between efficiencies in data and simulation for the trigger, muon isolation, and muon identification criteria are generally less than 3%.
An uncertainty due to the finite number of simulated events used to construct the response matrix is estimated by randomly varying the content of each bin of the response matrix according to a Poisson uncertainty. The standard deviation of the unfolded results is taken as an estimate of the uncertainty. It ranges from 0.1% to 6.9% for jet multiplicities of 1 to 7.
The effect of the systematic uncertainties in the measured cross section as a function of jet multiplicity is illustrated in Fig.2, and in TableIIfor jet multiplicities of 1, 2, and 3. The total uncertainty is the sum in quadrature of all contributions.
IX. RESULTS
The measuredWð→μνÞ þjets fiducial cross sections are shown in Figs.3–15and compared to the predictions of the
NLO MC generators, and to the fixed-order theoretical
predictions provided by BLACKHATþSHERPA[43]and by a
Wþ1jet NNLO calculation[6,7]. The 8 TeV data sample
allows us to determine the cross sections for jet multiplic-ities up to 7 and to study the fiducial cross sections as functions of most kinematic observables for up to four jets.
An NLO prediction is provided by MADGRAPH5_
aMC@NLO version 2.2.1 [3], a MC generator with up to three final-state partons, with ME computation for up to two jets at NLO accuracy, which uses the NNPDF3.0 PDF set
[44]. The generator is interfaced with PYTHIA 8 [45] for
parton showering and hadronization, and the corresponding
sample is denoted MADGRAPH5_aMC@NLOþPYTHIA8
(denoted as MG5 aMCþPY8in the figure legends). The
merging of parton shower and ME is done with the FxFx
merging scheme[46]and the merging scale is set at 30 GeV.
The NNPDF2.3 PDF set [47] and the CUETP8M1 tune
[48] are used in PYTHIA8. Using the weighting methods
available in the generator[49], PDF and scale uncertainties
are assigned to the MADGRAPH5_aMC@NLOþPYTHIA8
jets
N
= 0 = 1 = 2 = 3 = 4 = 5 = 6 ≥7
jets) [pb]
jets
+ N
νμ
→
(W
σ
2 − 10
1 − 10
1 10 2 10
3 10
Data
4j LO + PS) ≤ MG5 + PY6 (
2j NLO + PS) ≤
MG5_aMC + PY8 ( BLACKHAT + SHERPA (NLO)
2j NLO 3,4j LO + PS) ≤
SHERPA2 (
CMS 19.6 fb-1 (8 TeV)
(R = 0.5) Jets T
[image:7.612.57.555.332.655.2]anti-k
| < 2.4 jet
η
> 30 GeV, | jet
T p
channel
ν μ →
W
jets N
= 0 = 1 = 2 = 3 = 4 = 5 = 6 ≥ 7
MG5/Data
0.5 1 1.5 2
2.5 ( ) Stat (and syst) uncert
jets N
= 0 = 1 = 2 = 3 = 4 = 5 = 6 ≥ 7
Theory/Data
0.5 1 1.5 2
2.5 Stat and syst uncert
jets
N
= 0 = 1 = 2 = 3 = 4 = 5 = 6 ≥ 7
SHERPA2/Data 0.5
1 1.5 2
2.5 Stat uncert
jets
N
= 0 = 1 = 2 = 3 = 4 = 5 = 6 ≥7
jets) [pb]
jets
N
≥
+
νμ
→
(W
σ
2 − 10
1 − 10
1 10 2 10
3 10
Data
4j LO + PS) ≤ MG5 + PY6 (
2j NLO + PS) ≤
MG5_aMC + PY8 ( BLACKHAT + SHERPA (NLO)
2j NLO 3,4j LO + PS) ≤
SHERPA2 (
CMS 19.6 fb-1 (8 TeV)
(R = 0.5) Jets T
anti-k
| < 2.4 jet
η
> 30 GeV, | jet
T p
channel
ν μ →
W
jets N
= 0 = 1 = 2 = 3 = 4 = 5 = 6 ≥ 7
MG5/Data
0.5 1 1.5 2
2.5 ( ) Stat (and syst) uncert
jets N
= 0 = 1 = 2 = 3 = 4 = 5 = 6 ≥ 7
Theory/Data
0.5 1 1.5 2
2.5 Stat and syst uncert
jets
N
0
≥ ≥ 1 ≥ 2 ≥ 3 ≥ 4 ≥ 5 ≥ 6 ≥ 7
SHERPA2/Data 0.5
1 1.5 2
2.5 Stat uncert
FIG. 3. Measured cross section versus exclusive (left) and inclusive (right) jet multiplicity, compared to the predictions of MADGRAPH,
MADGRAPH5_aMC@NLO,SHERPA2, and BLACKHATþSHERPA(corrected for hadronization and multiple-parton interactions), for which
) [GeV]
1
(j
T
p
100 200 300 400 500 600 700 800 900
) [pb / GeV]1
(j T / dp σ d 4 − 10 3 − 10 2 − 10 1 − 10 1 10
4j LO + PS) ≤ MG5 + PY6 (
2j NLO + PS) ≤ MG5_aMC + PY8 ( BLACKHAT + SHERPA (NLO)
NNLO jetti N
2j NLO 3,4j LO + PS) ≤
SHERPA2 (
(R = 0.5) Jets T
[image:8.612.72.536.46.645.2]anti-k
| < 2.4 jet η
> 30 GeV, | jet T p 1jet ≥ ) + ν μ → W ( ) [GeV] 1 (j T p 100 200 300 400 500 600 700 800 900
MG5/Data 0.6 0.8 1 1.2 1.4
( ) Stat (and syst) uncert
) [GeV] 1 (j T p 100 200 300 400 500 600 700 800 900 Theory/Data 0.6
0.8 1 1.2 1.4
Stat and syst uncert
) [GeV] 1 (j T p
100 200 300 400 500 600 700 800 900 1000 SHERPA2/Data 0.6 0.8 1 1.2 1.4 Stat uncert ) [GeV] 2 (j T p
100 200 300 400 500 600 700
) [pb / GeV]2 (j T / dp σ d 4 − 10 3 − 10 2 − 10 1 − 10
1 MG5 + PY6 (MG5_aMC + PY8 (≤ 4j LO + PS)≤ 2j NLO + PS) BLACKHAT + SHERPA (NLO)
2j NLO 3,4j LO + PS) ≤
SHERPA2 (
(R = 0.5) Jets T
anti-k
| < 2.4 jet η
> 30 GeV, | jet T p 2jets ≥ ) + ν μ → W ( ) [GeV] 2 (j T p 100 200 300 400 500 600 700
MG5/Data 0.6 0.8 1 1.2 1.4
( ) Stat (and syst) uncert
) [GeV] 2 (j T p 100 200 300 400 500 600 700 Theory/Data 0.6
0.8 1 1.2 1.4
Stat and syst uncert
) [GeV] 2 (j T p
100 200 300 400 500 600 700 800 SHERPA2/Data 0.6 0.8 1 1.2 1.4 Stat uncert ) [GeV] 3 (j T p
50 100 150 200 250
) [pb / GeV]3
(j T / dp σ d 4 − 10 3 − 10 2 − 10 1 − 10 1 Data
4j LO + PS) ≤ MG5 + PY6 (
2j NLO + PS) ≤ MG5_aMC + PY8 ( BLACKHAT + SHERPA (NLO)
2j NLO 3,4j LO + PS) ≤
SHERPA2 (
CMS 19.6 fb-1 (8 TeV)
(R = 0.5) Jets T
anti-k
| < 2.4 jet η
> 30 GeV, | jet T p 3jets ≥ ) + ν μ → W ( ) [GeV] 3 (j T p 50 100 150 200 250
MG5/Data 0.6 0.8 1 1.2 1.4
( ) Stat (and syst) uncert
) [GeV] 3 (j T p 50 100 150 200 250 Theory/Data 0.6
0.8 1 1.2 1.4
Stat and syst uncert
) [GeV] 3 (j T p
50 100 150 200 250 300 SHERPA2/Data 0.6 0.8 1 1.2 1.4 Stat uncert ) [GeV] 4 (j T p
40 60 80 100 120 140
) [pb / GeV]4
(j T / dp σ d 3 − 10 2 − 10 1 − 10 Data
4j LO + PS) ≤ MG5 + PY6 (
2j NLO + PS) ≤ MG5_aMC + PY8 ( BLACKHAT + SHERPA (NLO)
2j NLO 3,4j LO + PS) ≤
SHERPA2 (
CMS 19.6 fb-1 (8 TeV)
(R = 0.5) Jets T
anti-k
| < 2.4 jet η
> 30 GeV, | jet T p 4jets ≥ ) + ν μ → W ( ) [GeV] 4 (j T p 40 60 80 100 120 140
MG5/Data 0.6 0.8 1 1.2 1.4
( ) Stat (and syst) uncert
Theory/Data 0.6 0.8 1 1.2 1.4
Stat and syst uncert
) [GeV] 4 (j T p
40 60 80 100 120 140 SHERPA2/Data 0.6 0.8 1 1.2 1.4 Stat uncert
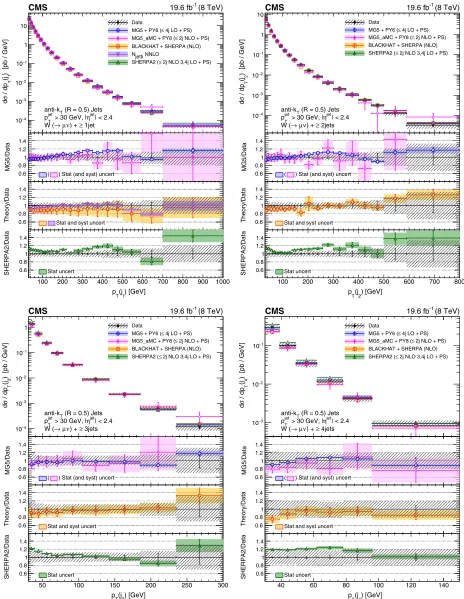
FIG. 4. Cross sections differential in the transverse momenta of the four leading jets, compared to the predictions of MADGRAPH,
MADGRAPH5_aMC@NLO,SHERPA2, BLACKHATþSHERPA, and NNLO inclusive one-jet production (indicated as Njetti NNLO). The
BLACKHATþSHERPA and NNLO predictions are corrected for hadronization and multiple-parton interaction effects. Black circular
(jets) [GeV]
T
H
200 400 600 800 1000 1200 1400
(jets) [pb / GeV]T
/ dH σ d 4 − 10 3 − 10 2 − 10 1 − 10 1
2j NLO + PS) ≤ MG5_aMC + PY8 ( BLACKHAT + SHERPA (NLO)
NNLO jetti N
2j NLO 3,4j LO + PS) ≤
SHERPA2 (
(R = 0.5) Jets T
[image:9.612.74.538.46.647.2]anti-k
| < 2.4 jet η
> 30 GeV, | jet T p 1jet ≥ ) + ν μ → W ( (jets) [GeV] T H 200 400 600 800 1000 1200 1400
MG5/Data
0.6 0.8 1 1.2
1.4 ( ) Stat (and syst) uncert
(jets) [GeV] T H 200 400 600 800 1000 1200 1400 Theory/Data 0.6
0.8 1 1.2
1.4 Stat and syst uncert
(jets) [GeV] T
H
200 400 600 800 1000 1200 1400 SHERPA2/Data 0.6
0.8 1 1.2
1.4 Stat uncert
(jets) [GeV]
T
H
200 400 600 800 1000
(jets) [pb / GeV]T
/ dH
σ
d 10−3
2 − 10 1 − 10
2j NLO + PS) ≤ MG5_aMC + PY8 ( BLACKHAT + SHERPA (NLO)
2j NLO 3,4j LO + PS) ≤
SHERPA2 (
(R = 0.5) Jets T
anti-k
| < 2.4 jet η
> 30 GeV, | jet T p 2jets ≥ ) + ν μ → W ( (jets) [GeV] T H 200 400 600 800 1000
MG5/Data
0.6 0.8 1 1.2
1.4 ( ) Stat (and syst) uncert
(jets) [GeV] T H 200 400 600 800 1000 Theory/Data 0.6
0.8 1 1.2
1.4 Stat and syst uncert
(jets) [GeV] T
H
200 400 600 800 1000 1200 SHERPA2/Data 0.6
0.8 1 1.2
1.4 Stat uncert
(jets) [GeV]
T
H
100 200 300 400 500 600 700 800 900
(jets) [pb / GeV]T
/ dH
σ
d 10−3
2 − 10 1 − 10 Data
4j LO + PS) ≤ MG5 + PY6 (
2j NLO + PS) ≤ MG5_aMC + PY8 ( BLACKHAT + SHERPA (NLO)
2j NLO 3,4j LO + PS) ≤
SHERPA2 (
CMS 19.6 fb-1 (8 TeV)
(R = 0.5) Jets T
anti-k
| < 2.4 jet η
> 30 GeV, | jet T p 3jets ≥ ) + ν μ → W ( (jets) [GeV] T H 100 200 300 400 500 600 700 800 900
MG5/Data
0.6 0.8 1 1.2
1.4 ( ) Stat (and syst) uncert
(jets) [GeV] T H 100 200 300 400 500 600 700 800 900 Theory/Data 0.6
0.8 1 1.2
1.4 Stat and syst uncert
(jets) [GeV] T
H
100 200 300 400 500 600 700 800 900 SHERPA2/Data 0.6
0.8 1 1.2
1.4 Stat uncert
(jets) [GeV]
T
H
200 300 400 500 600 700 800
(jets) [pb / GeV]T
/ dH σ d 3 − 10 2 − 10 Data
4j LO + PS) ≤ MG5 + PY6 (
2j NLO + PS) ≤ MG5_aMC + PY8 ( BLACKHAT + SHERPA (NLO)
2j NLO 3,4j LO + PS) ≤
SHERPA2 (
CMS 19.6 fb-1 (8 TeV)
(R = 0.5) Jets T
anti-k
| < 2.4 jet η
> 30 GeV, | jet T p 4jets ≥ ) + ν μ → W ( (jets) [GeV] T H 200 300 400 500 600 700 800 900
MG5/Data
0.6 0.8 1 1.2
1.4 ( ) Stat (and syst) uncert
(jets) [GeV] T H 200 300 400 500 600 700 800 900 Theory/Data 0.6
0.8 1 1.2
1.4 Stat and syst uncert
(jets) [GeV] T
H
200 300 400 500 600 700 800 900 SHERPA2/Data 0.6
0.8 1 1.2
1.4 Stat uncert
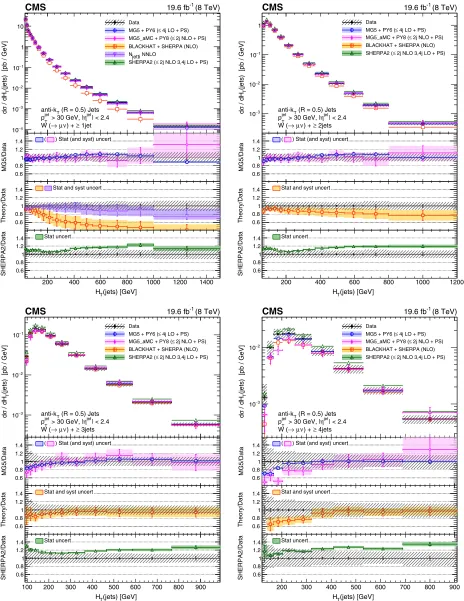
FIG. 5. Cross sections differential in HT for inclusive jet multiplicities 1–4, compared to the predictions of MADGRAPH,
MADGRAPH5_aMC@NLO,SHERPA2, BLACKHATþSHERPA, and NNLO inclusive one-jet production (indicated as Njetti NNLO). The
BLACKHATþSHERPA and NNLO predictions are corrected for hadronization and multiple-parton interaction effects. Black circular
[GeV]
T
dijet p
100 200 300 400 500 600 700
[pb / GeV] T
/ dp
σ
d
4
−
10
3
−
10
2
−
10
1
−
10
1 MG5 + PY6 (≤ 4j LO + PS) 2j NLO + PS) ≤ MG5_aMC + PY8 ( BLACKHAT + SHERPA (NLO)
2j NLO 3,4j LO + PS) ≤
SHERPA2 (
(R = 0.5) Jets T
[image:10.612.73.540.44.653.2]anti-k
| < 2.4 jet η
> 30 GeV, | jet
T p
2jets
≥
) +
ν μ →
W (
[GeV] T dijet p 100 200 300 400 500 600 700
MG5/Data
0.6 0.8 1 1.2
1.4 ( ) Stat (and syst) uncert
[GeV] T dijet p 100 200 300 400 500 600 700 Theory/Data 0.6
0.8 1 1.2
1.4 Stat and syst uncert
[GeV] T dijet p
100 200 300 400 500 600 700 800 SHERPA2/Data 0.6
0.8 1 1.2
1.4 Stat uncert
[GeV]
T
dijet p
50 100 150 200 250
[pb / GeV] T
/ dp
σ
d 10−2
1
−
10
4j LO + PS) ≤ MG5 + PY6 (
2j NLO + PS) ≤ MG5_aMC + PY8 ( BLACKHAT + SHERPA (NLO)
2j NLO 3,4j LO + PS) ≤
SHERPA2 (
(R = 0.5) Jets T
anti-k
| < 2.4 jet η
> 30 GeV, | jet
T p
3jets
≥
) +
ν μ →
W (
[GeV] T dijet p 50 100 150 200 250
MG5/Data
0.6 0.8 1 1.2
1.4 ( ) Stat (and syst) uncert
[GeV] T dijet p 50 100 150 200 250 Theory/Data 0.6
0.8 1 1.2
1.4 Stat and syst uncert
[GeV] T dijet p
50 100 150 200 250 300 SHERPA2/Data 0.6
0.8 1 1.2
1.4 Stat uncert
[GeV]
T
dijet p
40 60 80 100 120 140
[pb / GeV] T
/ dp
σ
d
2
−
10
1
−
10
Data
4j LO + PS) ≤ MG5 + PY6 (
2j NLO + PS) ≤ MG5_aMC + PY8 ( BLACKHAT + SHERPA (NLO)
2j NLO 3,4j LO + PS) ≤
SHERPA2 (
CMS 19.6 fb-1 (8 TeV)
(R = 0.5) Jets T
anti-k
| < 2.4 jet η
> 30 GeV, | jet
T p
4jets
≥
) +
ν μ →
W (
[GeV] T dijet p 40 60 80 100 120 140
MG5/Data
0.6 0.8 1 1.2
1.4 ( ) Stat (and syst) uncert
[GeV] T dijet p 40 60 80 100 120 140 Theory/Data 0.6
0.8 1 1.2
1.4 Stat and syst uncert
[GeV] T dijet p
20 40 60 80 100 120 140 SHERPA2/Data 0.6
0.8 1 1.2
1.4 Stat uncert
FIG. 6. Cross sections differential in dijetpT(calculated from the two leading jets) for inclusive jet multiplicities 2–4, compared to the
[GeV] 2 j 1 j M
100 200 300 400 500 600
) [pb / GeV]
2 ,j1 / dM(j σ d 2 − 10 1 − 10 1
2j NLO + PS) ≤ MG5_aMC + PY8 ( BLACKHAT + SHERPA (NLO)
2j NLO 3,4j LO + PS) ≤
SHERPA2 (
(R = 0.5) Jets T
[image:11.612.78.540.45.644.2]anti-k
| < 2.4 jet η
> 30 GeV, | jet T p 2jets ≥ ) + ν μ → W ( [GeV] 2 j1 j M 100 200 300 400 500 600 700
MG5/Data
0.6 0.8 1 1.2
1.4 ( ) Stat (and syst) uncert
[GeV] 2 j1
j
M 100 200 300 400 500 600 700 Theory/Data 0.6
0.8 1 1.2
1.4 Stat and syst uncert
) 2 ,j 1 M(j
0 100 200 300 400 500 600 700 SHERPA2/Data 0.6
0.8 1 1.2
1.4 Stat uncert
[GeV] 2 j 1 j M
100 200 300 400 500 600
) [pb / GeV]
2 ,j1 / dM(j σ d 3 − 10 2 − 10 1 − 10
2j NLO + PS) ≤ MG5_aMC + PY8 ( BLACKHAT + SHERPA (NLO)
2j NLO 3,4j LO + PS) ≤
SHERPA2 (
(R = 0.5) Jets T
anti-k
| < 2.4 jet η
> 30 GeV, | jet T p 3jets ≥ ) + ν μ → W ( [GeV] 2 j1 j M 100 200 300 400 500 600
MG5/Data
0.6 0.8 1 1.2
1.4 ( ) Stat (and syst) uncert
[GeV] 2
j1
j
M 100 200 300 400 500 600 Theory/Data 0.6
0.8 1 1.2
1.4 Stat and syst uncert
) 2 ,j 1 M(j
0 100 200 300 400 500 600 SHERPA2/Data 0.6
0.8 1 1.2
1.4 Stat uncert
[GeV] 2 j 1 j M
100 200 300 400 500 600
) [pb / GeV]2 ,j1 / dM(j σ d 4 − 10 3 − 10 2 − 10 1 − 10 Data
4j LO + PS) ≤ MG5 + PY6 (
2j NLO + PS) ≤ MG5_aMC + PY8 ( BLACKHAT + SHERPA (NLO)
2j NLO 3,4j LO + PS) ≤
SHERPA2 (
CMS 19.6 fb-1 (8 TeV)
(R = 0.5) Jets T
anti-k
| < 2.4 jet η
> 30 GeV, | jet T p 4jets ≥ ) + ν μ → W ( [GeV] 2 j1 j M 100 200 300 400 500 600
MG5/Data
0.6 0.8 1 1.2
1.4 ( ) Stat (and syst) uncert
[GeV] 2 j1
j
M 100 200 300 400 500 600 Theory/Data 0.6
0.8 1 1.2
1.4 Stat and syst uncert
) 2 ,j 1 M(j
0 100 200 300 400 500 600 SHERPA2/Data 0.6
0.8 1 1.2
1.4 Stat uncert
)|
1
(j η |
0.2 0.4 0.6 0.8 1 1.2 1.4 1.6 1.8 2 2.2
)| [pb]1
(j η / d| σ d 2 10 3
10 MG5 + PY6 (≤ 4j LO + PS) 2j NLO + PS) ≤ MG5_aMC + PY8 ( BLACKHAT + SHERPA (NLO)
NNLO jetti N
2j NLO 3,4j LO + PS) ≤
SHERPA2 (
(R = 0.5) Jets T
[image:12.612.73.539.43.653.2]anti-k
| < 2.4 jet η
> 30 GeV, | jet T p 1jet ≥ ) + ν μ → W ( )| 1 (j η | 0.2 0.4 0.6 0.8 1 1.2 1.4 1.6 1.8 2 2.2 2.4
MG5/Data 0.6 0.8 1 1.2 1.4
( ) Stat (and syst) uncert
)| 1 (j η | 0.2 0.4 0.6 0.8 1 1.2 1.4 1.6 1.8 2 2.2 2.4 Theory/Data 0.6
0.8 1 1.2 1.4
Stat and syst uncert
)| 1 (j
η
|
0 0.2 0.4 0.6 0.8 1 1.2 1.4 1.6 1.8 2 2.2 2.4 SHERPA2/Data 0.6 0.8 1 1.2 1.4 Stat uncert )| 2 (j η |
0.2 0.4 0.6 0.8 1 1.2 1.4 1.6 1.8 2 2.2
)| [pb]2
(j η / d| σ d 2 10
4j LO + PS) ≤ MG5 + PY6 (
2j NLO + PS) ≤ MG5_aMC + PY8 ( BLACKHAT + SHERPA (NLO)
2j NLO 3,4j LO + PS) ≤
SHERPA2 (
(R = 0.5) Jets T
anti-k
| < 2.4 jet η
> 30 GeV, | jet T p 2jets ≥ ) + ν μ → W ( )| 2 (j η | 0.2 0.4 0.6 0.8 1 1.2 1.4 1.6 1.8 2 2.2 2.4
MG5/Data 0.6 0.8 1 1.2 1.4
( ) Stat (and syst) uncert
)| 2 (j η | 0.2 0.4 0.6 0.8 1 1.2 1.4 1.6 1.8 2 2.2 2.4 Theory/Data 0.6
0.8 1 1.2 1.4
Stat and syst uncert
)| 2 (j
η
|
0 0.2 0.4 0.6 0.8 1 1.2 1.4 1.6 1.8 2 2.2 2.4 SHERPA2/Data 0.6 0.8 1 1.2 1.4 Stat uncert )| 3 (j η |
0.2 0.4 0.6 0.8 1 1.2 1.4 1.6 1.8 2 2.2 2.4
)| [pb] 3
(j η / d| σ d 10 Data
4j LO + PS) ≤ MG5 + PY6 (
2j NLO + PS) ≤ MG5_aMC + PY8 ( BLACKHAT + SHERPA (NLO)
2j NLO 3,4j LO + PS) ≤
SHERPA2 (
CMS 19.6 fb-1 (8 TeV)
(R = 0.5) Jets T
anti-k
| < 2.4 jet η
> 30 GeV, | jet T p 3jets ≥ ) + ν μ → W ( )| 3 (j η | 0.2 0.4 0.6 0.8 1 1.2 1.4 1.6 1.8 2 2.2 2.4
MG5/Data 0.6 0.8 1 1.2 1.4
( ) Stat (and syst) uncert
)| 3 (j η | 0.2 0.4 0.6 0.8 1 1.2 1.4 1.6 1.8 2 2.2 2.4 Theory/Data 0.6
0.8 1 1.2 1.4
Stat and syst uncert
)| 3 (j
η
|
0 0.2 0.4 0.6 0.8 1 1.2 1.4 1.6 1.8 2 2.2 2.4 SHERPA2/Data 0.6 0.8 1 1.2 1.4 Stat uncert )| 4 (j η |
0.2 0.4 0.6 0.8 1 1.2 1.4 1.6 1.8 2 2.2
)| [pb]4
(j η / d| σ d 1 10 Data
4j LO + PS) ≤ MG5 + PY6 (
2j NLO + PS) ≤ MG5_aMC + PY8 ( BLACKHAT + SHERPA (NLO)
2j NLO 3,4j LO + PS) ≤
SHERPA2 (
CMS 19.6 fb-1 (8 TeV)
(R = 0.5) Jets T
anti-k
| < 2.4 jet η
> 30 GeV, | jet T p 4jets ≥ ) + ν μ → W ( )| 4 (j η | 0.2 0.4 0.6 0.8 1 1.2 1.4 1.6 1.8 2 2.2 2.4
MG5/Data 0.6 0.8 1 1.2 1.4
( ) Stat (and syst) uncert
)| 4 (j η | 0.2 0.4 0.6 0.8 1 1.2 1.4 1.6 1.8 2 2.2 2.4 Theory/Data 0.6
0.8 1 1.2 1.4
Stat and syst uncert
)| 4 (j
η
|
0 0.2 0.4 0.6 0.8 1 1.2 1.4 1.6 1.8 2 2.2 2.4 SHERPA2/Data 0.6 0.8 1 1.2 1.4 Stat uncert
FIG. 8. Cross sections differential in the pseudorapidities of the four leading jets, compared to the predictions of MADGRAPH,
MADGRAPH5_aMC@NLO,SHERPA2, BLACKHATþSHERPA, and NNLO inclusive one-jet production (indicated as Njetti NNLO). The
BLACKHATþSHERPA and NNLO predictions are corrected for hadronization and multiple-parton interaction effects. Black circular
)| 2 j 1 y(j Δ |
0.5 1 1.5 2 2.5 3 3.5 4 4.5
)| [pb]2 ,j1 y(j Δ / d| σ d 1 10 2 10
2j NLO + PS) ≤ MG5_aMC + PY8 ( BLACKHAT + SHERPA (NLO)
2j NLO 3,4j LO + PS) ≤
SHERPA2 (
(R = 0.5) Jets T
[image:13.612.67.546.49.663.2]anti-k
| < 2.4 jet η
> 30 GeV, | jet T p 2jets ≥ ) + ν μ → W ( )| 2 j 1 y(j Δ | 0.5 1 1.5 2 2.5 3 3.5 4 4.5
MG5/Data 0.6 0.8 1 1.2 1.4
( ) Stat (and syst) uncert
)| 2 j 1 y(j Δ | 0.5 1 1.5 2 2.5 3 3.5 4 4.5 Theory/Data 0.6
0.8 1 1.2 1.4
Stat and syst uncert
)| 2 ,j 1 y(j Δ |
0 0.5 1 1.5 2 2.5 3 3.5 4 4.5 SHERPA2/Data 0.6 0.8 1 1.2 1.4 Stat uncert )| 2 j 1 y(j Δ |
0.5 1 1.5 2 2.5 3 3.5 4 4.5
)| [pb]2 ,j1 y(j Δ / d| σ d 1 − 10 1 10
2j NLO + PS) ≤ MG5_aMC + PY8 ( BLACKHAT + SHERPA (NLO)
2j NLO 3,4j LO + PS) ≤
SHERPA2 (
(R = 0.5) Jets T
anti-k
| < 2.4 jet η
> 30 GeV, | jet T p 3jets ≥ ) + ν μ → W ( )| 2 j 1 y(j Δ | 0.5 1 1.5 2 2.5 3 3.5 4 4.5
MG5/Data 0.6 0.8 1 1.2 1.4
( ) Stat (and syst) uncert
)| 2 j 1 y(j Δ | 0.5 1 1.5 2 2.5 3 3.5 4 4.5 Theory/Data 0.6
0.8 1 1.2 1.4
Stat and syst uncert
)| 2 ,j 1 y(j Δ |
0 0.5 1 1.5 2 2.5 3 3.5 4 4.5 SHERPA2/Data 0.6 0.8 1 1.2 1.4 Stat uncert )| 2 j 1 y(j Δ |
0.5 1 1.5 2 2.5 3 3.5 4 4.5
)| [pb]2
,j1 y(j Δ / d| σ d 2 − 10 1 − 10 1 10 2 10 Data
4j LO + PS) ≤ MG5 + PY6 (
2j NLO + PS) ≤ MG5_aMC + PY8 ( BLACKHAT + SHERPA (NLO)
2j NLO 3,4j LO + PS) ≤
SHERPA2 (
CMS 19.6 fb-1 (8 TeV)
(R = 0.5) Jets T
anti-k
| < 2.4 jet η
> 30 GeV, | jet T p 4jets ≥ ) + ν μ → W ( )| 2 j 1 y(j Δ | 0.5 1 1.5 2 2.5 3 3.5 4 4.5
MG5/Data 0.6 0.8 1 1.2 1.4
( ) Stat (and syst) uncert
)| 2 j 1 y(j Δ | 0.5 1 1.5 2 2.5 3 3.5 4 4.5 Theory/Data 0.6
0.8 1 1.2 1.4
Stat and syst uncert
)| 2 ,j 1 y(j Δ |
0 0.5 1 1.5 2 2.5 3 3.5 4 4.5 SHERPA2/Data 0.6 0.8 1 1.2 1.4 Stat uncert
FIG. 9. Cross sections differential inΔyðj1; j2Þ for inclusive jet multiplicities 2–4, compared to the predictions of MADGRAPH,
MADGRAPH5_aMC@NLO,SHERPA 2, and BLACKHATþSHERPA (corrected for hadronization and multiple-parton interactions). Black
predictions by considering the NNPDF3.0 PDF uncertain-ties, and by independently varying the factorization and renormalization scales by a factor of 0.5 or 2, excluding the combinations where one scale is varied by a factor of 0.5 and the other one by a factor of 2.
Another NLO prediction is provided bySHERPAversion
2.1.1, a multileg NLO MC generator with parton showering
interfaced with BLACKHAT [50,51] for the one-loop
cor-rections. This sample of events is produced with the CT10
PDF set. The corresponding sample is denotedSHERPA 2.
The SHERPA 2 matrix element calculations include the
production of up to four parton jets, with NLO accuracy for up to two jets and LO accuracy for three and four jets. The merging of parton showers and MEs is done with the
MEPS@NLO method [4,52]and the merging scale set at
20 GeV. The predictions from MADGRAPH5þPYTHIA6and
SHERPA2 are shown with statistical uncertainties only.
The BLACKHATþSHERPAcalculation yields fixed-order
NLO predictions for 8 TeVWþnjets at the level of ME
partons, where n¼1–4. The choice of renormalization
and factorization scales for BLACKHATþSHERPA is
ˆ
H0T=2, where Hˆ0
T¼
P
mpmTþEWT, the sum running over
final-state partons, andEWT being the transverse energy of the
W boson. A nonperturbative correction is applied to the
BLACKHATþSHERPAdistributions to account for the effects
of multiple-parton interactions and hadronization. This
correction is determined with MADGRAPH 5.1.1interfaced
with PYTHIA 6.426 with and without hadronization and multiple-parton interactions. The nonperturbative correction factor is mostly in the range 0.90–1.20. A PDF uncertainty is
assigned to the predictions of BLACKHATþSHERPA by
considering the error sets of CT10 PDFs. A factorization and renormalization scale uncertainty is also assigned to BLACKHATþSHERPApredictions, as determined by varying
the scales simultaneously by a factor of 0.5 or 2.
An NNLO calculation ofWþjet production in
pertur-bative QCD (Njetti NNLO) is also used for comparisons
with certain measured distributions (leading jet pT, HT,
andjηj, Figs.4,5, and8) forNjets ≥1. The CT14 NNLO PDF set is used in the calculation. A nonperturbative correction is applied to this prediction, as in the case of BLACKHATþSHERPA, as well as an additional correction
factor of about 1.01 due to the effect of final-state radiation from the muon. A factorization and renormalization scale
)| 3 j 1 y(j Δ | 0 0.5 1 1.5 2 2.5 3 3.5 4 4.5
)| [pb] 3 ,j 1 y(j Δ / d| σ d 1 − 10 1 10 2
10 MG5 + PY6 (≤ 4j LO + PS)
2j NLO + PS) ≤
MG5_aMC + PY8 ( BLACKHAT + SHERPA (NLO)
2j NLO 3,4j LO + PS) ≤
SHERPA2 (
(R = 0.5) Jets T
[image:14.612.60.557.45.373.2]anti-k
| < 2.4 jet
η
> 30 GeV, | jet T p 3jets ≥ ) + ν μ → W ( )| 3 j 1 y(j Δ | 0 0.5 1 1.5 2 2.5 3 3.5 4 4.5
MG5/Data 0.6 0.8 1 1.2 1.4
( ) Stat (and syst) uncert
)| 3 j 1 y(j Δ | 0.5 1 1.5 2 2.5 3 3.5 4 4.5
Theory/Data 0.6
0.8 1 1.2 1.4
Stat and syst uncert
)| 3 ,j 1 y(j Δ |
0 0.5 1 1.5 2 2.5 3 3.5 4 4.5
SHERPA2/Data 0.6 0.8 1 1.2 1.4 Stat uncert )| 3 j 2 y(j Δ | 0.5 1 1.5 2 2.5 3 3.5 4 4.5
)| [pb] 3 ,j 2 y(j Δ / d| σ d 1 − 10 1 10 2
10 MG5 + PY6 (≤ 4j LO + PS)
2j NLO + PS) ≤
MG5_aMC + PY8 ( BLACKHAT + SHERPA (NLO)
2j NLO 3,4j LO + PS) ≤
SHERPA2 (
(R = 0.5) Jets T
anti-k
| < 2.4 jet
η
> 30 GeV, | jet T p 3jets ≥ ) + ν μ → W ( )| 3 j 2 y(j Δ | 0.5 1 1.5 2 2.5 3 3.5 4 4.5
MG5/Data 0.6 0.8 1 1.2 1.4
( ) Stat (and syst) uncert
)| 3 j 2 y(j Δ | 0.5 1 1.5 2 2.5 3 3.5 4 4.5
Theory/Data 0.6
0.8 1 1.2 1.4
Stat and syst uncert
)| 3 ,j 2 y(j Δ |
0 0.5 1 1.5 2 2.5 3 3.5 4 4.5
SHERPA2/Data 0.6 0.8 1 1.2 1.4 Stat uncert
FIG. 10. Cross sections differential inΔyðj1; j3Þ(left) andΔyðj2; j3Þ(right) for an inclusive jet multiplicity of 3, compared to the predictions of MADGRAPH, MADGRAPH5_aMC@NLO,SHERPA2, and BLACKHATþSHERPA(corrected for hadronization and
) B j F y(j Δ
0.5 1 1.5 2 2.5 3 3.5 4 4.5
) [pb] B ,j F y(j Δ / d σ d 1 10 2 10
2j NLO + PS) ≤ MG5_aMC + PY8 ( BLACKHAT + SHERPA (NLO)
2j NLO 3,4j LO + PS) ≤
SHERPA2 (
(R = 0.5) Jets T
[image:15.612.73.546.45.655.2]anti-k
| < 2.4 jet η
> 30 GeV, | jet T p 2jets ≥ ) + ν μ → W ( ) B j F y(j Δ 0.5 1 1.5 2 2.5 3 3.5 4 4.5
MG5/Data 0.6 0.8 1 1.2 1.4
( ) Stat (and syst) uncert
) B j F y(j Δ 0.5 1 1.5 2 2.5 3 3.5 4 4.5 Theory/Data 0.6
0.8 1 1.2 1.4
Stat and syst uncert
) B ,j F y(j Δ
0 0.5 1 1.5 2 2.5 3 3.5 4 4.5 SHERPA2/Data 0.6 0.8 1 1.2 1.4 Stat uncert ) B j F y(j Δ
0.5 1 1.5 2 2.5 3 3.5 4 4.5
) [pb] B ,j F y(j Δ / d σ d 1 − 10 1 10
2j NLO + PS) ≤ MG5_aMC + PY8 ( BLACKHAT + SHERPA (NLO)
2j NLO 3,4j LO + PS) ≤
SHERPA2 (
(R = 0.5) Jets T
anti-k
| < 2.4 jet η
> 30 GeV, | jet T p 3jets ≥ ) + ν μ → W ( ) B j F y(j Δ 0.5 1 1.5 2 2.5 3 3.5 4 4.5
MG5/Data 0.6 0.8 1 1.2 1.4
( ) Stat (and syst) uncert
) B j F y(j Δ 0.5 1 1.5 2 2.5 3 3.5 4 4.5 Theory/Data 0.6
0.8 1 1.2 1.4
Stat and syst uncert
) B ,j F y(j Δ
0 0.5 1 1.5 2 2.5 3 3.5 4 4.5 SHERPA2/Data 0.6 0.8 1 1.2 1.4 Stat uncert ) B j F y(j Δ
0.5 1 1.5 2 2.5 3 3.5 4 4.5
) [pb] B ,j F y(j Δ / d σ d 2 − 10 1 − 10 1 10 2 10 Data
4j LO + PS) ≤ MG5 + PY6 (
2j NLO + PS) ≤ MG5_aMC + PY8 ( BLACKHAT + SHERPA (NLO)
2j NLO 3,4j LO + PS) ≤
SHERPA2 (
CMS 19.6 fb-1 (8 TeV)
(R = 0.5) Jets T
anti-k
| < 2.4 jet η
> 30 GeV, | jet T p 4jets ≥ ) + ν μ → W ( ) B j F y(j Δ 0.5 1 1.5 2 2.5 3 3.5 4 4.5
MG5/Data 0.6 0.8 1 1.2 1.4
( ) Stat (and syst) uncert
) B j F y(j Δ 0.5 1 1.5 2 2.5 3 3.5 4 4.5 Theory/Data 0.6
0.8 1 1.2 1.4
Stat and syst uncert
) B ,j F y(j Δ
0 0.5 1 1.5 2 2.5 3 3.5 4 4.5 SHERPA2/Data 0.6 0.8 1 1.2 1.4 Stat uncert
FIG. 11. Cross sections differential inΔyðjF; jBÞfor inclusive jet multiplicities 2–4, compared to the predictions of MADGRAPH,
MADGRAPH5_aMC@NLO,SHERPA 2, and BLACKHATþSHERPA (corrected for hadronization and multiple-parton interactions). Black
uncertainty is assigned to this prediction, as determined by
varying the central scale
ffiffiffiffiffiffiffiffiffiffiffiffiffiffiffiffiffiffiffiffiffiffiffiffiffiffiffiffiffiffiffiffiffiffi
m2
lνþ ð
P
jetpjet TÞ
2
q
by a factor of
0.5 or 2.
The measured exclusive and inclusive jet multiplicity
distributions, shown in Fig. 3, are in agreement with the
predictions of the MADGRAPH5_aMC@NLOþPYTHIA8
gen-erators and with the calculation of BLACKHATþSHERPA.
For multiplicities above 5, SHERPA 2 starts to deviate
upward from the measurement.
The cross sections differential in jetpTfor inclusive jet multiplicities from 1 to 4 are shown in Fig.4. The jetpTand
HTdistributions are sensitive to the effects of higher-order processes. The current results extend to 1.0 and 1.5 TeV in the leading-jetpTandHTdistributions, respectively, for at least one jet. The predictions from BLACKHATþSHERPA(jets
1 through 4) are in agreement with the measured distribu-tions within the systematic uncertainties. The predicdistribu-tions
from MADGRAPH5þPYTHIA6 show reasonable agreement
with data, with the largest discrepancy being an overestimate
of up to 20% for the leading and second-leading jet pT
distributions in the intermediate-pTregion. In comparison to
the corresponding measurements of the leading and
second-leading jet pT spectra made by CMS with 7 TeV
data [12], we observe a smaller slope in the ratio of the
MADGRAPH5þPYTHIA6prediction to the measurement. The
predictions from MADGRAPH5_aMC@NLOþPYTHIA8are in
agreement with data within uncertainties. The NNLO prediction for at least one jet agrees with the unfolded jet
pTcross section within the systematic uncertainties. At low
pT values (below 50 GeV), the predictions for the first-,
second-, and third-leading jetpT from SHERPA2
overesti-mate the data.
The HT distributions for inclusive jet multiplicities
of 1 to 4 are shown in Fig. 5. The HT distributions
are best modeled by the NNLO prediction for an inclusive
jet multiplicity of 1, and by MADGRAPH5þPYTHIA6 and
MADGRAPH5_aMC@NLOþPYTHIA8 for inclusive jet multi-plicities of 1 and 2. For higher jet multimulti-plicities, the MADGRAPH5þPYTHIA6 and MADGRAPH5_aMC@NLOþ PYTHIA8 predictions underestimate the data at low values
of HT (below 200 GeV). The SHERPA 2 predictions for
HT consistently overestimate the data for all inclusive jet
multiplicities and display a harder HT spectrum. The
) 2 j 1 (j φ Δ 0.5 1 1.5 2 2.5 3
) [pb]2 ,j1 (j φΔ / d σ d 10 2 10
4j LO + PS) ≤ MG5 + PY6 (
2j NLO + PS) ≤
MG5_aMC + PY8 ( BLACKHAT + SHERPA (NLO)
2j NLO 3,4j LO + PS) ≤
SHERPA2 (
(R = 0.5) Jets T
[image:16.612.60.556.46.370.2]anti-k
| < 2.4 jet
η
> 30 GeV, | jet T p 2jets ≥ ) + ν μ → W ( ) 2 j 1 (j φ Δ
0.5 1 1.5 2 2.5 3
MG5/Data 0.6 0.8 1 1.2 1.4
( ) Stat (and syst) uncert
) 2 j 1 (j φ Δ
0.5 1 1.5 2 2.5 3
Theory/Data 0.6
0.8 1 1.2 1.4
Stat and syst uncert
) 2 ,j 1 (j φ Δ
0 0.5 1 1.5 2 2.5 3
SHERPA2/Data 0.6 0.8 1 1.2 1.4 Stat uncert ) B j F (j φ Δ 0.5 1 1.5 2 2.5 3
) [pb] B ,j F (j φΔ / d σ d 10 2 10
4j LO + PS) ≤ MG5 + PY6 (
2j NLO + PS) ≤
MG5_aMC + PY8 ( BLACKHAT + SHERPA (NLO)
2j NLO 3,4j LO + PS) ≤
SHERPA2 (
(R = 0.5) Jets T
anti-k
| < 2.4 jet
η
> 30 GeV, | jet T p 2jets ≥ ) + ν μ → W ( ) B j F (j φ Δ
0.5 1 1.5 2 2.5 3
MG5/Data 0.6 0.8 1 1.2 1.4
( ) Stat (and syst) uncert
) B j F (j φ Δ
0.5 1 1.5 2 2.5 3
Theory/Data 0.6
0.8 1 1.2 1.4
Stat and syst uncert
) B ,j F (j φ Δ
0 0.5 1 1.5 2 2.5 3
SHERPA2/Data 0.6 0.8 1 1.2 1.4 Stat uncert
BLACKHATþSHERPAprediction underestimates the dataHT
distribution for Njets≥1, as expected because the NLO
prediction for HT forNjets≥1is a fixed-order prediction
with up to two real partons, and contributions from higher jet multiplicities are missing[53].
The dijetpTand invariant mass spectra for inclusive jet multiplicities of 2, 3, and 4 are shown in Figs.6and7. Dijet quantities are based on the two leading jets in the event, and
they constitute an important test of the modeling of pT
correlations among jets, whose correct accounting is crucial for searches for physics beyond the SM in dijet final states. All of the predictions agree reasonably well with data, but
SHERPA2consistently overestimates the data for high values
of dijet pT and invariant mass, particularly in the dijet
pT spectrum forNjets≥2. The MADGRAPH5_aMC@NLOþ
PYTHIA8prediction also underestimates the data for values of
the invariant mass below 200 GeV in the inclusive four-jet distribution.
The dependence of the cross section on several angular variables and angular correlations between jets is also
sections are best predicted by MADGRAPH5þPYTHIA6and
MADGRAPH5_aMC@NLOþPYTHIA8. All predictions agree
with the data, with some variations in the overall normali-zation and a slight underestimation for large values ofjηj. The distributions of the rapidity difference and the
azimuthal angles betweenpT-ordered and rapidity-ordered
jets are shown in Figs. 9–12. The measurement of the
rapidity difference between pT-ordered jets is shown for
different jet pairings: the two leading jets Δyðj1; j2Þ and the first- (second-) and third-leading jets Δyðj1; j3Þ (Δyðj2; j3Þ). The measurement of the rapidity difference between rapidity-ordered jets makes use of the most forward and most backward jets,ΔyðjF; jBÞ. The quantities Δyðj1; j2Þ and ΔyðjF; jBÞ are studied for inclusive jet
multiplicities of 2 to 4, while Δyðj1; j3Þ and Δyðj2; j3Þ are studied forNjets≥3. A study of the rapidity difference between the two leading jets is helpful in testing the wide-angle soft parton radiation and the implementation of parton showering. The measurement of the rapidity differences between the forward/backward jets is also instrumental in understanding QCD radiation and wide-angle particle emission. The distribution of the azimuthal angle difference is sensitive to higher-order processes and is shown for
pT-ordered and rapidity-ordered jets for an inclusive multi-plicity of 2. Overall, the predicted distributions of the rapidity difference betweenpT-ordered jets are in agreement
with the measurements, with MADGRAPH5þPYTHIA6 and
BLACKHATþSHERPA underestimating the data for jΔyj
values above 2. A similar observation can be made for the rapidity difference between the most forward and most backward jets. This behavior is also reflected in the ΔRðj1; j2Þmeasurement, shown in Fig.13. All predictions
for the azimuthal angle difference between jets are in agreement with data, with some variations in the overall normalization.
The distributions of the azimuthal angle between the muon and the leading jet, for inclusive jet multiplicities 1 to
4, are shown in Fig. 14. Overall, the predictions are in
agreement with the measurements, except for BLACKHATþ
SHERPA, which disagrees with the data at low values of the
Δϕfor an inclusive jet multiplicity of 1.
Finally, the average number of jets,hNjetsi, is shown as a function ofHT,Δyðj1; j2Þ, andΔyðjF; jBÞin the inclusive two-jet events in Fig.15. In the high-HT region, which is particularly sensitive to higher-order processes, the average number of jets plateaus around a value of 3.5. Although MADGRAPH5þPYTHIA6tends to underestimatehNjetsiand SHERPA 2 tends to overestimate it, the deviations are not significant and both generators appear to adequately reproduce the data. Good agreement is observed between the data and all predictions for the dependence ofhNjetsion
the pT-ordered and rapidity-ordered rapidity differences.
These measurements provide an important test of the
)
2
j
1
R(j
1 2 3 4 5
) [pb]2
,j1
R(j
Δ
/ d
σ
d
2 − 10
1 − 10
1 10 2 10 3 10
2j NLO + PS) ≤ MG5_aMC + PY8 ( BLACKHAT + SHERPA (NLO)
2j NLO 3,4j LO + PS) ≤
SHERPA2 (
(R = 0.5) Jets T
[image:17.612.60.292.49.355.2]anti-k
| < 2.4 jet η
> 30 GeV, | jet
T p
2jets
≥
) +
ν μ →
W (
) 2 j 1 R(j Δ
1 2 3 4 5 6
MG5/Data
0.6 0.8 1 1.2 1.4
( ) Stat (and syst) uncert
) 2 j 1 R(j Δ
1 2 3 4 5 6
Theory/Data 0.6 0.8 1 1.2 1.4
Stat and syst uncert
) 2 ,j 1 R(j
Δ
0 1 2 3 4 5 6
SHERPA2/Data 0.6 0.8 1 1.2 1.4
Stat uncert
FIG. 13. Cross section differential inΔRðj1; j2Þfor an inclusive jet multiplicity of 2, compared to the predictions of MADGRAPH,
MADGRAPH5_aMC@NLO, SHERPA 2, and BLACKHATþSHERPA
) μ , 1 (j φ Δ
0.5 1 1.5 2 2.5 3
) [pb]
μ ,1 (j φΔ / d σ d 2 10 3 10
4j LO + PS) ≤ MG5 + PY6 (
2j NLO + PS) ≤ MG5_aMC + PY8 ( BLACKHAT + SHERPA (NLO)
2j NLO 3,4j LO + PS) ≤
SHERPA2 (
(R = 0.5) Jets T
[image:18.612.63.545.47.669.2]anti-k
| < 2.4 jet η
> 30 GeV, | jet T p 1jet ≥ ) + ν μ → W ( ) μ , 1 (j φ Δ
0.5 1 1.5 2 2.5 3
MG5/Data
0.6 0.8 1 1.2
1.4 ( ) Stat (and syst) uncert
) μ , 1 (j φ Δ
0.5 1 1.5 2 2.5 3
Theory/Data 0.6 0.8 1 1.2
1.4 Stat and syst uncert
) μ , 1 (j φ Δ
0 0.5 1 1.5 2 2.5 3
SHERPA2/Data 0.6 0.8 1 1.2
1.4 Stat uncert
) μ , 2 (j φ Δ
0.5 1 1.5 2 2.5 3
) [pb]
μ ,2 (j φΔ / d σ d 2 10
4j LO + PS) ≤ MG5 + PY6 (
2j NLO + PS) ≤ MG5_aMC + PY8 ( BLACKHAT + SHERPA (NLO)
2j NLO 3,4j LO + PS) ≤
SHERPA2 (
(R = 0.5) Jets T
anti-k
| < 2.4 jet η
> 30 GeV, | jet T p 2jets ≥ ) + ν μ → W ( ) μ , 2 (j φ Δ
0.5 1 1.5 2 2.5 3
MG5/Data
0.6 0.8 1 1.2
1.4 ( ) Stat (and syst) uncert
) μ , 2 (j φ Δ
0.5 1 1.5 2 2.5 3
Theory/Data 0.6 0.8 1 1.2
1.4 Stat and syst uncert
) μ , 2 (j φ Δ
0 0.5 1 1.5 2 2.5 3
SHERPA2/Data 0.6 0.8 1 1.2
1.4 Stat uncert
) μ , 3 (j φ Δ
0.5 1 1.5 2 2.5 3
) [pb]
μ ,3 (j φΔ / d σ d 10 Data
4j LO + PS) ≤ MG5 + PY6 (
2j NLO + PS) ≤ MG5_aMC + PY8 ( BLACKHAT + SHERPA (NLO)
2j NLO 3,4j LO + PS) ≤
SHERPA2 (
CMS 19.6 fb-1 (8 TeV)
(R = 0.5) Jets T
anti-k
| < 2.4 jet η
> 30 GeV, | jet T p 3jets ≥ ) + ν μ → W ( ) μ , 3 (j φ Δ
0.5 1 1.5 2 2.5 3
MG5/Data
0.6 0.8 1 1.2
1.4 ( ) Stat (and syst) uncert
) μ , 3 (j φ Δ
0.5 1 1.5 2 2.5 3
Theory/Data 0.6 0.8 1 1.2
1.4 Stat and syst uncert
) μ , 3 (j φ Δ
0 0.5 1 1.5 2 2.5 3
SHERPA2/Data 0.6 0.8 1 1.2
1.4 Stat uncert
) μ , 4 (j φ Δ
0.5 1 1.5 2 2.5 3
) [pb]
μ ,4 (j φΔ / d σ d 1 Data
4j LO + PS) ≤ MG5 + PY6 (
2j NLO + PS) ≤ MG5_aMC + PY8 ( BLACKHAT + SHERPA (NLO)
2j NLO 3,4j LO + PS) ≤
SHERPA2 (
CMS 19.6 fb-1 (8 TeV)
(R = 0.5) Jets T
anti-k
| < 2.4 jet η
> 30 GeV, | jet T p 4jets ≥ ) + ν μ → W ( ) μ , 4 (j φ Δ
0.5 1 1.5 2 2.5 3
MG5/Data
0.6 0.8 1 1.2
1.4 ( ) Stat (and syst) uncert
) μ , 4 (j φ Δ
0.5 1 1.5 2 2.5 3
Theory/Data 0.6 0.8 1 1.2
1.4 Stat and syst uncert
) μ , 4 (j φ Δ
0 0.5 1 1.5 2 2.5 3
SHERPA2/Data 0.6 0.8 1 1.2
1.4 Stat uncert
FIG. 14. Cross sections differential inΔϕðjn;μÞfor inclusive jet multiplicitiesn¼1–4, compared to the predictions of MADGRAPH,
MADGRAPH5_aMC@NLO,SHERPA 2, and BLACKHATþSHERPA (corrected for hadronization and multiple-parton interactions). Black