VOLUME 21 ISSUE 28 MAY 2017 ISSN 1366-5278
Clinical effectiveness and cost-effectiveness results
from the randomised, Phase IIB trial in previously
untreated patients with chronic lymphocytic
leukaemia to compare fludarabine, cyclophosphamide
and rituximab with fludarabine, cyclophosphamide,
mitoxantrone and low-dose rituximab: the Attenuated
dose Rituximab with ChemoTherapy In Chronic
lymphocytic leukaemia (ARCTIC) trial
results from the randomised, Phase IIB trial
in previously untreated patients with
chronic lymphocytic leukaemia to
compare fludarabine, cyclophosphamide
and rituximab with fludarabine,
cyclophosphamide, mitoxantrone and
low-dose rituximab: the Attenuated dose
Rituximab with ChemoTherapy In Chronic
lymphocytic leukaemia (ARCTIC) trial
Dena R Howard,
1
Talha Munir,
2
Lucy McParland,
1
Andy C Rawstron,
3
Anna Chalmers,
1
Walter M Gregory,
1
John L O
’
Dwyer,
4
Alison Smith,
4
Roberta Longo,
4
Abraham Varghese,
2
Alexandra Smith
1
and Peter Hillmen
5
*
1
Clinical Trials Research Unit, Leeds Institute of Clinical Trials Research,
University of Leeds, Leeds, UK
2
Department of Haematology, St James
’
s University Hospital, Leeds, UK
3
Haematological Malignancy Diagnostic Service, St James
’
s University Hospital,
Leeds, UK
4
Academic Unit of Health Economics, Leeds Institute of Health Sciences,
University of Leeds, Leeds, UK
5
Section of Experimental Haematology, Leeds Institute of Cancer and
Pathology (LICAP), University of Leeds, Leeds, UK
*Corresponding author
Declared competing interests of authors:Dr Rawstron reports personal fees from Roche, personal fees from Biogen Idec, personal fees from Gilead, personal fees from Abbvie, personal fees and non-financial support from BD Biosciences, personal fees from Celgene and personal fees from GlaxoSmithKline, outside the submitted work. Professor Gregory reports personal fees from Janssen and personal fees from Celgene, outside the submitted work. Professor Hillmen received research funding and speakers’fees from Roche Pharmaceuticals and grants and personal fees from GlaxoSmithKline, outside the submitted work.
Howard DR, Munir T, McParland L, Rawstron AC, Chalmers A, Gregory WM,et al. Clinical effectiveness and cost-effectiveness results from the randomised, Phase IIB trial in previously untreated patients with chronic lymphocytic leukaemia to compare fludarabine, cyclophosphamide and rituximab with fludarabine, cyclophosphamide, mitoxantrone and low-dose rituximab: the Attenuated dose Rituximab with ChemoTherapy In Chronic lymphocytic leukaemia (ARCTIC) trial.Health Technol Assess 2017;21(28).
ISSN 1366-5278 (Print)
ISSN 2046-4924 (Online)
Impact factor: 4.058
Health Technology Assessmentis indexed in MEDLINE, CINAHL, EMBASE, The Cochrane Library and the ISI Science Citation Index.
This journal is a member of and subscribes to the principles of the Committee on Publication Ethics (COPE) (www.publicationethics.org/).
Editorial contact: journals.library@nihr.ac.uk
The full HTA archive is freely available to view online at www.journalslibrary.nihr.ac.uk/hta. Print-on-demand copies can be purchased from the report pages of the NIHR Journals Library website: www.journalslibrary.nihr.ac.uk
Criteria for inclusion in theHealth Technology Assessmentjournal
Reports are published inHealth Technology Assessment(HTA) if (1) they have resulted from work for the HTA programme, and (2) they are of a sufficiently high scientific quality as assessed by the reviewers and editors.
Reviews inHealth Technology Assessmentare termed‘systematic’when the account of the search appraisal and synthesis methods (to minimise biases and random errors) would, in theory, permit the replication of the review by others.
HTA programme
The HTA programme, part of the National Institute for Health Research (NIHR), was set up in 1993. It produces high-quality research information on the effectiveness, costs and broader impact of health technologies for those who use, manage and provide care in the NHS. ‘Health technologies’are broadly defined as all interventions used to promote health, prevent and treat disease, and improve rehabilitation and long-term care.
The journal is indexed in NHS Evidence via its abstracts included in MEDLINE and its Technology Assessment Reports inform National Institute for Health and Care Excellence (NICE) guidance. HTA research is also an important source of evidence for National Screening Committee (NSC) policy decisions.
For more information about the HTA programme please visit the website: http://www.nets.nihr.ac.uk/programmes/hta
This report
The research reported in this issue of the journal was funded by the HTA programme as project number 07/01/38. The contractual start date was in January 2009. The draft report began editorial review in January 2015 and was accepted for publication in June 2015. The authors have been wholly responsible for all data collection, analysis and interpretation, and for writing up their work. The HTA editors and publisher have tried to ensure the accuracy of the authors’report and would like to thank the reviewers for their constructive comments on the draft document. However, they do not accept liability for damages or losses arising from material published in this report.
This report presents independent research funded by the National Institute for Health Research (NIHR). The views and opinions expressed by authors in this publication are those of the authors and do not necessarily reflect those of the NHS, the NIHR, NETSCC, the HTA programme or the Department of Health. If there are verbatim quotations included in this publication the views and opinions expressed by the
interviewees are those of the interviewees and do not necessarily reflect those of the authors, those of the NHS, the NIHR, NETSCC, the HTA programme or the Department of Health.
© Queen’s Printer and Controller of HMSO 2017. This work was produced by Howardet al.under the terms of a commissioning contract issued by the Secretary of State for Health. This issue may be freely reproduced for the purposes of private research and study and extracts (or indeed, the full report) may be included in professional journals provided that suitable acknowledgement is made and the reproduction is not associated with any form of advertising. Applications for commercial reproduction should be addressed to: NIHR Journals Library, National Institute for Health Research, Evaluation, Trials and Studies Coordinating Centre, Alpha House, University of Southampton Science Park, Southampton SO16 7NS, UK.
Editor-in-Chief
Health Technology Assessment
NIHR Journals Library
Professor Tom Walley Director, NIHR Evaluation, Trials and Studies and Director of the EME Programme, UK
NIHR Journals Library Editors
Professor Ken Stein Chair of HTA Editorial Board and Professor of Public Health, University of Exeter Medical
School, UK
Professor Andree Le May Chair of NIHR Journals Library Editorial Group (EME, HS&DR, PGfAR, PHR journals)
Dr Martin Ashton-Key Consultant in Public Health Medicine/Consultant Advisor, NETSCC, UK
Professor Matthias Beck Chair in Public Sector Management and Subject Leader (Management Group),
Queen’s University Management School, Queen’s University Belfast, UK
Dr Tessa Crilly Director, Crystal Blue Consulting Ltd, UK
Professor William McGuire Professor of Child Health, Hull York Medical School, University of York, UK
Professor John Norrie Chair in Medical Statistics, University of Edinburgh, UK
Professor John Powell Consultant Clinical Adviser, National Institute for Health and Care Excellence (NICE), UK
Professor James Raftery Professor of Health Technology Assessment, Wessex Institute, Faculty of Medicine,
University of Southampton, UK
Dr Rob Riemsma Reviews Manager, Kleijnen Systematic Reviews Ltd, UK
Professor Helen Roberts Professor of Child Health Research, UCL Institute of Child Health, UK
Professor Helen Snooks Professor of Health Services Research, Institute of Life Science, College of Medicine,
Swansea University, UK
Professor Jim Thornton Professor of Obstetrics and Gynaecology, Faculty of Medicine and Health Sciences,
University of Nottingham, UK
Please visit the website for a list of members of the NIHR Journals Library Board: www.journalslibrary.nihr.ac.uk/about/editors
Editorial contact: journals.library@nihr.ac.uk
Editor-in-Chief
Professor Hywel Williams Director, HTA Programme, UK and Foundation Professor and Co-Director of the
Centre of Evidence-Based Dermatology, University of Nottingham, UK
Professor Jonathan Ross Professor of Sexual Health and HIV, University Hospital Birmingham, UK
Dr Eugenia Cronin Senior Scientific Advisor, Wessex Institute, UK
Professor Martin Underwood Director, Warwick Clinical Trials Unit, Warwick Medical School,
University of Warwick, UK
Professor Geoffrey Meads Professor of Health Sciences Research, Health and Wellbeing Research Group,
University of Winchester, UK
Ms Tara Lamont Scientific Advisor, NETSCC, UK
Dr Catriona McDaid Senior Research Fellow, York Trials Unit, Department of Health Sciences,
University of York, UK
Abstract
Clinical effectiveness and cost-effectiveness results from the
randomised, Phase IIB trial in previously untreated patients
with chronic lymphocytic leukaemia to compare fludarabine,
cyclophosphamide and rituximab with fludarabine,
cyclophosphamide, mitoxantrone and low-dose rituximab:
the Attenuated dose Rituximab with ChemoTherapy In
Chronic lymphocytic leukaemia (ARCTIC) trial
Dena R Howard,
1Talha Munir,
2Lucy McParland,
1Andy C Rawstron,
3Anna Chalmers,
1Walter M Gregory,
1John L O
’
Dwyer,
4Alison Smith,
4Roberta Longo,
4Abraham Varghese,
2Alexandra Smith
1and Peter Hillmen
5*
1Clinical Trials Research Unit, Leeds Institute of Clinical Trials Research, University of Leeds,
Leeds, UK
2Department of Haematology, St James’s University Hospital, Leeds, UK
3Haematological Malignancy Diagnostic Service, St James’s University Hospital, Leeds, UK 4Academic Unit of Health Economics, Leeds Institute of Health Sciences, University of Leeds,
Leeds, UK
5Section of Experimental Haematology, Leeds Institute of Cancer and Pathology (LICAP),
University of Leeds, Leeds, UK
*Corresponding author Peter.Hillmen@nhs.net
Background:The conventional frontline therapy for fit patients with chronic lymphocytic leukaemia (CLL) is fludarabine, cyclophosphamide and rituximab (FCR). Rituximab (Mabthera®, Roche Products Ltd) targets the CD20 antigen, which is expressed at low levels in CLL. The standard dose of rituximab in CLL
(375 mg/m2in cycle 1 and 500 mg/m2in cycles 2–6) was selected based on toxicity data only. Small doses of rituximab (as low as 20 mg) have biological activity in CLL, with an immediate reduction in circulating CLL cells and down-regulation of CD20. Phase II trials had suggested improved efficacy with the addition of mitoxantrone to FCR. The key assumption for the Attenuated dose Rituximab with ChemoTherapy In CLL (ARCTIC) trial was that the addition of mitoxantrone to fludarabine, cyclophosphamide and low-dose rituximab would be more effective than conventional FCR.
Objectives:To assess whether fludarabine, cyclophosphamide, mitoxantrone and low-dose rituximab (FCM-miniR) (100 mg of rituximab per cycle) was non-inferior to FCR in frontline CLL. Complete response (CR) rate was the primary end point, with the secondary end points being progression-free survival (PFS), overall survival (OS), overall response rate, eradication of minimal residual disease (MRD), safety and cost-effectiveness.
randomised to FCR or FCM-miniR. There was an independent Data Monitoring and Ethics Committee (DMEC) with a pre-planned interim efficacy assessment on 103 participants.
Results:The DMEC’s interim analysis led to early trial closure. Although the response rates in both arms were higher than anticipated, FCM-miniR had a lower CR rate than FCR. This was partly attributable to the higher toxicity associated with mitoxantrone. A total of 100 participants completed FCR, 79 completed FCM-miniR and 21 commenced FCM-miniR but switched to FCR following DMEC recommendations. The CR rate for participants receiving FCR was 76%, compared with 55% for FCM-miniR (adjusted odds ratio 0.37; 95% confidence interval 0.19 to 0.73). Key secondary end points also showed that FCR was superior, with more participants achieving MRD negativity (57% for FCR vs. 46% for FCM-miniR). More participants experienced a serious adverse reaction with FCM-miniR compared with FCR (50% vs. 41%). At a median of 37.3 months’ follow-up, the PFS and OS rates are good compared with previous studies, with no significant difference between the treatment arms. The economic analysis indicates that because FCM-miniR is less effective than FCR, FCM-miniR is not expected to be cost-effective over a lifetime horizon, producing a mean cost-saving of –£7723, a quality-adjusted life-year loss of–0.73 and a resulting incremental net monetary loss of–£6780.
Conclusions:FCM-miniR is less well tolerated, with poorer response rates, than FCR, partly owing to the additional toxicity associated with mitoxantrone. In view of this, FCM-miniR will not be taken forward into a larger definitive Phase III trial. The trial demonstrated that oral FCR yields extremely high response rates compared with historical series with intravenous chemotherapy.
Future work:We shall compare the results of ARCTIC with those of the ADMIRE (Does the ADdition of Mitoxantrone Improve Response to FCR chemotherapy in patients with CLL?) trial, which compared FCR with FCM-R to assess the efficacy of low- versus standard-dose rituximab, allowing for the toxicity associated with mitoxantrone.
Trial registration:Current Controlled Trials ISRCTN16544962.
Funding:This project was funded by the NIHR Health Technology Assessment programme and will be published in full inHealth Technology Assessment; Vol. 21, No. 28. See the NIHR Journals Library website for further project information.
ABSTRACT
NIHR Journals Library www.journalslibrary.nihr.ac.uk
Contents
List of tables xiii
List of figures xix
List of abbreviations xxi
Plain English summary xxiii
Scientific summary xxv
Chapter 1Introduction 1
Scientific background 1
Standard therapy for chronic lymphocytic leukaemia 1
Rituximab dose 1
Addition of mitoxantrone 2
Rationale for design 3
Chapter 2Methods 5
Aims and objectives 5
Trial design 5
Patient and public involvement 5
Participants 6
Inclusion criteria 6
Exclusion criteria 6
Recruitment procedure 7
Randomisation 7
Informed consent 7
Interventions 8
Routine concomitant medications 8
Dose delays and reductions 9
Rituximab-related infusion reactions 9
Impaired renal function 9
Neutropenia 9
Other haematological toxicities 9
Data collection and management 9
Safety monitoring 9
Outcome measures 10
Primary outcome measure 10
Secondary outcome measures 10
Independent primary end point review 11
Sample size 11
Statistical analysis 11
Analysis populations 11
Missing data handling 12
Frequency of analyses 12
Interim analysis 13
Secondary end point analyses 13
Subgroup analyses 14
Economic evaluation 14
Measurement of outcomes 14
Measurement of costs 15
Missing data 15
Within-trial analysis 15
Decision economic model analysis 17
Sensitivity analyses 20
Value of information analysis 20
Summary of changes to the protocol 21
Chapter 3Statistical trial results 23
Recruitment 23
Early closure to recruitment 23
Interim analysis recommendations 25
Participant flow 25
Baseline characteristics 28
Treatment received 31
Interim analysis 34
Treatment received 34
Efficacy 35
Safety and toxicity 37
Conclusions from the Data Monitoring and Ethics Committee 38
Final analysis: primary end point 38
Central assessment of response by International Workshop on chronic lymphocytic leukaemia 38
Numbers analysed and reasons for non-inclusion in the intention-to-treat population 39
Formal analysis of the primary end point 41
Sensitivity analyses 42
Subgroup analyses 44
Secondary end points 46
Overall response rate 46
Minimal residual disease 47
Progression-free survival 49
Overall survival 51
Time to minimal residual disease relapse 53
Subgroup analyses 53
Safety and toxicity 67
Serious adverse events 67
Adverse events 71
Treatment-related mortalities within 3 months of ending protocol treatment 72
Secondary cancers 72
Summary of statistical results 73
Chapter 4Economic evaluation 77
Unit cost data 77
Unit cost of resource use 77
Unit cost of medications 78
Treatment costs 78
Utility and quality-adjusted life-years 79
Missing data 79
CONTENTS
NIHR Journals Library www.journalslibrary.nihr.ac.uk
Within-trial cost-effectiveness analysis 79
Cost-effectiveness results: base case 79
Health-care resource use 79
Health outcomes 79
Cost-effectiveness results within the NHS and Personal Social Services perspectives 81
Sensitivity analyses within trial in the NHS and Personal Social Services perspective 82
Summary of within-trial cost-effectiveness analysis 84
Lifetime cost-effectiveness analysis 85
Base-case model results 85
Sensitivity analyses 87
Value of information analysis 89
Predicted overall survival 90
Summary of decision model lifetime cost-effectiveness analysis 91
Summary of the economic evaluation 91
Chapter 5Discussion 93
Interpretation 93
Economic evaluation discussion 94
Summary 95
Generalisability 95
Overall evidence 96
Chapter 6Conclusions 97
Implications for health care 97
Recommendations for research 97
Acknowledgements 99
References 105
Appendix 1Serious adverse event listings 109
Appendix 2Adverse event listings 199
Appendix 3Baseline patient health economics questionnaire booklet 337
Appendix 4Follow-up patient health economics questionnaire booklet 345
List of tables
TABLE 1 Fludarabine, cyclophosphamide and rituximab 8
TABLE 2 Fludarabine, cyclophosphamide, mitoxantrone and low-dose rituximab 8
TABLE 3 Model input parameters 19
TABLE 4 Recruitment per centre and by allocated treatment arm 24
TABLE 5 Participant withdrawals 27
TABLE 6 Minimisation factors (all participants) 28
TABLE 7 Baseline participant characteristics (all participants) 29
TABLE 8 Baseline assessment of disease (all participants) 29
TABLE 9 Baseline clinical assessments (all participants) 30
TABLE 10 Baseline genetic markers (all participants) 31
TABLE 11 Treatment details (all participants) 32
TABLE 12 Early discontinuation of protocol treatment (all participants) 32
TABLE 13 Treatment modifications (all participants) 33
TABLE 14 Granulocyte colony-stimulating factor usage during treatment
(all participants) 33
TABLE 15 Granulocyte colony-stimulating factor usage by number of treatment
cycles received 34
TABLE 16 Treatment details (interim analysis population) 34
TABLE 17 Treatment modifications (interim analysis population) 35
TABLE 18 Exclusions from the interim analysis of the primary end point
(interim analysis population) 35
TABLE 19 Proportion of participants achieving a CR/CRi at 3 months post
treatment (ITT population) 36
TABLE 20 Multivariate logistic regression analysis for the proportion of
participants achieving a CR or CRi at 3 months post treatment, adjusted for the
minimisation factors (ITT population) 36
TABLE 21 Proportion of participants achieving MRD negativity at 3 months post
TABLE 22 Number of participants experiencing an SAE and total number of SAEs
reported (interim analysis population) 37
TABLE 23 Suspected relationship with experimental treatment (interim analysis
population) 37
TABLE 24 Number of participants with a centrally reviewed assessment of
response (IWCLL) (all participants) 38
TABLE 25 Number of participants included in the ITT analysis, and reasons for
exclusion (all participants) 39
TABLE 26 Comparison of the baseline characteristics for the ITT population and
participant exclusions 40
TABLE 27 Proportion of participants achieving a CR or CRi at 3 months post
treatment (ITT population) 41
TABLE 28 Multivariate logistic regression analysis for the proportion of
participants achieving a CR or CRi at 3 months post treatment, adjusted for the
minimisation factors (ITT population) 41
TABLE 29 Multivariate logistic regression analysis for the proportion of
participants achieving a CR or CRi at 3 months post treatment, adjusted for the
minimisation factors (PP population) 42
TABLE 30 Multivariate logistic regression analysis for the proportion of
participants achieving a CR or CRi at 3 months post treatment, adjusted for the
minimisation factors (sensitivity analysis 1) 42
TABLE 31 Multivariate logistic regression analysis for the proportion of
participants achieving a CR or CRi at 3 months post treatment, adjusted for the
minimisation factors (sensitivity analysis 2) 43
TABLE 32 Multivariate logistic regression analysis for the proportion of
participants achieving a CR or CRi at 3 months post treatment, adjusted for the
minimisation factors (sensitivity analysis 3) 43
TABLE 33 Minimisation factors by achievement of the primary end point
(ITT population) 44
TABLE 34 Baseline clinical details by achievement of the primary end point
(ITT population) 44
TABLE 35 Treatment cycles received by achievement of the primary end point
(ITT population) 45
TABLE 36 Baseline genetic markers by achievement of the primary end point
(ITT population) 45
TABLE 37 Overall response rate at 3 months post treatment 46
LIST OF TABLES
NIHR Journals Library www.journalslibrary.nihr.ac.uk
TABLE 38 Difference in the proportion of participants achieving an overall
response at 3 months post treatment 46
TABLE 39 International Workshop on Chronic Lymphocytic Leukaemia response
assessment at 3 months post treatment (all randomised participants) 47
TABLE 40 Proportion of participants with an MRD assessment at 3 months post
treatment (all randomised participants) 48
TABLE 41 Proportion of participants achieving MRD negativity at 3 months
post treatment 48
TABLE 42 Difference in the proportion of participants with undetectable MRD at
3 months post treatment 48
TABLE 43 Multivariate logistic regression analysis for the proportion of participants with undetectable MRD at 3 months post treatment, adjusted for
the minimisation factors 49
TABLE 44 Proportion of participants with PD (all randomised participants) 49
TABLE 45 Median time to progression and comparison between the treatment arms 50
TABLE 46 Cox’s proportional hazards model for the time to progression adjusted
for the minimisation factors 50
TABLE 47 Proportion of participants who have died and primary cause of death 51
TABLE 48 Median time to death and comparison between treatment arms 52
TABLE 49 Cox’s proportional hazards model for OS adjusted for the
minimisation factors 52
TABLE 50 Total number of SAEs reported overall and per participant
(safety population) 68
TABLE 51 Relationship with experimental treatment (safety population) 68
TABLE 52 Seriousness criteria and outcome of each SAE (safety population) 69
TABLE 53 Seriousness criteria and outcome of each SAR (safety population) 70
TABLE 54 Total number of participants requiring hospitalisation for an SAE
(safety population) 70
TABLE 55 Duration of SAEs and SARs (safety population) 70
TABLE 56 MedDRA system organ class for SAEs suspected to be related to trial
treatment (SARs) (safety population) 71
TABLE 57 Total number of AEs reported overall and per participant
TABLE 58 Treatment cycle where an AE first occurred (safety population) 72
TABLE 59 Maximum CTCAE grade (safety population) 72
TABLE 60 Incidence and type of secondary cancer 73
TABLE 61 Further detail on type of secondary cancer 73
TABLE 62 Timing of secondary cancer 74
TABLE 63 Summary of participant-reported health-care use and associated unit costs 77
TABLE 64 Summary of participant-reported medication use and associated unit costs 78
TABLE 65 Costs of administering the drug 78
TABLE 66 Costs of resources used in relation to CLL by treatment arms
(not imputed) during therapy 80
TABLE 67 Costs of resources used in relation to CLL by treatment arms
(not imputed) from end of therapy to 24 months 80
TABLE 68 European Quality of Life-5 Dimensions index scores at the baseline
and follow-ups, and QALYs of CLL participants by treatment arm (imputed data) 80
TABLE 69 Total costs and QALYs (EQ-5D) by treatment arm (NHS and PSS
perspectives, deterministic) 81
TABLE 70 Cost-effectiveness results (NHS and PSS perspectives, probabilistic) 81
TABLE 71 Short Form questionnaire-6 Dimensions index scores at baseline and
follow-ups, and QALYs of CLL participants by treatment arm (imputed data) 83
TABLE 72 Cost-effectiveness results (NHS and PSS perspectives, deterministic) 83
TABLE 73 Analyses accounting for interim change 84
TABLE 74 Deterministic model lifetime cost-effectiveness results 85
TABLE 75 Probabilistic model lifetime cost-effectiveness results 85
TABLE 76 Model sensitivity analysis using ITT population 88
TABLE 77 Model sensitivity analysis using QALYs derived from the SF-12 form 88
TABLE 78 Sensitivity analysis extending observed differential rate of progression
in trial over different time horizons (deterministic results) 89
TABLE 79 Serious adverse events suspected to be related to trial treatment
(SAE description) 110
TABLE 80 Serious adverse events suspected to be related to trial treatment
(details of event) 140
LIST OF TABLES
NIHR Journals Library www.journalslibrary.nihr.ac.uk
TABLE 81 Serious adverse events not suspected to be related to trial treatment
(SAE description) 156
TABLE 82 Serious adverse events not suspected to be related to trial treatment
(SAE description) 185
TABLE 83 Serious adverse events not suspected to be related to trial treatment
(details of event) 194
TABLE 84 Adverse events in participants receiving FCR 200
TABLE 85 Adverse events in participants receiving FCM-miniR 266
List of figures
FIGURE 1 Three-state Markov model 17
FIGURE 2 Progression-free survival in the FCR arm 18
FIGURE 3 Cumulative and monthly recruitment 23
FIGURE 4 Consolidated Standards of Reporting Trials diagram 26
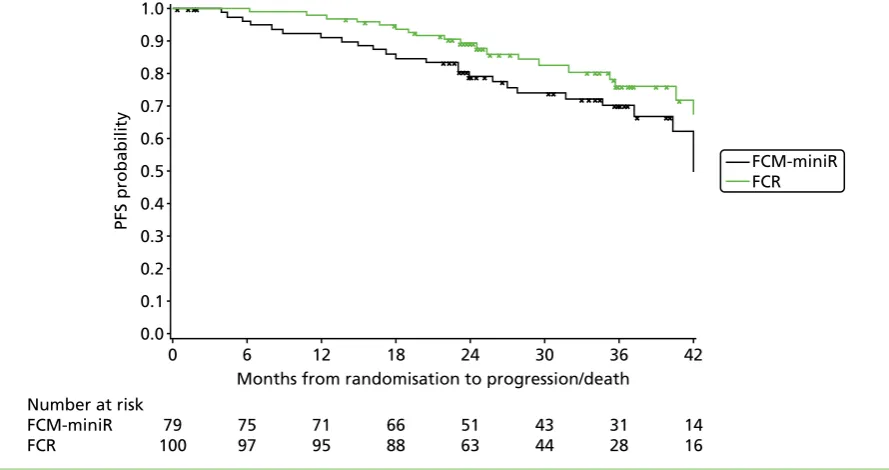
FIGURE 5 Kaplan–Meier plot of time to progression by randomisation allocation 50
FIGURE 6 Kaplan–Meier plot of OS by randomisation allocation 51
FIGURE 7 Kaplan–Meier plot of time to progression by MRD status at 3 months
post treatment 53
FIGURE 8 Kaplan–Meier plot of time to progression by randomisation allocation
and MRD status at 3 months post treatment 54
FIGURE 9 Kaplan–Meier plot of time to progression by CR status at 3 months
post treatment 55
FIGURE 10 Kaplan–Meier plot of time to progression by randomisation
allocation and CR status at 3 months post treatment 55
FIGURE 11 Kaplan–Meier plot of OS by MRD status at 3 months post treatment 56
FIGURE 12 Kaplan–Meier plot of OS by randomisation allocation and MRD status
at 3 months post treatment 56
FIGURE 13 Kaplan–Meier plot of OS by CR status at 3 months post treatment 57
FIGURE 14 Kaplan–Meier plot of OS by randomisation allocation and response
status at 3 months post treatment 58
FIGURE 15 Kaplan–Meier plot of time to progression by sex 58
FIGURE 16 Kaplan–Meier plot of OS by sex 59
FIGURE 17 Kaplan–Meier plot of time to progression by age group 59
FIGURE 18 Kaplan–Meier plot of OS by age group 60
FIGURE 19 Kaplan–Meier plot of time to progression by Binet stage 61
FIGURE 20 Kaplan–Meier plot of OS by Binet stage 61
FIGURE 21 Kaplan–Meier plot of PFS by number of treatment cycles received 62
FIGURE 23 Kaplan–Meier plot of PFS by GCSF usage 63
FIGURE 24 Kaplan–Meier plot of OS by GCSF usage 64
FIGURE 25 Kaplan–Meier plot of PFS by 11q deletion 64
FIGURE 26 Kaplan–Meier plot of PFS by 11q deletion and treatment group 65
FIGURE 27 Kaplan–Meier plot of OS by 11q deletion and treatment group 65
FIGURE 28 Kaplan–Meier plot of OS by 11q deletion 66
FIGURE 29 Kaplan–Meier plot of PFS by VH mutation risk 66
FIGURE 30 Kaplan–Meier plot of OS by VH mutation risk 67
FIGURE 31 Cost-effectiveness plane showing the incremental costs and QALYs for FCM-miniR compared with FCR from the bootstrap analysis of the within-trial
results over 24 months (EQ-5D, NHS and PSS perspectives) 82
FIGURE 32 Cost-effectiveness acceptability curves at 12 months (NHS and PSS
perspectives, using EQ-5D generated QALYs) 82
FIGURE 33 Cost-effectiveness plane generated from bootstrapped mean cost and
SF-6D-generated QALY differences over 24 months (NHS and PSS perspectives) 84
FIGURE 34 Scatterplot of model lifetime cost-effectiveness results for FCM-miniR
vs. FCR 86
FIGURE 35 Cost-effectiveness acceptability curve for model lifetime analysis 87
FIGURE 36 Tornado plot of one-way deterministic sensitivity analysis results 87
FIGURE 37 Population EVPI 89
FIGURE 38 Population EVPPI for base-case model (£20,000/QALY threshold,
10-year effective lifetime and annual incidence of 2943) 90
FIGURE 39 Overall survival curves simulated from the lifetime decision
analytic model 90
LIST OF FIGURES
NIHR Journals Library www.journalslibrary.nihr.ac.uk
List of abbreviations
β2M β2-microglobulin
AE adverse event
ARCTIC Attenuated dose Rituximab with ChemoTherapy In CLL trial
B-CLL B-cell chronic lymphocytic leukaemia
BNF British National Formulary
BSA body surface area
CEAC cost-effectiveness acceptability curve
CI confidence interval
CLL chronic lymphocytic leukaemia
CR complete remission
CRF case report form
CRi complete remission with incomplete marrow recovery
CTCAE Common Terminology Criteria for Adverse Events
CTRU Clinical Trials Research Unit
DCT direct Coombs test
DMEC Data Monitoring and Ethics Committee
EQ-5D™ European Quality of Life-5 Dimensions
EVPI expected value of perfect information
EVPPI expected value of perfect parameter information
FC fludarabine and cyclophosphamide
FCM fludarabine, cyclophosphamide and mitoxantrone
FCM-miniR fludarabine, cyclophosphamide, mitoxantrone and low-dose rituximab
FCM-R fludarabine, cyclophosphamide, mitoxantrone and rituximab
FCR fludarabine, cyclophosphamide and rituximab
GCLLSG German CLL study group
GCSF granulocyte colony-stimulating factor
HMDS Haematological Malignancy Diagnostic Service
HR hazard ratio
ICER incremental cost-effectiveness ratio
IMP Investigational Medicinal Product
INB incremental net monetary benefit
ITT intention to treat
IWCLL International Workshop on Chronic Lymphocytic Leukaemia
MedDRA Medical Dictionary for Regulatory Activities
MRD minimal residual disease
NB net monetary benefit
NCI National Cancer Institute
NCRI National Cancer Research Institute
NICE National Institute for Health and Care Excellence
NIHR National Institutes of Health Research
OD once daily
OR odds ratio
ORR overall response rate
OS overall survival
PCP Pneumocystis cariniipneumonia
PD progressive disease
PFS progression-free survival
PP per-protocol
PPI patient and public involvement
PSS Personal Social Services
PSSRU Personal Social Services Research Unit
QALY quality-adjusted life-year
RDM Remission Duration Model
REC Research Ethics Committee
SAE serious adverse event
SAR serious adverse reaction
SD standard deviation
SE standard error
SF-12 Short Form questionnaire-12 items
SF-6D Short Form questionnaire-6 Dimensions
SLL small lymphocytic lymphoma
SUSAR suspected unexpected serious adverse reaction
TMG Trial Management Group
TSC Trial Steering Committee
VH heavy-chain variable-region
WHO World Health Organization
WTP willingness to pay LIST OF ABBREVIATIONS
NIHR Journals Library www.journalslibrary.nihr.ac.uk
Plain English summary
What was the problem?
The first treatment that patients with chronic lymphocytic leukaemia (CLL) usually receive is a combination of the drugs fludarabine, cyclophosphamide and rituximab (Mabthera®, Roche Products Ltd) (FCR). However, research suggested that adding a fourth drug called mitoxantrone to FCR would improve response rates and that a lower dose of rituximab would work just as well as the standard dose.
What did we do?
We established the Attenuated dose Rituximab with ChemoTherapy In CLL trial to compare fludarabine, cyclophosphamide, mitoxantrone and low-dose rituximab (FCM-miniR) with the standard FCR treatment. The trial recruited 200 participants.
What did we find?
Three months after the end of treatment, participants were assessed to see how well they had responded. Part-way through the trial we looked at how half of the participants had responded and we found that participants who had received FCR had better response rates and fewer side effects than participants who had received FCM-miniR. The trial was, therefore, closed early and participants who were still receiving FCM-miniR were offered the chance to have FCR instead.
Follow-up assessments are ongoing but, to date, disease progression and overall survival data are good for all participants compared with previous studies.
What does this mean?
Scientific summary
Background
The conventional therapy for patients with chronic lymphocytic leukaemia (CLL) who require therapy and are considered fit for fludarabine-based treatment is the combination of fludarabine, cyclophosphamide and rituximab (FCR) (Mabthera®, Roche Products Ltd). Rituximab is a monoclonal antibody targeting the CD20 antigen, which is expressed on B-cells (both normal and malignant). CD20 is characteristically expressed at a low level in CLL. The standard dose of rituximab used in FCR for CLL (375 mg/m2in cycle 1 and 500 mg/m2in cycles 2–6) was selected based on the dose approved as a single agent in follicular lymphoma. The problem with identifying the dose of rituximab, as with many other monoclonal
antibodies, is that the maximum tolerated dose is not reached in Phase I trials owing to the specificity of this type of targeted therapy. In effect, the maximum tolerated dose is governed by the volume that can be infused rather than the toxicity of the molecule. The standard dose of rituximab as a single agent in follicular lymphoma of four weekly doses of 375 mg/m2was selected pragmatically depending on the amount of available rituximab and the number of patients required in the original follicular lymphoma trial. The same dose was then used when rituximab was combined with various different chemotherapy regimes in lymphoma, with no further Phase I data to define this more accurately. The dose upon which the CLL dose was derived was 375 mg/m2but, as the expression of CD20 in CLL is characteristically lower than in the other B-cell malignancies and in normal B-cells, the rituximab dose per cycle of chemotherapy in CLL was arbitrarily increased to 500 mg/m2. When higher doses of rituximab [three doses of 500 mg/m2per cycle of fludarabine and cyclophosphamide (FC) compared with a single dose, which is conventional; so-called FCR3] were used in combination with fludarabine plus cyclophosphamide in a small Phase II trial, there was no evidence that the responses were any higher. However, there is good evidence that small doses of rituximab have biological activity in CLL. Even small doses of rituximab, as low as 20 mg, lead to an immediate reduction in circulating CLL cells by the end of the infusion. This is associated with a marked reduction in the expression of CD20 on the CLL cells, which becomes apparent during the infusion. If a similar, or larger, dose of rituximab is then given on the following day there is often no further evidence of a fall in lymphocyte count owing to the lack of CD20 antigen expression on the CLL cells. There is
evidence that this reduction in CD20 expression may be attributable to the‘shaving’of CD20 from the CLL cell. The idea behind the mechanism for CD20 shaving is that, initially, cells coated in rituximab are
removed by the reticuloendothelial system, but given the large number of CLL cells, this mechanism is rapidly saturated. At this point, the rituximab bound to the CLL cells coalesces and these aggregates are removed by the reticuloendothelial system, a process called trogocytosis. Therefore, bound and unbound CD20 antigens are removed from the CLL cells, making them non-responsive to further doses of rituximab. A possible consequence of this would be that higher doses of rituximab would remain in the plasma and as soon as any CD20 antigen returns, the same mechanism of shaving would apply until the free rituximab was exhausted or excreted. At this point, CD20 expression would return, allowing further doses of
rituximab to be effective. If the above is true then giving ever-increasing doses of rituximab would not be effective and, in fact, lower doses that had biological activity but did not lead to high free plasma levels might allow the more rapid return of the CD20 antigen, thereby enabling subsequent doses of rituximab to have biological activity again. This would suggest that repeated lower doses of rituximab may be equally, or even more, effective, particularly when there is a large amount of tumour antigen present (at the initiation of therapy). The cost of rituximab constitutes approximately 80% of the acquisition costs of FCR, and the infusions last several hours, creating logistic problems for both patients and hospitals. If the dose of rituximab were to be reduced by several fold, then both of these issues would be ameliorated.
There were two key assumptions in the design of the Attenuated dose Rituximab with ChemoTherapy In CLL (ARCTIC) trial. First, it was assumed that the efficacy of a low dose of rituximab [100 mg (i.e. one vial)] was comparable to the conventional dose (500 mg/m2) when combined with combination chemotherapy in CLL. Second, it was assumed that the addition of mitoxantrone to FC would increase the response rates and be tolerable. Mitoxantrone was, therefore, added to the chemotherapy backbone of FC in order to allow for the possibility that low-dose rituximab might be inferior to the conventional dose. It would then follow that FCM-miniR should be at least non-inferior and, therefore, cost-effective when compared with FCR.
Objectives
The objective of the ARCTIC trial was to assess whether the combination of fludarabine, cyclophosphamide and mitoxantrone with a low dose of rituximab (FCM-miniR; 100 mg per cycle) was non-inferior to the conventional FCR therapy in patients with CLL requiring therapy for the first time. This included the complete remission (CR) rate as the primary end point, with important secondary end points including progression-free survival (PFS), overall survival (OS), overall response rate (ORR), eradication of minimal residual disease (MRD) following treatment, safety and toxicity, and cost-effectiveness. The objective was to use the results of ARCTIC, assuming they were positive, to help design a larger, definitive, Phase III trial.
Methods
The ARCTIC trial was a multicentre, randomised, controlled, open, Phase IIB non-inferiority trial including patients with previously untreated CLL who required treatment by International Workshop on Chronic Lymphocytic Leukaemia (IWCLL) criteria. Patients were randomised on a 1 : 1 basis to receive FCR or FCM-miniR. The intention was to include 206 patients from hospitals around the UK. The trial was monitored by an independent Data Monitoring and Ethics Committee (DMEC) and a Trial Steering Committee (TSC), and there was a pre-planned interim assessment of efficacy after 103 participants had completed therapy.
Primary end point (response assessment) data were centrally reviewed by an independent panel of CLL clinicians who determined, using IWCLL criteria, whether or not a CR had been achieved. A formal analysis of the primary end point used an adjusted logistic regression model, and time-to-event analyses were performed using adjusted Cox regression analyses. The economic evaluation used a within-trial analysis, in which cost-effectiveness was assessed within the 24-month trial period using individual patient data collected during the trial, and a decision analytic model analysis, in which cost-effectiveness was assessed over a lifetime horizon using standard modelling techniques applied to the trial data in order to extrapolate the trial results.
Results
A total of 200 of the planned 206 patients were entered into the ARCTIC trial between December 2009 and September 2012 from 34 centres across the UK. There were nine withdrawals (4.5%) during the trial, which were balanced across the treatment arms. A total of 141 participants (70.5%) completed the recommended six cycles of treatment, with slightly more in the FCR arm than the FCM-miniR arm (70.0% vs. 64.6%). The majority of participants discontinuing treatment did so because of toxicity. At the DMEC’s pre-planned interim analysis, 82.9% of participants achieved a CR in the FCR arm compared with 61.4% of participants in the FCM-miniR arm. Although the difference between the two arms was not significant (at the adjusted 0.5% level) the experimental treatment had the lower CR rate. As the results were approaching significance in favour of the control group, and there was evidence of additional toxicity in the FCM-miniR arm, the trial was closed early at the recommendation of the DMEC, and participants still
SCIENTIFIC SUMMARY
NIHR Journals Library www.journalslibrary.nihr.ac.uk
receiving FCM-miniR were recommended to transfer to treatment with FCR for the remainder of their treatment cycles.
At the final analysis of the primary end point (at 3 months post treatment) 100 participants had completed FCR, 79 had completed FCM-miniR and 21 had initially received FCM-miniR but crossed over to receive FCR at some point in their treatment following the advice of the DMEC recommendation. A total of 76.1% of participants achieved a CR in the FCR arm compared with 54.7% in the FCM-miniR arm. The difference in proportions (FCM-miniR–FCR) was–21.4% [95% confidence interval (CI)–35.8% to–7.0%] and the adjusted analysis gave an odds ratio of 0.37 for the treatment effect (95% CI 0.19 to 0.73), indicating that participants in the FCM-miniR were significantly less likely to achieve a CR. Therefore, at the final analysis there is very strong evidence that FCM-miniR is not non-inferior to FCR in terms of CR rates at 3 months post treatment, and that it is, in fact, significantly inferior. The analysis of the per-protocol population and the sensitivity analyses support this conclusion.
The ORR was high at 92.6%, with 7.5% fewer participants achieving at least a partial response in the FCM-miniR arm compared with the FCR arm (95% CI–15.6% to 0.6%).
The eradication of MRD in the bone marrow at the end of therapy is a strong predictor of outcome in CLL. At 3 months post treatment, 53% of participants were MRD negative, with a higher percentage of
participants in the FCR arm than the FCM-miniR arm (57.0% vs. 46.4%). The difference in proportions between FCR and FCM-miniR was not statistically significant (χ2=1.97;p=0.160), although it was approaching significance.
There was no significant difference between the treatment arms with respect to PFS, nor was there a significant difference in OS. However, there was a non-significant trend towards the FCM-miniR
participants performing worse in terms of both PFS and OS. At 24 months post randomisation, 89.4% of the FCR participants remained progression-free compared with 79.1% of the FCM-miniR participants. In terms of OS at 24 months, 95.8% of the FCR participants remained alive compared with 88.5% of the FCM-miniR participants.
In the exploratory subgroup analyses, PFS and OS were significantly improved for participants who were MRD negative or who had achieved a CR at 3 months post treatment, or who received more than three cycles of treatment. In addition, of those participants who were MRD positive, OS was worse in participants who received FCM-miniR than in those who received FCR, suggesting that after progression the participants initially treated with FCM-miniR may respond more poorly to, or be too unwell to receive, salvage therapies. Longer follow-up data are required to be able to assess reliably the time-to-event outcomes, and these will be updated in future.
More participants experienced a serious adverse event (SAE) in the FCM-miniR arm compared with the FCR arm (58.2% vs. 49.0%), as well as a serious adverse reaction (49.4% vs. 41.0%). More participants in the FCM-miniR arm were hospitalised for a SAE during the trial (51.9% vs. 46.0%) and six SAEs were deemed to be life-threatening or resulted in death compared with three in the FCR arm. A similar proportion of participants experienced an adverse event (AE) in each treatment arm, but a higher proportion of Common Terminology Criteria for Adverse Events grade 3 and 4 AEs were reported in the FCM-miniR arm (22.4% vs. 15.0%). There were no treatment-related mortalities within 3 months of completing protocol treatment.
(equivalent to 0.27 QALYs), and there was a 100% probability that FCM-miniR is cost-effective. However, the cost-effectiveness of FCM-miniR was not sustained in the long-term analysis. Results of the decision model indicate that over a lifetime horizon, FCM-miniR produces a mean cost saving of £7723 and a mean QALY loss of–0.73. The associated ICER is £10,651, indicating that for every £10,651 saved by adopting FCM-miniR, one QALY would be lost. At a £20,000 per QALY threshold, this leads to a net loss of–£6780 (–0.34 QALYs), with a 19% chance that FCM-miniR is cost-effective.
Conclusions
Participants randomised to FCM-miniR had a significantly lower CR rate than those randomised to FCR (FCM-miniR 55% vs. FCR 76%), indicating that FCR is the more effective treatment. This seemed, at least in part, to be attributable to the higher toxicity associated with the addition of mitoxantrone to FCR. Key secondary end points also indicated that FCR had greater efficacy, with a higher proportion of participants achieving eradication of MRD (57% for FCR compared with 46% for FCM-miniR). The follow-up in the trial is still immature (median 37.3 months from randomisation) but, to date, the PFS and OS are good compared with previous studies and there is no significant difference between the two treatment arms, although there is a possible trend towards FCR patients having improved PFS and OS. The cost-effectiveness analysis indicates that, although FCM-miniR is expected to be cost-effective in the short term, it is unlikely to be cost-effective when taking into account long-term costs and health benefits.
In summary, there is strong evidence to suggest that FCM-miniR is not non-inferior to FCR in terms of CR at 3 months post treatment and that the addition of mitoxantrone adds toxicity to FCR. Although FCM-miniR was found to be cost-effective over the trial period, it is unlikely to be cost-effective in the long term. In view of this, FCM-miniR will not be taken forward into a larger, definitive, Phase III trial.
The trial demonstrated that oral FCR yields extremely high response rates compared with historical series in which the chemotherapy was given intravenously and it remains the gold-standard therapy for CLL in patients considered fit for fludarabine-based therapy.
Trial registration
The trial is registered as ISRCTN16544962.
Funding
Funding for this study was provided by the Health Technology Assessment programme of the National Institute for Health Research.
SCIENTIFIC SUMMARY
NIHR Journals Library www.journalslibrary.nihr.ac.uk
Chapter 1
Introduction
S
ections of this chapter have been reproduced from Howardet al.1with permission.Scientific background
Chronic lymphocytic leukaemia (CLL) is the most common adult leukaemia, affecting approximately 6.9 per 100,000 of the population. The incidence of CLL increases with age and twice as many men are affected as women. CLL results from the clonal proliferation of B-cells and is diagnosed by the pattern of expression of various cell surface antigens on the CLL cells. Patients most commonly present with lymphocytosis, lymphadenopathy, splenomegaly and systemic symptoms, such as fatigue, weight loss and malaise. The clinical course of CLL is highly variable, with a median survival from diagnosis in the region of 7 years. Patients with more advanced disease (Binet stages B, C and stage A progressive) have a significantly worse survival.
Standard therapy for chronic lymphocytic leukaemia
Fludarabine combined with cyclophosphamide is one of the more frequently used combinations of drugs for treating CLL in second and subsequent line use. The MD Anderson Cancer Center reported the use of fludarabine and cyclophosphamide combined with rituximab (Mabthera®, Roche Products Ltd) (FCR) in both previously untreated and refractory CLL.2,3The response rates for FCR are very impressive and compare extremely positively with historical controls treated with fludarabine, either alone or in combination with cyclophosphamide. In previously untreated patients, complete remission was demonstrated in 217/300 (72%) patients, nodular partial remission in 31 (10%), partial remission in 37 (12%), no response in 13 (4%) and early death in 2 (<1%) patients.2The same group also reported their experience with FCR in 284 patients with previously treated CLL.3The estimated median progression-free survival (PFS) was 21 months, with a median overall survival (OS) of 47 months. The median number of prior treatments was two: 67 patients were alkylating agent refractory, 52 were fludarabine refractory and 98 patients had prior rituximab. Using National Cancer Institute (NCI) criteria, 30% of patients achieved a complete remission rate, 14% achieved nodular partial remission and 30% had partial response (PR), giving an overall response rate (ORR) of 74%.
The German CLL Study Group (GCLLSG) completed the German CLL8 trial, which compared FCR with fludarabine and cyclophosphamide (FC) in patients with CLL who had previously been untreated and required therapy according to conventional criteria.4It was reported that 811 patients were entered into the GCLLSG CLL8 trial and randomly assigned to receive either FC or FCR. The ORR was significantly higher in the FCR arm (95%; 370/390 patients) than the FC arm (88%; 328/371) (p=0.001). The
complete response (CR) rate of the FCR arm was 52% compared with 27.0% in the FC arm (p<0.0001). PFS was 65% at 3 years in the FCR arm and 45% in the FC arm (p<0.0001). Updated data showed that at a median follow-up of 5.9 years, the PFS was 38% in the FCR group compared with 27.4% in the FC group (p<0.0001). A total of 69.4% of the patients were alive in the FCR group versus 62.3% in the FC group. The median OS was 86 months in the FC group but the median OS was not reached in the FCR arm (p<0.001).5In 2009, the European Medicines Evaluation Agency granted a product licence for rituximab combined with FC in previously untreated CLL.
Rituximab dose
weekly doses of rituximab (500–2250 mg/m2) in previously untreated patients induced modest ORRs of 43% and 40%, respectively.8–10The combination of intravenous FC along with rituximab at variable dose (375 mg/m2 in cycle 1 and 500 mg/m2in cycles 2–6) was used in the Phase III CLL8 trial, showing an excellent ORR, PFS and OS.5However, the rationale of using higher doses of rituximab has not been formally assessed.
Rituximab binds specifically to the transmembrane antigen CD20, a non-glycosylated phosphoprotein located on pre-B and mature B lymphocytes. The antigen is expressed on>95% of all B-cell non-Hodgkin’s
lymphomas. CD20 is found on both normal and malignant B-cells, but not on haematopoietic stem cells, pro-B-cells, normal plasma cells or other normal tissue. The phenomenon of CD20 shaving on CLL cells with rituximab has been established in CLL. Most of the CLL cells were cleared after 30 mg of rituximab followed by recrudescence of CLL cells which have lost>90% of CD20 expression. These data suggested that low-dose rituximab thrice weekly at much lower doses of 20–60 mg/m2may promote enhanced clearance of CLL cells by preserving CD20 expression.11Subcutaneous rituximab at a dose of 20 mg three times a week resulted in the reduction of CD20 expression on CLL cells, but sufficient expression was maintained during the course of 6–12 weeks in another study.12A combination of low-dose rituximab (20 mg/m2three times a week), alemtuzumab (Lemtrada®, Genzyme Therapeutics) and pentostatin (Nipent®, Hospira UK Ltd) in high-risk CLL showed that this low dose of rituximab is able to opsonise and clear the majority of circulating cells, but the loss of CD20 is less pronounced. There was also evidence of complement activation owing to C3d deposition on CLL cells and natural killer cell activation owing to down-modulation of CD16, up-regulation of CD54 and a decrease in the number of natural killer cells.13Hence, there is considerable evidence that rituximab at doses as low as 20 mg/m2can be effective and can reduce the phenomenon of CD20 shaving, as seen with the higher dosing of rituximab used in CLL.
Rituximab has also been used in lower doses in a variety of autoimmune conditions, such as refractory systemic lupus erythematosus and rheumatoid arthritis, where it is standard to use two intravenous doses of 1000 mg 2 weeks apart.14–17Rituximab at a dose of 100 mg once a week for 4 weeks has been used in autoimmune haemolytic anaemia and immune thrombocytopenic purpura with relative similar efficacy to the standard dose of 375 mg/m2, although there are no randomised controlled trials to compare the two doses.18,19Furthermore, two infusions of 250 mg/m2of rituximab in mixed cryoglobulinaemia are as effective as four infusions of standard-dose rituximab.20
In summary, the dose of rituximab in the treatment of CLL has not been systematically established and there is good evidence to suggest that low-dose rituximab would be effective in combination with chemotherapy.
Addition of mitoxantrone
Mitoxantrone is a synthetic anthracenedione that is structurally similar to doxorubicin and daunorubicin. It was synthesised with the aim of reducing side effects, especially cardiotoxicity. It is indicated, either in combination therapy or as a single agent, in the treatment of acute non-lymphocytic leukaemia, metastatic breast cancer, hepatoma, lymphoma and paediatric sarcoma.
The addition of mitoxantrone to the fludarabine-based therapy has been found to result in high response rates in a variety of indolent lymphoproliferative disorders, including follicular lymphoma21and mantle cell lymphoma.22The combination of fludarabine, cyclophosphamide and mitoxantrone (FCM) has been reported in 60 patients who have relapsed or resistant CLL.23The ORR in this series was of 78% with 30 patients (50%) achieving a complete remission. It was of considerable importance that 10 of the patients in CR had an eradication of detectable minimal residual disease (MRD) by a sensitive four-colour flow cytometric test, and that these patients had a significantly prolonged survival compared with the other patients in this series. In addition, FCM plus rituximab (FCM-R) appears to be a very promising combination in Phase II trials for CLL. The Barcelona group have reported the use of FCM-R in a non-randomised Phase II trial reporting a complete remission rate of 82% and an ORR of 93% in previously untreated CLL.24In this study, 46% of the CR patients had undetectable MRD. The National Cancer Research Institute (NCRI) CLL subgroup has recently completed a randomised Phase II study
INTRODUCTION
NIHR Journals Library www.journalslibrary.nihr.ac.uk
including FCM and FCM-R in previously treated patients with CLL. This study recruited 52 patients, with 26 in each arm, and reported a 65% CR rate for FCM-R compared with a 58% CR rate for FCM, with five and three patients, respectively, achieving eradication of MRD following FCM-R and FCM.25
Rationale for design
As we previously demonstrated that the combination of fludarabine, cyclophosphamide, mitoxantrone and rituximab can be delivered safely25and that there is evidence of synergistic effect in this combination, the aim of this trial was to test the hypothesis that the low dose of rituximab (100 mg per cycle) in combination with FCM would be as effective as the current standard care, which is the combination of FCR. The data from the use of low-dose rituximab suggest that it can result in effective B-cell depletion with relative preservation of CD20 expression on CLL cells, which would be important in terms of maintaining the efficacy of rituximab. The higher dose of rituximab used in CLL is based primarily on the efficacy of the drug as a single agent where higher doses resulted in better ORRs. However, it can be postulated that higher doses are required as a single agent owing to the tumour burden. The combination of chemotherapy with rituximab might not require the higher dose of rituximab as there is effective clearance of tumour load, and preservation of CD20 expression on CLL cells may be important to maintain the efficacy of rituximab.
Based on scientific rationale, another important aspect in the design of the trial was to assess the cost-effectiveness of delivering the combination of FCM and rituximab at a low dose. The total cost of six cycles of rituximab at the current recommended dose in the UK is estimated to be £10,128 for an average body surface area (BSA) of 1.93m2(average BSA in CLL8 trial).17This does not include the hospital cost for delivery of the infusion. The cost of six cycles of rituximab at a standard dose of 100 mg would be £1048. The infusion time to deliver this dose will be considerably lower than the standard dose. It can be suggested that the chances of developing infusion-related reactions requiring hospital admission would be lower at the lower dose of rituximab. The cost of six cycles of mitoxantrone at a dose of 6 mg/m2 intravenously with this combination is estimated to be £600. The cost-effectiveness analysis of comparing the two arms of the trial would be crucial in establishing whether or not the use of a lower dose of rituximab is a reasonable alternative to the standard-arm FCR. Also, the non-inferiority design of the trial helps to ascertain whether lowering the dose of rituximab, and hence reducing the cost of treatment, does not affect the efficacy in terms of CR rates, as well as the longer-term outcomes of PFS and OS.
In summary, the trial answers a critical scientific question of whether or not reducing the dose of rituximab and using a combination of mitoxantrone with oral FC would be as effective as standard care, and
Chapter 2
Methods
S
ections of this chapter have been reproduced from Howardet al.1with permission.Aims and objectives
The aim of the ARCTIC trial was to establish whether the addition of mitoxantrone, with a low dose of rituximab, to fludarabine and cyclophosphamide (i.e. FCM-miniR), is as effective as FCR in terms of response in patients with previously untreated CLL.
The primary objective of the statistical analysis was to compare the CR rates as defined by IWCLL criteria26 in each treatment group, in order to determine whether FCM-miniR was non-inferior to FCR.
The secondary objectives were:
l to assess the rate of eradication of detectable MRD following treatment with FCR or FCM-miniR l to assess the ORR (complete or partial remission defined by IWCLL criteria) between the
treatment groups
l to assess the safety and toxicity of low-dose rituximab and mitoxantrone in combination with FC l to evaluate PFS
l to evaluate OS
l to evaluate time to MRD relapse.
The primary objective of the economic evaluation was to evaluate the incremental cost-effectiveness of treating patients with CLL with FCM-miniR compared with the standard treatment of FCR. Two economic evaluations were undertaken in this phase:
l a within-trial analysis comparing the outcomes and costs up to 24 months’follow-up l a long-term cost-effectiveness analysis modelling outcomes and costs over a lifetime horizon.
The evaluation followed the reference case guidance for technology appraisals set out by the National Institute for Health and Care Excellence (NICE).27
Trial design
The ARCTIC trial is a multicentre, randomised, controlled, open, Phase IIB non-inferiority trial in patients who are newly diagnosed with B-cell chronic lymphocytic leukaemia (B-CLL). Patients were randomised on a 1 : 1 basis to receive one of two trial interventions, FCR or FCM-miniR.
The trial was reviewed and approved by the National Research Ethics Service Leeds (East) Research Ethics Committee (REC) (reference 09/H1306/54) and was registered as an International Standard Randomised Controlled Trial, number ISRCTN16544962. The trial was registered on the European Clinical Trials Database (EudraCT), number 2009–010998–20.
Patient and public involvement
the PPI representatives would provide feedback on the trial during these meetings. There was involvement from a PPI representative on the Trial Steering Committee (TSC) who provided input into the initial production of, and any amendments to, the Participant Information Sheet and other trial documentation intended for use by participants. Through membership of the TSC the PPI representatives also provided input into the design and conduct of the trial through annual meetings. The Plain English summary has been reviewed by a PPI representative who is part of the Trial Management Group (TMG).
Participants
The trial sought to recruit 206 participants with previously untreated CLL from ethically approved hospitals around the UK. Participants had to meet the following eligibility criteria in order to participate in the trial:
Inclusion criteria
l At least 18 years of age.
l B-CLL with a characteristic immunophenotype, including SLL. l Binet’s stage A progressive or B, or stage C.
l Requiring therapy by the IWCLL criteria in that they must have at least one of the following:
¢ evidence of progressive marrow failure as manifested by the development of, or worsening of, anaemia and/or thrombocytopenia
¢ massive (i.e. 6 cm below the left costal margin) or progressive or symptomatic splenomegaly ¢ massive nodes (i.e. 10 cm in longest diameter) or progressive or symptomatic lymphadenopathy ¢ progressive lymphocytosis with an increase of more than 50% over a 2-month period or
lymphocyte doubling time of<6 months as long as the lymphocyte count is over 30 × 109/l ¢ a minimum of any one of the following disease-related symptoms must be present:
¢ unintentional weight loss more than or equal to 10% within the previous 6 months
¢ significant fatigue (i.e. Eastern Cooperative Oncology Group performance status 2 or worse; cannot work or unable to perform usual activities)
¢ fevers of greater than 38.0 °C for 2 or more weeks without other evidence of infection ¢ night sweats for more than 1 month without evidence of infection.
l No prior therapy for CLL.
l World Health Organization (WHO) performance status of 0, 1 or 2. l Able to provide written informed consent.
Exclusion criteria
l Prior therapy for CLL. l Active infection.
l Past history of anaphylaxis following exposure to rat- or mouse-derived complementarity determining region-grafted humanised monoclonal antibodies.
l Pregnancy, lactation or women of child-bearing potential unwilling to use medically approved contraception while receiving treatment and for 12 months after treatment has finished. l Men whose partners are capable of having children but who are not willing to use appropriate
medically approved contraception while receiving treatment and for 12 months after treatment has finished, unless they are surgically sterile.
l Central nervous system involvement with CLL. l Mantle cell lymphoma.
METHODS
NIHR Journals Library www.journalslibrary.nihr.ac.uk
l Symptomatic cardiac failure not controlled by therapy or unstable angina not adequately controlled by current therapy (in patients with a significant cardiac history the left ventricular function should be assessed and patients with severe impairment should be excluded).
l Other severe, concurrent diseases or mental disorders. l Known to be human immunodeficiency virus (HIV)-positive. l Patient has active or prior hepatitis B or C.
l Active secondary malignancy excluding basal cell carcinoma.
l Persisting severe pancytopenia (neutrophils<0.5 × 10⁹/l or platelets<50 × 109/l) or transfusion-dependent anaemia unless attributable to direct marrow infiltration by CLL.
l Active haemolysis (patients with haemolysis controlled with prednisolone at a dose of 10 mg or less per day can be entered into the trial).
l Patients with a creatinine clearance of<30 ml/minute (either measured by or derived from the Cockcroft–Gault formula).
Recruitment procedure
Participants were recruited from multiple research centres around the UK. Research centres were identified via a feasibility assessment to determine the most appropriate centres to participate in the trial. Research centres were required to have obtained ethical and management approvals and undertaken a site initiation meeting with the Clinical Trials Research Unit (CTRU) based at the University of Leeds prior to the start of recruitment into the trial. Potential participants were identified by the clinical team at participating centres and were approached to participate in the trial during standard clinic visits. Each participating centre was required to maintain a log of all patients screened for eligibility and to record reasons for non-randomisation.
Randomisation
Participants who fulfilled the eligibility criteria were randomised on a 1 : 1 basis to receive either FCR or FCM-miniR. A computer-generated minimisation program that incorporated a random element was used to ensure that treatment groups were well-balanced for the following characteristics:
l centre
l Binet staging (A progressive or B, C) l age (≤65 years,>65 years)
l sex (male, female).
Informed consent
A verbal explanation of the trial was provided by the attending medical staff and a Participant Information Sheet and Informed Consent Document was provided for the patient to consider. This included detailed information about the rationale, design and personal implications of the trial. Following information provision, participants had as long as they needed to consider participation (normally a minimum of 24 hours) and were given the opportunity to discuss the study with their family and other health-care professionals before they decided whether they would be willing to take part in the study.
Participants were free to withdraw from the trial at any time. The specific wishes of any participant wanting to withdraw consent for further involvement in the trial, be that from further treatment and/or follow-up data collection, was documented to ensure appropriate processes were followed after withdrawal.
Interventions
Participants were randomised to receive six cycles of either FCR or FCM-miniR according to the regimens outlined below (Tables 1and2).
Cycles of FCR and FCM-miniR were repeated every 28 days for a total of six cycles.
Participants who experienced nausea and vomiting or diarrhoea were given FC via the intravenous route owing to concerns over drug absorption. Intravenous fludarabine was given at a dose of 25 mg/m2/day for 3 days (bioequivalent to 24 mg/m2/day for 5 days given orally) and cyclophosphamide was given at a dose of 250 mg/m2/day for 3 days.
Routine concomitant medications
Participants received prophylaxis againstPneumocystis cariniipneumonia (PCP) with 960 mg of co-trimoxazole bi-daily on Monday/Wednesday/Friday or 480 mg on a daily basis. Participants who were allergic to
co-trimoxazole received an alternative, such as dapsone (Dapsone, Actavis UK Ltd) [100 mg once daily (OD)] or nebulised pentamidine (Pentacavinat, Sanofi) (monthly). PCP prophylaxis continued throughout treatment and for at least 2 months after the last course of treatment. Aciclovir (400 mg bi-daily) was recommended as prophylaxis against herpes virus reactivation for all participants. Allopurinol at a dose of 300 mg/day was recommended for all participants for at least the first 28 days of therapy.
TABLE 1 Fludarabine, cyclophosphamide and rituximab
Drug name Entry route Dosage Number of days
Fludarabine Oral 24 mg/m2/day Days 1–5
Cyclophosphamide Oral 150 mg/m2/day Days 1–5
Rituximab Intravenous 375 mg/m2 Day 1 (Cycle 1)
Rituximab Intravenous 500 mg/m2 Day 1 (Cycles 2–6)
TABLE 2 Fludarabine, cyclophosphamide, mitoxantrone and low-dose rituximab
Drug name Entry route Dosage Number of days
Fludarabine Oral 24 mg/m2/day Days 1–5
Cyclophosphamide Oral 150 mg/m2/day Days 1–5
Mitoxantrone Intravenous 6 mg/m2/day Day 1
Low-dose rituximab Intravenous 100 mg Day 1
METHODS
NIHR Journals Library www.journalslibrary.nihr.ac.uk