UNIVERSITI TEKNIKAL MALAYSIA MELAKA
QUALITY IMPROVEMENT USING FACTORIAL DESIGN
(A CASE STUDY IN MANUFACTURING COMPANY)
This report submitted in accordance with requirement of the Universiti Teknikal Malaysia Melaka (UTeM) for the Bachelor Degree of Manufacturing Engineering
(Manufacturing Management) (Hons.)
by
UMIE ROSMIDA BINTI MAMAT B051310281
940910-11-5588
UNIVERSITI TEKNIKAL MALAYSIA MELAKA
BORANG PENGESAHAN STATUS LAPORAN PROJEK SARJANA MUDA
TAJUK: QUALITY IMPROVEMENT USING FACTORIAL DESIGN: A CASE
STUDY AT MANUFACTURING COMPANY
SESI PENGAJIAN: 2016/2017 Semester 2
SayaUMIE ROSMIDA BINTI MAMAT
mengaku membenarkan Laporan PSM ini disimpan di Perpustakaan Universiti Teknikal Malaysia Melaka (UTeM) dengan syarat-syarat kegunaan seperti berikut:
1. Laporan PSM adalah hak milik Universiti Teknikal Malaysia Melaka dan penulis. 2. Perpustakaan Universiti Teknikal Malaysia Melaka dibenarkan membuat salinan
untuk tujuan pengajian sahaja dengan izin penulis.
3. Perpustakaan dibenarkan membuat salinan laporan PSM ini sebagai bahan pertukaran antara institusi pengajian tinggi.
4. **Sila tandakan ( )
SULIT
TERHAD
/ TIDAK TERHAD
(Mengandungi maklumat yang berdarjah keselamatan atau kepentingan Malaysia sebagaimana yang termaktub dalam AKTA RAHSIA RASMI 1972)
(Mengandungi maklumat TERHAD yang telah ditentukan oleh organisasi/badan di mana penyelidikan dijalankan)
Alamat Tetap:
156, KAMPUNG BINJAI MANIS,
MANIR, 21200, KUALA TERENGGANU, TERENGGANU DARUL IMAN.
Tarikh: ________________________
Disahkan oleh:
Cop Rasmi:
Tarikh: _______________________
DECLARATION
I hereby, declared this report entitled “Quality Improvement Using Factorial Design: A Case Study In Manufacturing Company” is the results of my own research expect as cited
in reference.
Signature : ...
Author’s Name : UMIE ROSMIDA BINTI MAMAT
APPROVAL
This report is submitted to the Faculty of Manufacturing Engineering of Universiti Teknikal Malaysia Melaka as a partial fulfillment of the requirements for the degree of
Bachelor of Manufacturing Engineering (Manufacturing Management) (Hons.). The members of the supervisory committee as follow:
... (DR NADIAH BINTI AHMAD)
i
ABSTRAK
ii
ABSTRACT
iii
DEDICATION
Special dedicate to my beloved parents, Mamat Bin Ismail and Ramlah Binti Jusoh that encourage me to believe in hardwork. To my siblings for giving me moral support.
To my supervisors, Prof Dr Lukman Sukarma and Dr Nadiah Binti Ahmad. Thanks for your guidance, helps and cooperation.
iv
ACKNOWLEDGEMENT
Firstly, I would like to express my sincerest appreciation to my supervisor Professor Madya Dr. Lukman Sukarma and Dr Nadiah Binti Ahmad who entrust to give this project to me, give guidance, encouragement and criticism how to perform in this project. Working under them made a substantial contribution to my academic field. Their insightful suggestion for completing this project helps me understand the detail of project deeply.
I am also very grateful to the owner of the Small Manufacturing Enterprise (SME) En Razif bin Abdullah that willing to give me a chance to conduct an experiment there. He introduce all the workers there and being very helpful and supportive especially during the experiment is run. I would like to thank to all workers there that willing to share their knowledge and give very useful information to me regarding to this project.
v
TABLE OF CONTENT
Abstrak i
Abstract ii
Dedication iii
Acknowledgement iv
Table of Contents v
List of Tables viii
List of Figures ix
List of Abbreviations xi
List of Symbols xii
CHAPTER 1: INTRODUCTION
1.1 Background of Project 1
1.2 Problem Statement 2
1.3 Objectives 6
1.4 Scope 6
CHAPTER 2: LITERATURE REVIEW
2.1 Design of Experiment (DOE) 7
2.1.1 Purpose of Experimental Design 8
2.1.2 Applications of Experimental Design 9
2.2 Basic Information of Factorial Design 10
2.2.1 Step in setting the factors in experiments of Factorial Design Method 10
2.2.2 Two Levels Factorials 11
2.2.3 Types of Treatments 11
2.2.4 Analysis of Variances (ANOVA) 12
2.2.4.1 Repeated-Measures ANOVA 13
2.2.5 Confidence Interval (CI) 13
2.2.6 Full Factorial Design with Two Levels 14
vi
2.4 Advantages of Factorial Design 19
2.5 Minitab Software 19
CHAPTER 3: METHODOLOGY
3.1 Research Flow Chart of Methodology 22
3.1.1 Flow Chart for FYP 1 22
3.1.2 Flow Chart for FYP 2 24
3.2 Project Implementation 25
3.3 Details of Methodology 26 3.3.1 To investigate the factor or input variables that create the most yield
production of good texture of fish crackers. 27
3.3.2 To implement Factorial Design in the experiment and analyse result
through the usage of Design Expert Software. 30
3.3.2.1 Choice of Experimental Design 31
3.3.3 To determine the optimum setting depend on result obtain from
experiment for producing better quality improvement of fish crackers. 32
CHAPTER 4: RESULTS AND DISCUSSION
4.1 Data collection for determine the levels 33
4.1.1 Quantity of Cornstarch,(kg) 34
4.1.2 Duration of Boiling Process (Minutes) 35
4.1.3 Duration of Drying Process (hours) 36
4.2 Data Collections 38
4.3 Normal Probability Plot 41
4.4 Analysis of Variance (ANOVA) Table 42
4.5 Main Effect and Interaction Effect Graph 44
4.5.1 Main Effect Graph 44
4.5.1.1 Main Effect Graph for Factor A (Quantity of Cornstarch, kg) 44 4.5.1.2 Main Effect Graph for Factor B (Duration of Boiling Process,
Minutes) 45
4.5.1.3 Main Effect Graph for Factor C (Duration of Drying Process,
vii
4.5.2 Interaction Effect Graph 47
4.5.2.1 Interaction Effect Graph for Factor A (Quantity of Cornstach,kg)
and Factor B (Duration of Boiling Process,min) 47
4.5.2.2 Interaction Effect Graph for Factor A (Quantity of Cornstach,kg)
and Factor C (Duration of Drying Process,min) 48
4.5.2.3 Interaction Effect Graph for Factor B (Duration of Boiling Process)
and Factor C (Duration of Drying Process,min) 49
4.6 Regression Model 50
4.6.1 Final Equation in Terms of Code Factors 50
4.6.2 Final Equation in Terms of Actual Factors 51
CHAPTER 5: CONCLUSION AND RECOMMENDATION
5.1 Conclusions 53
5.2 Sustainability 53
5.3 Recommendation 54
REFERENCES 56
APPENDICES
viii
LIST OF TABLES
1.1 Observation for each process of Fish Crackers 4
2.1 Repeated Measures 13
2.2 Application of Factorial Design 14
3.1 Observation to identify the standard measurement for selected factors 29 3.2 Observation to determine the optimal levels for selected factors 29
3.3 Example of Factorial Design 31
4.1 Ingredients of Fish Cracker 34
4.2 Observation for Quantity of Cornstarch (First Experiment) 34
4.3 Observation for Quantity of Cornstarch (Second Experiment) 35
4.4 Observation for duration of Boiling Process (First Experiment) 36 4.5 Observation for duration of Boiling Process (Second Experiment) 36
4.6 Observation for Duration of Drying Process (First Experiment) 37
4.7 Observation for Duration of Drying Process (Second Experiment) 37
4.8 Table of Factors and Levels 38
4.9 Observation Result using Factorial Design 39
4.10 Levels for Factors 50
ix
LIST OF FIGURES
1.1 Graph for Percentage of fish crackers in term of its texture in August 2016 5
2.1 Two Level Factorial Design in Minitab Software 20
3.1 Structure for Final Year Project 22
3.2 Flow chart for FYP 1 23
3.3 Flow chart for FYP 2 24
3.4 Flow chart for objectives 26
3.5 Process Flow for Objective 1 27
3.6 Experiment to get the factors and input variables 28
3.7 Two experiment using selected factors 29
3.8 Process Flow for Objective 2 30
3.9 Process Flow for Objective 3 32
4.1 Yield of Fish Cracker versus Run Order 39
4.2 Half Normal Probability Plot 41
4.3 ANOVA Table Result 42
4.4 Result of the Minitab 43
4.5 Plot of the Quantity of Cornstarch (Factor A) 44
4.6 Plot of the Duration of Boiling Process (Factor B) 45
4.7 Plot of the Duration of Drying Process (Factor C) 46
4.8 The Interaction Graph of Quantity of Cornstarch (Factor A) and Duration
of Boiling Process (Factor B) 47
4.9 The Interaction Graph of Quantity of Cornstarch (Factor A) and Duration
of Boiling Process (Factor B) 48
4.10 The Interaction Graph of Duration of Boiling Process (Factor B) and
x
4.11 Final Equation in term of Code Factors 51
xi
LIST OF ABBREVIATIONS
ANOVA - Analysis of Varience
CI - Confidence Interval
DOE - Design of Experiment
xii
LIST OF SYMBOLS
α - Alpha
% - Percentage
1
CHAPTER 1
INTRODUCTION
Chapter 1 is about general information for the project with the title of Quality Improvement using Factorial Design that conducted in manufacturing company. This chapter provides four sections such as background of project, problem statement, objectives and research scope.
1.1 Background of Project
In the competitive world of industry,it is very high in preparing the best service to customers. Thus, the company must maintain or control the quality of the product because it has a important role. Nowadays, a lot of competition in business field, so anyone that want to grow their business must work hard to seek new opportunities in terms of best quality need to be maintained or developed into a better ways. Sahno and Shevtshenko (2014) claimed that, the better quality of product will lead to better performance of the company. Moreover, the profits of company automatically can be increased in a large range if they able to manage their product quality in a perfect way. A good quality of products can be obtained through the eliminated or control the bad factors.
2
simultaneous examination of the impacts of many process factors at various levels and analyze an interaction. After all possible parameters or factors were decided, some techniques can be applied to get the solution like using Excel, Minitab and Design Expert Software. After that, ANOVA (Analysis of Variance) table will be appeared that act as a conclusion of the experiment. According to Kumar et al. (2015a) ANOVA will show an importance effect of independent factors and able to translated into graph plot.
The effectiveness of factorial design method can be shown through this project. This project was conducted at Small Manufacturing Enterprise (SME) that located at Kuala Terengganu. In this case, all process to produce the fish cracker was investigated to identify which parts can lead to the poor quality of fish cracker. Then, determine the selected factors that produce the maximum yield of fish crackers with good texture. The selected factors are quantity of cornstarch, duration of boiling process and duration of drying process. Lastly, the result of the project can be obtained using factorial design.
1.2 Problem Statement
3
Quality of the food also can be controlled by determine the right quantity of materials needed. This organization only has a small size of mixer machine. So, quantity for fish fillet is fixed to 5kg for each mixing process. The problem happens when to analyze the suitable amount of cornstarch that must be matched with the fish fillet. This is because, there is no specific amount of cornstarch should be put, they only assume for each run. Quantity of cornstarch need to control because according to the expert worker here it is can affect the texture of fish crackers. In order to identify right quantity of cornstarch, an experiment was conducted by using +/- from standard measurement (4 to 6 kg) and got the observation. (Table 1.1)
Many methods are provided to cook fish cracker but they tend to use boiling process rather than steam process for serve a good quality of food. However, the texture of fish crackers still not fulfills the customer requirement. This is might due to undetect duration for fully cook of fish crackers. The workers use traditional method which takes out the fish crackers from the boiling water if it is floating on boiling water. Unfortunately, this method is not too effective due to sometime it is still not fully cook. So, when it is happen the texture will easy to break.
4
Table 1.1: Observation for each process of Fish Crackers
Process Sample Size Observation
Manually clean the
fish 5kg of fresh fish The workers take the fresh fish one by one to make sure it is properly clean.
Store in the freezer 5kg of clean fish Using suitable temperature for keep it in the freezer. There is no problem obtained.
Manually seperate
the fish bone 5kg of clean fish The fish fillet can be seperated without having a problem.
Mix the ingredients into mixer machine
5 kg-fish fillet 160 g-Salt 100 g- Sugar 16 g- MSG 1.3 kg- Ice water
4 kg- cornstarch 6 kg- cornstarch
In this small enterprise there is no range of cornstarch quantity
provided but put it as assumption. In order to identify which
quantity of cornstarch bring poor quality of fish crackers, two experiment were run based on quantity of cornstarch.
a. Below than 4 kg quantity of constarch
Texture of fish crackers too soft, color not attractive (too dark), not expand when fried.
b. Higher than 6 kg quantity of cornstarch
Texture of fish crackers too hard, color not attractive (too bright), tasteless.
Kneading the dough (manually)
Fish fillet mix with
cornstarch They will knead ing the dough manually. Each stick contain 2kg of fish crackers dough. Before proceed to knead process, they
will weight the dough first.
Boiling process
10 stick of fish
crackers Take out the fish crackers when it is floating on boiling water:
6/10 – fish crackers fully cooked 4/10 – fish crackers half cooked
Store in the freezer 10 stick of fish crackers Using suitable temperature for keep it in the freezer. There is no problem obtained.
Cutting process 10 stick of fish crackers The cutting of fish crackes can be controlled by using a cutter machine.
Arrange the fish
5
Drying process
Duration drying process for:
a. Less than 6
hours
b. More than 8
hours
Duration of drying process that has been decided by this small enterprise in the range of 6 to 8 hours. To determine either more or less than the range of time that can lead to low quality of fish crackers, two experiments were carried out:
a. Less than 6 hours
Condition of fish carakers: Texture (soft) stick with others slice, easy to broke and smelly
b. More than 8 hours
[image:21.595.81.521.69.233.2]Condition of fish crackers: Texture (hard) and easy to store or package
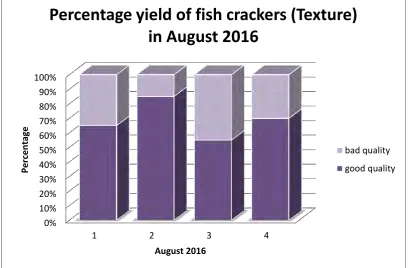
Figure 1.1 shows the yield of fish cracker produce with good quality versus bad quality (percentage) in four week for August 2016.
Figure 1.1: Graph for Percentage of yield fish crackers in term of its texture in August 2016
Overall observation from Figure 1.1 is indicating the bad quality of fish crackers occur at every week in August 2016. The highest percentage occurs at week 3. It is might due to the usage of wrong parameter for quantity of cornstarch, duration of boiling process and duration of drying process.
0% 10% 20% 30% 40% 50% 60% 70% 80% 90% 100%
1 2 3 4
Per
ce
n
tage
August 2016
Percentage yield of fish crackers (Texture)
in August 2016
bad quality
[image:21.595.100.509.341.609.2]6 1.3 Objectives
The aim of this study is to provide the best solution in quality for fish cracker according to it process. Thus, the main objectives as stated below:
i. To investigate the factors or input variables that creates the maximum yield of fish crackers with a good texture.
ii. To implement Factorial Design in the experiment and analyze result through the usage of Minitab 17 Software.
iii. To determine the optimum setting depend on result obtain from experiment for producing better quality of fish crackers.
1.4 Scopes
This project is conducted at a small enterprise of food industries that produce fish crackers. In producing fish crackers, there are some defects happen that leads to the poor quality of product produces. Thus, the scopes as shown as below:
i. Observe the maximum yield of fish crackers with good texture in production line.
7
CHAPTER 2
LITERATURE REVIEW
Chapter 2 is about the research that has been carried out by other people with gives some information of this project. From the reading, student able to get the idea for conduct the project.
2.1 Design of Experiment (DOE)
According to Patel et al. (2016), Design of Experiment (DOE) is a necessary piece of analytic quality by design. The analytic that incorporate of experimental design, mathematical model generation by ANOVA analysis, graphical form, show correlation between factors and response. Besides, DOE will able to study how factors affecting the method and defining a robust.
Rekab and Shaikh (2005a), claimed that experimental design is a test that conducting in an experiment to identify vital input variables and observe it which changes needed or not. This is needed to produce an excellent output response. The goals and outline of the Design of Experiment as shown as below:
Goals:
Improve process yields (outcomes)
Find factors that affect the average response (location).
8
Find factor setting that optimizes the average response (parameter optimization).
Find factor setting that minimizes variability.
Reduce development time.
Reduce overall cost.
Outline:
Determine the objective of the experiment.
Determine the response.
Determine the factors and the region of interest.
Determine the settings of the factors.
Perform the experiment.
Perform statistical analysis.
Draw practical conclusion and give recommendations.
2.1.1 Purpose of Experimental Design
Lawson (2010a) stated that prescription for successful application of the scientific method is the one of the reason for usage of experimental design. There are scientific methods contain of iterative application of the following steps:
i. Find the state of nature
ii. Conjecturing or hypothesizing the mechanism for what has been find iii. Take the data
iv. Conduct an analysis to confirm or reject the conjecture