The role of past sun exposure in Multiple Sclerosis
by
Ingrid A.F. van der Mei
Doc
t
or
andus
(
Mas
t
er
’
s
)
Environmental Health Sciences, Human Movement Sciences
A thesis submitted in fulfilment of the requirements for the degree of
Doctor of Philosophy
This Thesis contains no material which has been accepted for any degree or diploma by the University or any other institution, except by way of background information and duly acknowledged in the Thesis, and to the best of my knowledge and belief no material previously published or written by another person, except where due acknowledgement is made in the text of the Thesis.
A
UTHORITY OFA
CCESSThis Thesis may be made available for loan and limited copying in accordance with the Copyright Act 1968
SIGNATURE
This epidemiological thesis firstly reviews the disease Multiple Sclerosis (MS): its history, pathology, clinical expression, and the current views on immunopathogenesis, aetiology and treatment. A separate review on ultraviolet radiation (UVR) and MS indicates that recent work in photoimmunology provides evidence that UVR can attenuate T helper 1 cell mediated processes through several mechanisms, and that epidemiological features of MS, such as the striking latitudinal gradient and seasonal variation in month of birth, MS onset and disease activity, are at least in part consistent with the hypothesis that UVR exposure may reduce the risk of MS. An ecological analysis was conducted as part of the PhD to demonstrate that regional variation in MS prevalence in the continent of Australia could be closely predicted by regional UVR levels, but analytical epidemiological studies are required to further investigate the UVR hypothesis.
The project central to this thesis was a population based case-control study on Multiple Sclerosis, conducted in Tasmania, Australia. It examined: (i) whether high past sun exposure was associated with a reduced risk of MS, (ii) whether sibship structure and past infections influenced the risk of MS and (iii) whether having had children and differences in prevalence and strength of MS risk factors between men and women could explain the sex difference in MS. Interviews were conducted with 136 cases with MS and 272 controls randomly drawn from the community and matched on sex and birth year. In one of the methodology chapters, a measure-retest and method comparison was conducted to examine aspects of reliability of the sun exposure measures used in the case-control study. A separate study on 104 healthy volunteers was carried out to examine the effect of seasonal variation and body hair on melanin density estimates based on skin reflectance.
The case-control study showed that higher past sun exposure, particularly during childhood and early adolescence, was associated with a reduced risk of MS, which is compatible with UVR having a protective role against MS. Having younger siblings, but not older siblings, was also associated with a reduced risk of MS, while having had glandular fever or having high antibody titers against the Epstein-Barr virus was associated with an increased risk of MS. Among women, a negative association was found between having had children and MS.
In 1998, I joined the Menzies Centre for Population Health Research on a one year Australian-European Program Award to conduct epidemiological research and to bring back my newly acquired knowledge to the Netherlands. Rather than returning to the Netherlands, Professor Dwyer (director of the Menzies Centre) gave me the opportunity to conduct research on Multiple Sclerosis. There are a number of people I would like to acknowledge for their contributions they have made to the research I have conducted at the Menzies Centre.
Firstly, my supervisors, Professor Dwyer and Associate Professor Anne-Louise Ponsonby. Professor Dwyer has not only given me the opportunity to conduct my PhD at the Menzies Centre, but has also contributed greatly to my increased epidemiological knowledge as well as being central in providing feedback on statistical analyses, publications and thesis chapters.
Thanks must also go to my second supervisor, Anne-Louise Ponsonby. I am deeply grateful to Anne-Louise for the incredible amount of time devoted to supervising me. Her constructive criticism and eye for detail has resulted in high quality research, which is reflected in some excellent results in this thesis. I have benefited in areas such as research methods,
publication writing and statistical analyses as well as the invaluable skill of improving efficiency when working part-time. With Anne-Louise located in Canberra, our contact was mostly by phone and email. This was refined to a fine art (with only the very occasional glitch in the system).
I would like to sincerely thank the research team involved in the fieldwork. High quality work can only be done with a high quality team. Trish Groom and Jane Pittaway conducted the interviews in a professional and personable manner. They made many evening phone calls and pursued every avenue to obtain high response rates. Thanks to Natasha Newton for her excellent data entry and both Natasha and Emma Stubbs for their administrative assistance. Tim Albion created a solid database for our complex work, which never failed.
Dr Rex Simmons from the Canberra Hospital was invaluable in the recruitment stages of our research. I observed how pleased people with MS were with his initial presentation as often they learned more about MS than they had in many years. Associate Professor Trevor Kilpatrick from the Walter and Eliza Hall Institute is one of the crucial instigators of research on MS in Tasmania, and has been essential in the diagnostic components of this study, together with Helmut Butzkueven and Bruce Taylor. I look forward to many more years of collaboration.
A special thanks to the biostatisticians who helped me, Leigh Blizzard and Jim Stankovich. Leigh was always available for meetings to discuss the statistical issues of the thesis and publications, and Jim was my helping hand for complicated STATA programming or for passing statistical advice in the corridor.
Finally, a huge thanks to Peter, for his patience and support, for all those Saturdays and
eveningsthatwe could notspend togetherorwith Aaron,and… forallthe tea and biscuitsthat
Declaration ... i
Authority of Access... i
Abstract ...ii
Acknowledgements...iii
Table of contents ...iv
Publications and presentations at scientific meetings...ix
Honours received in the course of this work ... x
Abbreviations...xi
Chapter 1 Introduction ... 1
1.1 The current state of Multiple Sclerosis research ... 1
1.2 Tasmania as a location to conduct epidemiological research on MS... 1
1.3 The project central to this thesis ... 2
1.4 Main objectives of the project central to this thesis... 2
1.5 Outline of the thesis ... 2
1.6 References ... 3
Chapter 2 A review of Multiple Sclerosis: History, diagnosis, clinical expression, pathogenesis, aetiology and treatment. ... 4
2.1 Preface ... 4
2.2 Introduction... 4
2.3 History ... 4
2.4 Pathology... 6
2.5 Diagnostic criteria ... 6
2.6 Clinical features ... 9
2.7 Clinical factors influencing prognosis... 10
2.8 Immunopathogenesis ... 11
2.9 MS morbidity in time, place and person... 14
2.10 Genes or gene regions influencing the development of MS... 21
2.11 Environmental factors influencing the development of MS ... 21
2.12 Immunomodulatory treatments ... 24
2.13 Recent developments and opportunities in epidemiological research on risk factors of MS ... 25
2.14 Summary ... 26
2.15 Postscript... 26
2.16 References ... 26
Chapter 3 Ultraviolet radiation and Multiple Sclerosis: Insights from epidemiological research... 33
3.1 Preface ... 33
3.2 Introduction... 33
3.3 Effects of UVR on the immune system ... 34
3.4 Studies on latitude, seasonal variation and MS ... 36
3.4.1 Latitude... 36
3.4.2 Seasonal variation ... 36
3.4.3 Conclusions from studies on latitude, seasonal variation and MS ... 40
3.5 Analytical studies on UVR and MS ... 40
3.6 Influence of genetic factors... 41
3.7 Conclusion... 43
3.10 References...43
Chapter 4 Regional variation in Multiple Sclerosis prevalence in Australia and its association with ambient ultraviolet radiation. ... 49
4.1 Preface...49
4.2 Introduction ...49
4.3 Methods ...51
4.3.1 Sources of data...51
4.3.2 Data analysis ...52
4.4 Results...53
4.4.1 Relationship between climatic variables and MS prevalence...53
4.4.2 Comparison of melanoma and MS prevalence with regard to UV radiation...55
4.5 Discussion...56
4.6 Summary...58
4.7 Postscript ...58
4.8 References...58
Chapter 5 Methodology of the Tasmanian Multiple Sclerosis case-control study... 61
5.1 Preface...61
5.2 Study design ...61
5.3 Timeline ...62
5.4 Concurrent genetic study ...62
5.5 Source population and study sample ...63
5.5.1 Source population...63
5.5.2 Recruitment of cases ...63
5.5.3 Recruitment of controls ...64
5.5.4 Case ascertainment...65
5.6 Data collection and study measurements ...66
5.6.1 Main interviews ...66
5.6.2 Proxy interviews...66
5.6.3 Repeat interviews ...66
5.6.4 Evaluation forms ...67
5.6.5 Personal residence and work calendars ...67
5.6.6 Information bias ...67
5.6.7 Study measurements...68
5.7 Data analysis ...73
5.7.1 Unmatched analysis...73
5.7.2 Matched analysis ...73
5.7.3 Assessment of confounding...75
5.7.4 Assessment of interaction...76
5.7.5 Odds ratios and test for trend...77
5.8 Summary...77
5.9 Postscript ...78
5.10 References...78
Chapter 6 Reliability of measurements of sun exposure in a case-control study of Multiple Sclerosis... 80
6.1 Preface...80
6.2 Introduction ...80
6.3 Methods ...82
6.3.1 Subjects...82
6.3.2 Measurements ...82
6.3.5 Data analysis... 84
6.4 Results... 88
6.4.1 Characteristics of the samples... 88
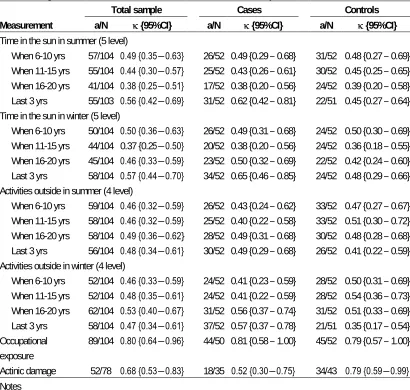
6.4.2 Agreement of measurements of sun exposure ... 88
6.4.3 Agreement of measurement of other factors ... 91
6.4.4 Agreement of measurements of self-reported sun exposure by subgroups... 98
6.5 Discussion ... 105
6.5.1 Measure-retest reliability of the total sample ... 105
6.5.2 Method comparison of self-reported sun exposure of the total sample... 107
6.5.3 Agreement of self-reported sun exposure by disease status... 108
6.5.4 Agreement of self-reported sun exposure by other subgroups ... 109
6.5.5 Limitations of this study ... 109
6.5.6 Conclusions... 110
6.6 Summary ... 110
6.7 Postscript... 111
6.8 References ... 111
Chapter 7 Misclassification due to body hair and seasonal variation on melanin density estimates for skin type using spectrophotometry. ... 113
7.1 Preface ... 113
7.2 Introduction... 113
7.3 Methods... 116
7.3.1 Subjects... 116
7.3.2 Spectrophotometric measurements and body hair assessment ... 116
7.3.3 Estimation of melanin density... 116
7.3.4 Data analysis... 117
7.4 Results... 120
7.4.1 Effect of body hair on the melanin density estimates... 120
7.4.2 Seasonal variation in the melanin density estimates ... 121
7.5 Discussion ... 126
7.6 Summary ... 127
7.7 Postscript... 127
7.8 References ... 128
Chapter 8 Past sun exposure, skin phenotype and risk of Multiple Sclerosis: a case-control study... 129
8.1 Preface ... 129
8.2 Introduction... 129
8.3 Methods... 131
8.3.1 Subjects... 131
8.3.2 Measurements... 131
8.3.3 Data analysis... 132
8.4 Results... 135
8.4.1 Characteristics of the sample ... 135
8.4.2 Risk for measures of skin phenotype... 135
8.4.3 Risk for measures of sun exposure in childhood and adolescence ... 136
8.4.4 Risk for measures of lifetime sun exposure... 138
8.4.5 Risk for measures of sun exposure immediately prior to MS onset ... 139
8.4.6 Risk for measures of occupational sun exposure ... 139
8.4.7 Other factors associated with MS ... 140
actinic damage...143
8.4.10 Effect of sun exposure on age at onset among cases ...143
8.4.11 Population attributable fraction...143
8.5 Discussion...144
8.6 Summary...146
8.7 Postscript ...146
8.8 References...146
Chapter 9 Sibship structure, past infections and risk of Multiple Sclerosis... 149
9.1 Preface...149
9.2 Introduction ...149
9.2.1 Family size and sibship structure...149
9.2.2 Specific infections/viruses...151
9.3 Methods ...155
9.3.1 Subjects...155
9.3.2 Measurements ...155
9.3.3 Data analysis ...155
9.4 Results...157
9.4.1 Risk for measures of sibship structure ...157
9.4.2 Risk for specific viral infections ...161
9.4 3 Effect of confounders and disease-related factors on the relationship between younger sibling number and MS, and Epstein-Barr virus and MS...171
9.4.4 Do the effects of younger sibling number and Epstein-Barr virus operate independently from the effect of sun exposure? ...173
9.4.5 Effect of younger sibling number and Epstein-Barr virus on age at onset among cases ...173
9.4.6 Population attributable fraction...174
9.5 Discussion...175
9.5.1 Sibship structure ...175
9.5.2 Epstein-Barr virus ...177
9.5.3 Conclusions ...178
9.6 Summary...178
9.7 Postscript ...178
9.8 References...179
Chapter 10 The female excess in Multiple Sclerosis: (i) A comparison of prevalence and strength of MS risk factors between females and males; (ii) female specific factors... 182
10.1 Preface...182
10.2 Introduction ...182
10.2.1 Sex difference in MS...182
10.2.2 Effect of puberty development on MS risk...183
10.2.3 Effect of parity on MS risk ...183
10.2.4 Effect of the use of oral contraceptives on MS risk ...183
10.2.5 Effect of pregnancy on MS progression ...184
10.2.6 Effect of breastfeeding on MS progression ...184
10.2.7 Effect of menstrual cycle on MS progression...185
10.2.8 Effect of the use of oral contraceptives, hormone replacement therapy and menopause on MS progression ...185
10.2.9 Possible mechanisms ...185
10.3 Methods ...188
10.3.1 Subjects ...188
10.4 Results... 190
10.4.1 Female to male ratio... 190
10.4.2 Puberty development and risk of MS... 190
10.4.3 Childbirth and breastfeeding history and risk of MS... 191
10.4.4 Sex differences in prevalence and strength of MS risk factors ... 196
10.5 Discussion ... 200
10.5.1 Female to male ratio... 200
10.5.2 Puberty development and risk of MS... 200
10.5.3 Childbirth and breastfeeding history and risk of MS... 200
10.5.4 Sex differences in prevalence and strength of MS risk factors ... 201
10.5.5 Conclusions and future research ... 202
10.6 Summary ... 203
10.7 Postscript... 203
10.8 References ... 203
Chapter 11 Main findings, future research and public health implications ... 206
11.1 Main findings concerning UVR and MS ... 206
11.2 Causal inference with regard to UVR and MS ... 206
11.3 Future research with regard to UVR and MS ... 207
11.4 Public health implications of the inverse association between UVR and MS ... 209
11.5 Other main findings of this thesis... 210
11.6 Overall limitations of the Tasmanian MS case-control study... 211
11.7 The future of epidemiological research of MS... 212
11.7 References ... 212 Appendices
Publications
Ponsonby A-L, van der Mei IAF, Dwyer T, Blizzard, BV Taylor, Kemp A, Simmons RD, Kilpatrick T. High infant contact during early life is associated with a reduced risk of multiple sclerosis. Manuscript submitted to JAMA.
“WhataffectsyourMS? –Responses to an anonymous, Internet-based epidemiological
survey.”SimmonsRD,PonsonbyAL,van der Mei IAF, Sheridan P. Multiple Sclerosis 2004;10:202-211
van der Mei IAF, Ponsonby A-L, Dwyer T, Blizzard L, Simmons R, Taylor BV, Butzkueven H, Kilpatrick T. Past sun exposure, skin phenotype and risk of multiple sclerosis: a case-control study. BMJ 2003;327:316-320
Ponsonby A-L, McMichael A, van der Mei IAF. Ultraviolet radiation and autoimmune disease: insights from epidemiological research. Toxicology 2002;181-182:71-78
van der Mei IAF, Blizzard L, Stankovich J, Ponsonby A-L, Dwyer T. Misclassification due to body hair and seasonal variation on melanin density estimates for skin type using
spectrophotometry. J Photochem Photobiol 2002;68:45-52
Rubio JP, Bahlo M, Butzkueven H, van der Mei IAF, Sale MM, Dickinson JL, Groom P, Johnson LJ, Simmons RD, Tait B, Varney M, Taylor B, Dwyer T, Williamson R, Gough NM, Kilpatrick TJ, Speed TP Foote SJ. Genetic dissection of the HLA region using haplotypes of Tasmanians with Multiple Sclerosis. Am J Hum Genet 2002;70:1125-1137
van der Mei IAF, Ponsonby AL, Blizzard L, Dwyer T. Regional variation in Multiple Sclerosis prevalence in Australia and its association with ambient Ultraviolet radiation.
Neuroepidemiology 2001;20:168-174.
Scientific presentations
van der Mei IAF, Ponsonby AL, Dwyer T, Blizzard L, Simmons R, Taylor BV, Butzkueven H, Kilpatrick T. Past sun exposure, skin phenotype and risk of multiple sclerosis: a case-control study. The Royal Australian College of General Practitioners 46thNational convention &
Annual General Meeting Balance, Hobart, October 2003 (Oral presentation)
van der Mei IAF, Ponsonby AL, Dwyer T, Blizzard L, Simmons R, Taylor BV, Butzkueven H, Kilpatrick T. Past sun exposure, skin phenotype and risk of multiple sclerosis: a case-control study. Australasian Epidemiological Association Annual Meeting, Perth, September 2003 (Oral presentation, Awarded with travel bursary)
van der Mei IAF, Ponsonby A-L Current epidemiological research in Australia to assess the role of exposure of ultraviolet radiation and other environmental factors on Multiple Sclerosis.
Scientificmeeting on “Progressin Multiple SclerosisResearch”,Sydney,October2002 (Oral
presentation)
van der Mei IAF, Stankovich J, Ponsonby A-L, Dwyer T. An approach to study
gene-environment interactions in the Tasmanian Multiple Sclerosis Research Program. Australasian Epidemiological Association Annual Meeting, Canberra, November 2000 (Oral presentation)
van der Mei IAF, Ponsonby A-L, Blizzard L, Dwyer T. Regional variation in Multiple Sclerosis prevalence in Australia and its association with ambient Ultraviolet radiation. Scientific meeting
on ‘Progressin Multiple SclerosisResearch’,Melbourne,November2000 (Oralpresentation)
H
ONOURS RECEIVED IN THE COURSE OF THIS WORKTravel bursary for Australasian Epidemiological Association Annual Meeting, Perth,
September 2003 for oral presentation: Past sun exposure, skin phenotype and risk of multiple sclerosis: a case-control study.
AF Attributable fraction
CGRP calcitonin gene related peptide
CI confidence interval
CMV cytomegalovirus
CNS central nervous system
CSF cerebrospinal fluid
DSS Disability Status Scale
EAE experimental allergic encephalomyelitis
EA-R early antigen complex (restricted), viral protein of Epstein-Barr virus EA-D early antigen complex (diffuse), viral protein of Epstein-Barr virus EBNA Epstein-Barr nuclear antigen, viral protein of Epstein-Barr virus
EBV Epstein-Barr virus
EDSS Expanded Disability Status Scale
HHV human herpes virus
HLA human leukocyte antigen
HSV herpes simplex virus
ICC intraclass correlation coefficient
IDDM type 1 diabetes mellitus
Ig immunoglobulin
IL interleukin
IM infectious mononucleosis
INF interferon
kappa statistic
MBP myelin basic protein
MED mean erythemal dose
MHC major histocompatibility complex
MOG myelin oligodendrocyte glycoprotein
MRI magnetic resonance imaging
MS Multiple Sclerosis
ON optic neuritis
OR odds ratio
PLP proteolipid protein
RR rate ratio
SD standard deviation
SE standard error
Th T helper
TNF tumour necrosis factor
TGF transforming growth factor
UVR ultraviolet radiation
VCA viral capsid antigen, viral protein of Epstein-Barr virus
Chapter 1
Introduction
1.1 T
HE CURRENT STATE OFM
ULTIPLES
CLEROSIS RESEARCHMultiple Sclerosis (MS) is a chronic inflammatory demyelinating disease of the central nervous system affecting over 15,000 Australians. Although essential features of the disease pathology have been known for many years, recent achievements in basic neurobiology and
immunology have led to an increased understanding of the mechanisms responsible for the pathology.1A large amount of descriptive data has demonstrated that there is considerable
regional variation in MS prevalence and that there has been an increase in MS prevalence over time, which is not solely due to increased case-ascertainment. Both genetic and environmental factors seem to interact to cause the disease. Case-control studies and other epidemiological studies have identified some risk factors for MS. A region on the genome, the human leukocyte antigen (HLA) complex, and an environmental exposure, the Epstein-Barr virus, have consistently been found to be positively associated with MS. Recent positive developments in areas such as diagnostic precision (e.g. the use of magnetic resonance imaging), genetic information, computer technology and improved measures for
epidemiological research (e.g. the use of biomarkers) should assist analytical studies that aim to identify risk factors for MS.
1.2 T
ASMANIA AS A LOCATION TO CONDUCT EPIDEMIOLOGICALRESEARCH ON
MS
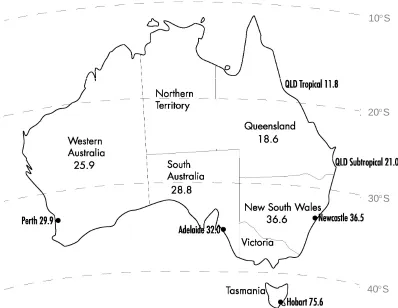
The most recent Australian prevalence survey, conducted in 1981, showed a striking latitudinal gradient of MS with the highest prevalence recorded in Hobart, the capital of the southern-most state of Australia, Tasmania. The age-standardised prevalence of 75.6 per 100,000 in Hobart was more than six times higher than the age-standardised prevalence of 11.8 per 100,000 in tropical Queensland.2
Tasmania comprises about 0.9% of the total area of Australia and lies between 4038’S and
4339’S,placing iton similarlatitudesto the northern partofthe south island ofNew Zealand.
The mean maximum temperature of Hobart is 21.5C in January and 11.6C in July and the mean effective ultraviolet radiation level is relatively high in summer (20.7 mean erythemal doses (MEDs) in January), but low in winter (1.7 MEDs in July).3Tasmania has approximately
2.5% of the Australian population.4At the 2000 census, Tasmania had a population of
470,336 persons of whom 75% were located in urban centres of 1000 or more persons.4The
Tasmanian population is relatively stable. In 1978, the population was 413,538, and between 1978 and 2000, the rate of population growth was less than 1% per year.4, 5From an ethnic
point of view, Tasmania is relatively homogenous, with more than 90% of Tasmanians being able to trace their ancestry back to the British Isles. Due to the isolated geographical position of Tasmania and limited migration in the twentieth century, 60-65% of the current population descend from the original 10,000 settling families, indicating that a large founder effect exists.6
These features together with the relatively high prevalence of MS makes Tasmania suitable to conduct research examining environmental and genetic risk factors for MS.
1.3 T
HE PROJECT CENTRAL TO THIS THESISFrom 1999 to 2001, we conducted a population-based epidemiological case-control study to
examine whetherenvironmentalfactorsmightinfluence the riskofMS.This“Tasmanian MS
case-controlstudy”waspartofa largerprogram “The Tasmanian MS Research Program”
which started in 1998 and included a genetic project that aimed to identify MS susceptibility genes in the Tasmanian population. The program was a collaboration between the Australian National Register of MS families (Canberra), The Walter and Eliza Hall Institute (Melbourne), Royal Melbourne Hospital, the Murdoch Institute (Melbourne), Tasmanian neurologists and the Menzies Centre for Population Health Research. The Tasmanian MS case-control study was largely funded by the National Health and Medical Research Council, the federal
government funding body for medical research. The set-up phase was funded by MS Australia and the Australian Rotary Health Research Fund. The genetic study was funded by the National MS Society of the United States and the Cooperative Research Centre for Discovery of Genes for Common Human Diseases (Australia).
1.4 M
AIN OBJECTIVES OF THE PROJECT CENTRAL TO THIS THESISAt the commencement of the study in 1999, the main objectives of the Tasmanian MS case-control study were:
1. to examine if past high ultraviolet radiation exposure (determined by a biological measure of photoageing, previously validated questionnaire measures and a calendar) during childhood and adolescence is associated with a reduced risk of MS after controlling for confounding factors such as childhood infections and melanin density of the skin.
2 A) to examine the relationship between past infections and MS by testing the hypothesis that major infection, particularly during childhood and adolescence, is independently associated with increased risk of MS using subject recall and serological evidence of past infection.
B) to perform a detailed assessment of the influence of sibship structure (birth order, sibling number, number of younger and older siblings, and intersibling interval) on MS risk as an indirect measure of the timing of infection load.
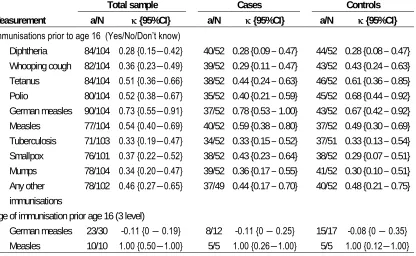
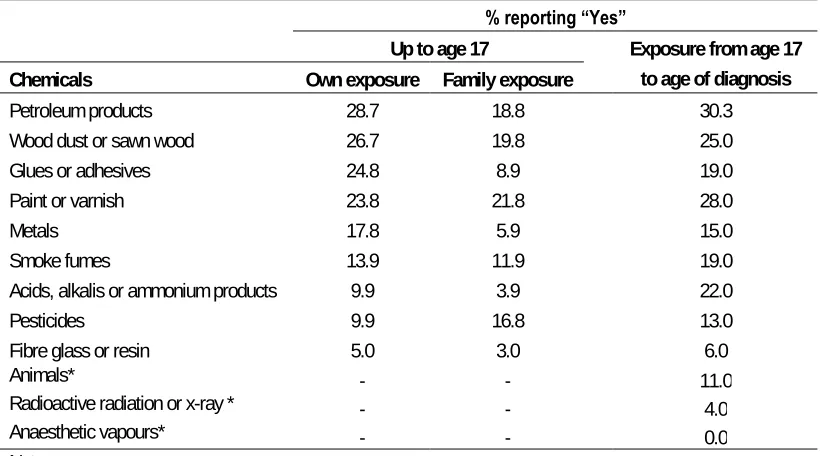
3. to examine the association between other environmental exposures (parity, immunisations, diet, exposure to chemicals, animal exposure, concussion, tobacco smoke) and MS after adjustment for confounding factors.
1.5 O
UTLINE OF THE THESISThisthesisfocusesin particularon the “UVR hypothesis”,the firstobjective ofthe projectas
In chapter 2, an overview is given on the history of MS, clinical aspects, current insights on the immunopathogenesis, epidemiological features and current treatments. In chapter 3, recent immunological findings and epidemiological features are discussed which are consistent or not consistent with the primary hypothesis of this thesis that past UVR exposure is associated with a reduced risk of MS. In Chapter 4, an ecological analysis is conducted which examines to what extent regional UVR levels might explain the regional variation of MS prevalence in Australia. Both chapter 3 and 4 provide evidence that analytical epidemiological studies are warranted to examine the UVR hypothesis. Chapter 5 outlines the methods of the analytical case-control study that was conducted to examine this hypothesis. Chapter 6 and 7 are methodological chapters that assess aspects of reliability of past sun exposure, skin type and other measures used in this thesis. Chapter 8 shows the results of the UVR hypothesis. Chapter 9 shows the results of the associations between sibship structure, past infections and MS, the second objective of the Tasmanian MS case-control study. Chapter 10 discusses the female excess observed in MS by examining the female to male ratio by age, the relationship between puberty development and MS, the relationship between having children among women and MS onset and sex differences in prevalence and strength of particular risk factors of MS. The final chapter will discuss the main conclusions of this thesis, future research that might assist in the causal inference of the finding regarding UVR and MS and public health implications that this finding might have in the future.
1.6 R
EFERENCES1. Lassmann H. The pathology of multiple sclerosis and its evolution. Philos Trans R Soc Lond B Biol Sci 1999; 354:1635-40.
2. McLeod JG, Hammond SR, Hallpike JF. Epidemiology of multiple sclerosis in Australia. With NSW and SA survey results. Med J Aust 1994; 160:117-22. 3. Gies HP. Ambient ultraviolet radiation. SPIE Ultraviolet Technoglogy V 1994;
2282:272-284.
4. Australian Bureau of Statistics. Tasmanian Year Book 2000. Commonwealth of Australia, 2000.
5. Young LF. Cancer in Tasmania, Incidence and Mortality 1978. Hobart: Tasmanian Government Printer, 1980.
Chapter 2
A review of Multiple Sclerosis:
History, diagnosis, clinical expression, pathogenesis,
aetiology and treatment.
2.1 P
REFACEThis chapter gives an overview of the disease Multiple Sclerosis (MS): its origin, pathology, clinical expression, and the current views on immunopathogenesis, aetiology and treatment. It provides information relevant for the understanding of the thesis.
2.2 I
NTRODUCTIONMultiple Sclerosis (MS) is a chronic demyelinating disease of the central nervous system (CNS). The CNS consists of a large, complex brain and an elongated spinal cord. MS is characterised by focal areas of destruction of the myelin sheath in the brain and spinal cord. A myelin sheath surrounds axons and permits rapid conduction of nerve impulses. MS is the most common neurological disease of young adult Caucasians of North European ancestry (prevalence United Kingdom 74-193 per 100,000 population),1with about 75% having a
disease onset prior to the age of 50 years.2, 3The disease is more common in females than in
males, usually in a ratio of about two to one.4The mortality rate due to MS is low (1-4% per
year), leading to a large burden of chronic disease morbidity.
2.3 H
ISTORYPathological descriptions of MS cases appeared for the first time around 1838.5Carswel
(1938) and Cruvelhier (1941) both provided pathological anatomical illustrations of the human body, which were later interpreted as representing the macroscopical appearances of the plaques seen in MS.5J-M Charcot is seen as the first to recognise that MS was a distinct
entity. His publications in the late 1860s emphasised the frequency of the disease and included clinico-pathological correlations and speculations on the pathophysiology.6The following excerptfrom a diary,written between 1822 and 1846 byAugustusd’Este,an
illegitimate grandson of King George III, was published by Douglas Frith in 1940.7It seems to
represent the first recorded case fulfilling the diagnostic criteria for clinically definite MS.
In the month of December 1822 I travelled from Ramsgate to the Highlands of Scotland for the purpose of passing some days with a relation for whom I had the affection of a son. On my arrival I found him dead.–I attended his funeral:–Shortly after the funeral I was obliged to have my letters read to me, and their answers written for me, as my eyes were so attacked that when fixed uponminuteobjectsindistinctnessofvision wastheconsequence:…Soon afterI
went to Ireland, and without anything having been done to my eyes, they completely recovered their strength and distinctness of vision.–Now (December 1827) a new disease began to show itself: every day I found gradually (by slow degrees) my strength leaving me: I could clearly
perceiveeachsucceedingdaythatIwentupanddown thestaircasewithgreaterdifficult…..I
Charcot referred to the disease asla sclerose en plaques disseminées,la sclerose
multiloculaireorla sclerose generalisée.6These names were translated in the New Sydenham
Society edition of his lectures asdisseminated (cerebrospinal) sclerosis. Many name variations were used (insular sclerosis,lobular and diffuse sclerosis,multiple Sklerose,
multiple inselformige Sklerose,multiple Sklerose des Nervensystems) and it was not until the 1950s that consistency of nomenclature was achieved.5The process of renaming the disease
gathered momentum with the formation of patient support societies and the publication of the monographMultiple Sclerosiswritten by Douglas McAlpine, Nigel Compston and Charles Lumsden.
The work of the 19thcentury investigators focussed on pathological observations within the
brain and a description in the variations in clinical presentation. A review from 1849 to early 1900s,5showed that many pathological and clinical features currently well recognised, were
already described in those early days. In 1849 for example, autopsies revealed plaques, seen as locations with abnormal firmness or leathery consistency, were observed in irregularly circumscribed parts of the white matter, but rarely in the grey matter of the brain. In the 1860s, plaques were found to be orientated around a central blood vessel, which was interpreted by Rindfleisch as evidence for a chronic inflammatory process. In addition, the loss of myelin sheaths in lesions was described as the associated increased density of connective tissue in the form of scar tissue. In the early 1900s, Marburg showed that the disease process was not confined to the brain and spinal cord, but that demyelination also existed in the peripheral nervous system in some cases. Around 1900, MS was seen as a primary inflammatory demyelinating disease possibly mediated by a soluble myelinotoxic factor and with relative sparing of axons. Clinically, Charcot played a significant role in correlating clinical symptoms, such as amblyopia, nystagmus, dysarthria and ataxia with the anatomical locations in the brain involved (cerebrum, cerebellum, brainstem). He also outlined the cognitive
manifestationsofthe disease,while Marie,one ofCharcot’spupils,reported disordered
bladder, bowel and sexual functions in some cases. Importantly, Marie also recognised the variable symptoms at onset and the subsequent clinical course, which could be progressive from onset or progressive at a later stage of disease. In a group that was progressive from onset, he noted a later age of onset, a worse prognosis, a relative absence of histological involvement of the cerebrum and a more frequent axon degeneration.
The work of the 19thcentury investigators highlighted the need for an epidemiological
approach to the disease. The period 1900-1950 saw a gradual evolution of the conduct and statistics of population-based studies. The initial studies provided snapshots in frequency and indicated the need for improved methods of case ascertainment. In 1921, Davenport8noted
that MS was more common among drafted men in the northern states of the United States compared to the southern states. He also pointed out that a large component of variation between studies could be related to selection of the denominator rather than variations in numerator, arguing for carefully designed regional studies.8
Although the quality of the studies increased, a material increase in information on the epidemiology of MS did not occur until the 1950s. A milestone was achieved in 1950 with a publication from the Association for Research in Nervous and Mental Diseases showing that mortality rates were greater in temperate zones than in the tropics or sub-tropics and figures were higher in northern parts of the United States and Italy than in southern regions.9A more
extensive survey in 31 countries between 1951 and 1958 showed similar regional variations although overall mortality had decreased, reflecting the impact of improved health care following the introduction of antibiotics and other treatments of complications of MS.10
explored.11-14Latitude seemed more important than altitude12and both lower temperature12, 13
and diminished solar radiation14correlated with the MS distribution. The inverse association
between solar radiation and MS prevalence even persisted after adjustment for latitude.14
2.4 P
ATHOLOGYIndividual nerve cells (neurons) contain a cell body, dendrites and an axon (a structure specialised to conduct electric al signals). Communication between nerve cells usually occurs from the terminal of the transmitting neuron via a synapse. Synaptic junctions are often located between an axon and a dendrite, but can also be located between an axon and a nerve cell body, between two axons, and between two dendrites. Impulse transmission at most synaptic sites involves the release of a chemical transmitter substance. Many axons are covered by multiple concentric layers of myelin, a lipid-rich insulating material produced by Schwann cells in the peripheral nervous system and by oligodendrocytes (specialised glial cells that produce myelin in the brain, optic nerves and spinal cord) in the central nervous system. The myelin sheath permits rapid conductions of nerve impulses. The smallest axons are unmyelinated and are not very prominent in histologic preparations, even though they are far more numerous than the larger, myelinated axons.
MS is currently described as a chronic inflammatory demyelinating disease of the CNS. The disease process is characterised by focal areas of destruction of the myelin sheath in the brain and spinal cord. These areas of destruction are known as plaques or lesions. By gross
inspection of the unfixed brain, inactive plaques appear as grey discoloured areas with firm tissue texture.15Microscopically, myelin sheaths are completely lost in inactive plaques, axons
are spared and embedded in dense astroglial scar tissue.15Active plaques, in contrast,
macroscopically have a pink discolouration and their tissue texture is soft, while
microscopically they reveal demyelination with little astroglial scar formation and the lesions are infiltrated by numerous inflammatory cells (such as macrophages) that contain myelin and tissue debris in their cytoplasm.15All lesions appear to result from a selective and localised
attack on the myelin of the nerves, or on the cells responsible for making myelin, the oligodendrocytes.16
Chronic persistent inflammation in the CNS is another characteristic pathological feature. This inflammation is not restricted to the areas of demyelination, but also affects large parts of the so-called normal white and grey matter. However, the density of inflammatory infiltrates is in general higher within demyelinated plaques compared to the surrounding white matter.17
Although the essential features of MS lesions have been known for many years,
understanding of the mechanisms has lead to the notion that MS is a much more complex disease than originally thought.18For example, different mechanisms of demyelination operate
in different subgroups of MS patients and different patterns of oligodendrocyte pathology can be found in MS lesions.18, 19However, early symptoms are widely believed to result from
axonal demyelination,18while the regression of symptoms has been attributed to the resolution
of the inflammatory response and to partial remyelination.16Repeated episodes of disease
activity may result in, for example, irreversible axonal injury and exhaustion of the
oligodendrocyte progenitor pool which will lead to progressive loss of neurologic function.16
2.5 D
IAGNOSTIC CRITERIAbut a recent history of remitting symptoms),probable(soon changed to early probable or latent: no reasonable doubt about the diagnosis),possible(findings suggesting the diagnosis and no other cause found but the history static or progressive and with insufficient evidence for scattered lesions) and the unusual term ofdiscardeddisseminated sclerosis. Until the mid-1980s, most surveys of MS used the Allison and Millar criteria with some modifications within categories, including the introduction of the term (clinical)definitein 1965.21Schumacher et
al.22(1965) categorised definite cases as those showing objective evidence for disease
affecting two or more white matter parts of the CNS, occurring in episodes separated by more than 24 hours or with progression over six months, in a person aged between 10 and 50 years at onset and in whom a competent observer can find no better explanation. Further
modifications adapted by Rose et al.23(1976) were definitions forprobableMS (two episodes
but signs at a single site or a single episode with signs of widespread disease) andpossible
disease (two episodes with no or few signs). The McDonald and Halliday criteria24(1977)
added a definition forprovenMS (evidence from autopsy or biopsy), refined the early probable or latent cases (two episodes and a single affected site or a single episode and two affected sites), and dealt with the difficult issues ofprogressive probable(progressive history with multiple sites affected),progressive possibledisease (progressive history affecting a single site), andsuspectedMS (one episode at a single site unless the optic nerves are affected).
More recently, the Poser committee criteria25(1983) incorporated information available from
laboratory investigations within the categories of clinically definite and probable MS. The Poser criteria have gained widespread acceptance. Changing from the Allison and Millar classification to the Poser criteria does not materially affect estimates for the total number of identified cases but differences do arise when surveys are restricted to the categories of
definiteandprobable(Poser), andprobableandearly(Allison and Millar) cases, since the proportion in the suspected and possible categories needing exclusion differs significantly between the two classifications.5
The Poser criteria25have been the basis for the research conducted for this thesis and will be
outlined in more detail. The criteria include laboratory-based evidence such as examination of cerebrospinal fluid (CSF) obtained at lumbar puncture and the so-called paraclinical evidence such as evoked potentials. The examination of the CSF for oligoclonal immunoglobulin (Ig) G can provide evidence of the immune and inflammatory nature of lesions(s), while the presence of delayed evoked potentials can contribute to determine whether there is a pathological process of demyelination present. An attack is defined as a symptom or symptoms of neurological dysfunction with or without objective confirmation, lasting more than 24 hours, and separate lesions are signs or symptoms that are involved in different parts of the CNS.
evidence of one lesion and paraclinical evidence of another, separate lesion. (2b)Laboratory probably MSis used in the situation where there were two attacks and laboratory support in CSF.
Since 1981, magnetic resonance imaging (MRI) of the brain has developed as one of the more sensitive diagnostic tools. MRI scans show MS lesions which have been demonstrated to correspond with demyelinating plaques at autopsy.26Abnormalities on MRI scans are
observed in about 95% of patients with clinically definite MS.27A detailed description of this
technique is beyond this chapter, but magnetic resonance images depend on the relative amounts and physico-chemical environment of water protons in each area of the brain and the signal depends on a complex set of (tissue) parameters including hydrogen density and two separate relaxation times (T1and T2) which characterise a tissue by the way the nuclei relax.
These relaxation times can be measured and provide T1-weighted and T2-weighted images. In
addition, administration of intravenous gadolinium (gadopentetate dimeglumine) five to ten minutes prior to the scan increases the signal intensity on T1-weighted magnetic resonance
images. Gadolinium enhanced lesions seem to depict the early inflammatory phase of MS lesions, while non-enhanced lesions seem to represent older and inactive lesions. Gadolinium enhancement has been shown to increase the specificity of the diagnosis of MS compared to the use of T2-weighted lesions.28
Since comparable MRI abnormalities may be found in a variety of other diseases and health volunteers, criteria have been developed by which MRI scans can be classified as suggestive of MS or not. Paty et al.27developed the following criteria for the use of MRI scans in 1988,
which have been used as additional diagnostic criteria for our research work. According to those criteria,27an MRI scan: (1) is strongly suggestive of MS if it presents with four lesions, or
with three lesions of which one is in a periventricular location; (2) is suggestive of MS if it presents with three lesions or two lesions of which one periventricular; (3) shows possible MS if two lesions are present or one lesion in a periventricular location; (4) falls in category four (unnamed category) if it shows one lesion not in a periventricular location; and (5) does not show MS if the MRI is normal or shows another diagnosis. Lesions are considered as typical of MS if they are of high intensity on T2-weighted images, measured greater than 3 mm in
diameter, and were located predominantly in the white matter.27
New MRI criteria have been proposed by Barkhof et al.29in 1997, which rely on T2-weighted
imaging as well as gadolinium enhanced imaging. The model includes four dichotomised criteria: the presence of (a) one gadolinium enhanced lesion, (b) one juxtacortical lesion, (c) three periventricular lesions, and (d) one infratentorial lesion. This final model does not include the total number of lesions, but rather shows the importance of the type and location of the lesions. Barkhof et al.29compared their criteria with the criteria from Paty et al.27and Fazekas
et al.30MRI scans were taken from patients who were diagnosed with clinically isolated
predictive value, 75%; and negative predictive value, 84%. This shows that the four
dichotomised MRI parameters proposed by Barkhof et al. are more specific and accurate than the criteria proposed by Paty et al. or Fazekas et al. for predicting conversion to clinically definite MS. Tintore et al.31conducted a similar study and reached the same conclusion.
New diagnostic criteria have been published by the International Panel on the Diagnosis of MS in 2001.32The focus has remained on the objective demonstration of dissemination of
lesions in both time and place. The MRI criteria from Barkhof et al.29have been integrated with
clinical and other paraclinical diagnostic methods (CSF and visual evoked potentials). The revised criteria facilitate the diagnosis of MS in patients with a variety of presentations,
including “monosymptomatic”diseasessuggestive ofMS,disease with a typical relapsing-remitting course, and disease with insidious progression, without clear attacks and remissions.
Previouslyused termssuch as“clinicallydefinite”and “probable MS”are no longer
recommended. The outcome of a diagnostic evaluation iseither“MS”,“possible MS”(forthose atriskforMS,butforwhom diagnosticevaluation isequivocal),or“notMS”.
2.6 C
LINICAL FEATURES [image:23.595.126.470.419.710.2]The symptoms and signs experienced by people with MS are variable but in general reflect the involvement of those parts of the CNS that are most heavily demyelinated. The prevalence of the symptoms reported in different studies varies greatly, caused by the different types of samples (hospital, community, armed forces, autopsies), the diagnostic criteria used in each study and the time and method of assessment of the symptoms (retrospective recall, records).
Table 1. Frequency of symptoms in 301 prevalent patients in South Glamorgan who were interviewed (%).
Symptom Ever? At onset? At prevalence?
Weakness 268 (89) 66 (22) 241 (80)
Sensory symptoms 263 (87) 103 (34) 219 (73)
Ataxia 248 (82) 32 (11) 218 (72)
Bladder symptoms 213 (71) 3 (1.0) 188 (62)
Fatigue 171 (57) 5 (2) 144 (48)
Cramps 156 (52) 2 (0.6) 133 (44)
Diplopia (double vision) 155 (51) 25 (8) 77 (26)
Visual symptoms 148 (49) 38 (13) 98 (33)
Bowel symptoms 126 (44) 0 (0) 112 (37)
Dysarthria 110 (37) 2 (0.6) 74 (25)
Vertigo 107 (36) 13 (4.3) 57 (19)
Facial pain 106 (35) 5 (2) 42 (14)
Poor memory 96 (32) 1 (0.3) 81 (27)
Headache 90 (30) 6 (2) 51 (17)
Mental symptoms 68 (23) 1 (0.3) 49 (16)
Deafness 51 (17) 2 (0.6) 38 (13)
Facial weakness 48 (16) 4 (1) 15 (5)
Dysphagia 40 (13) 1 (0.3) 29 (10)
Data from Matthews (1998)
limbs, sensory disturbances, impaired vision due to optic neuritis, ataxia (loss of coordinated muscular contractions required for the production of smooth movements), diplopia (double vision) and vertigo (illusory feeling of giddiness with disorientation in space).33Common
additional symptoms that develop during the course of the disease were bladder symptoms, fatigue, cramps, bowel symptoms, dysarthria (slurred speech), facial pain, poor memory and headache. It has been recognised that during the course of the disease some MS patients experience considerable cognitive impairment, difficulties with memory, concentration and other mental skills.34
MS is generally categorised as being either relapsing-remitting or primary progressive in onset. The relapsing-remitting form is characterised by a series of attacks that result in varying degrees of disability from which patients recover partly or completely. It is usually followed by a remission period of variable duration before the next exacerbation. At onset, about 85% have this type of MS, while about 15% have primary progressive MS. The progressive form of the disease lacks the acute relapses and instead typically involves a gradual clinical decline. During the course of the disease, about one-third of the relapsing-remitting patients enter a progressive form of MS known as secondary-progressive MS.
2.7 C
LINICAL FACTORS INFLUENCING PROGNOSISIn the past, the most widely used measures of progression have been the Disability Status Scale (DSS) and the Expanded Disability Status Scale (EDSS).35The DSS scale
discriminates the level of neurological impairment of people with MS in 10 grades beyond normal (grade 0) with grade 10 being death due to MS. The DSS scale was adapted in 1983 into the EDSS scale and includes half step increments. Although there has been criticism on the scales, mainly because of its lack of sensitivity and the influence of the walking ability of the patient in determining the score at the higher end of the scale, it is still widely used as a clinical measure of progression. As described above, MRI measures are currently also available as alternative measures of progression. A new inexpensive and precise method that seems promising as a predictive method in patients with a first demyelinating event to
conversion to clinically definite MS is the presence of serum antibodies against myelin oligodendrocyte glycoprotein (MOG) and myelin basic protein (MBP).36People with those
antibodies had more often relapses (95% of people with antibodies against both MOG and MBP, 23% in antibody-negative people) and the mean time to relapse was shorter (7.5 (SD 4.4) months for people with antibodies against both MOG and MBP, 45.1 (SD 13.7) months for antibody-negative people).36
Natural history studies prior to the use of current immunomodulatory treatment showed that, patients deteriorated to an EDSS score of 6 (requires unilateral assistance with ambulation) at a median of 15 years, following diagnosis.37Furthermore, at 15 years following diagnosis,
about 10-15% required the use of a wheelchair, while 20-25% remained unrestricted in their ambulation (EDSS3), demonstrating the large amount of variation between patients.38
Although it might be difficult to estimate prognosis in individual patients at the time of diagnosis, there are some clinical features at onset and after the first two to five years that influence long-term progression.
Weinschenker et al.39followed 1099 MS patients referred to the MS Clinic at the University
previously mentioned, included persisting deficits in brainstem (p=0.01), cerebellar (p<0.001) or cerebral systems (p=0.01), a higher frequency of attacks in the first two years after onset of disease (p<0.001), a short first interattack interval (p<0.001) and higher disability (DSS) at two and five years from onset (p<0.001). A progressive course from onset was also associated with a worse outcome, but not independent of the insidious presentation of a motor deficit and pyramidal tract as first symptoms. Similar results were obtained in an Australian study40which
compared patients with moderate or severe disability (DSS 4-9) with patients with mild disability (DSS 0-3) and found that worse prognosis was associated with older age of onset, progressive disease and onset symptoms that are multiple, pyramidal or cerebellar. The relationship between a worse prognosis and male sex was not independent of a progressive course of MS. In a study following 71 patients for a mean of 14.1 years (range 12.5-16.8) using serial MRI data showed that the EDSS score at 14 years correlated with the T2lesion
volume at five years (r=0.60) and with the increase in T2lesion volume over the first five years
(r=0.61), indicating a worse prognosis if the lesion volume in the first five years is high.41
2.8 I
MMUNOPATHOGENESISThe immune system plays a central role in MS. Before discussing the immunopathogenesis of MS, an overview of the immune system will be given, discussing the immunological aspects that are of importance for MS.
The term immunity refers to all mechanisms used by the body as protection against
environmental agents that are foreign to the body. Immunity may be innate or acquired. Innate immunity is conferred by all those elements with which an individual is born and which are always present, including physiological and chemical barriers, cells that kill micro-organisms, inflammation, fever and biologically active substances that are harmful to micro-organisms. Acquired immunity is more specialised and is acquired by contact with the invader and is specific to that invader only. The initial contact with the foreign agent (immunisation) triggers a chain of events that leads to the activation of certain cells (including lymphocytes) and the synthesis of proteins, some of which exhibit specific reactivity against the foreign agents. By this process, the individual acquires the immunity to withstand and resist a subsequent attack by, or exposure to, the same offending agent.
There are three major cell types involved in acquired immunity. Two of these cell types come from a common lymphoid precursor cell but differentiate along different developmental lines. One line matures in the thymus and is referred to as T cell; the other matures in the bone marrow and is referred to as B cell. Cells of the B- and T-lymphocyte series differ in many functional aspects but share one of the important properties of the immune response, namely, they exhibit specificity towards an antigen (foreign material that is specifically bound by antibody or lymphocytes) or an epitope (a particular portion of the antigen). Antigen-presenting cells such as macrophages constitute the third cell type that participate in the acquired
immune response. Although these cells do not have antigen-specific receptors, their function
isto “process”the antigen and “present”itto the specificreceptorson T lymphocytes.The
may contribute to the pathogenic activation of potentially self-reactive T cell clones, which persist in the healthy immune repertoire in a dormant state.
There are two branches of acquired immunity–humoral and cell-mediated immunity–that interact with each other. Humoral immunity is mediated by serum antibodies, which are proteins (globulins) secreted by B cells in response to immunisation. All serum globulins with antibody activity are referred to as immunoglobulins (Ig). There are five major classes–IgG, IgM, IgA, IgE, IgD–each of which has several unique biological properties. Cell-mediated immunity is mediated by T cells. There are several subpopulations of T cells, each of which may have the same specificity for an antigenic determinant (i.e epitope), although each subpopulation may perform different functions. T helper (Th) cells cooperate with B cells to enhance the production of antibodies. They function by releasing cytokines (soluble substances secreted by cells, which have a variety of effects on other cells) that provide various activation signals for the B cells. T cytotoxic cells are able to kill their target cells, while T suppressor cells are able to suppress the immune response leading to a downward
modulation or a shutoff in reactivity of other effector cells.
T cells carry a receptor composed either of-chains or-chains.-T cells generally dominate in the mature immune system and characterise the vast majority of T lymphocytes in blood, lymph nodes and spleen. These cells are mainly responsible for specific immune functions involved in the elimination of pathogens. The-T cells are mostly found in the lymphatic system of the gut and other mucosal tissues, and are involved in early defence against bacteria and other cellular pathogens.
T cells have surface molecules all of which have different functions. For example, the surface molecules CD4 and CD8 act as adhesion molecules that help to tighten the binding of T cells to antigen-presenting cells. Studies in mice indicate that the Th cells that cooperate with B cells, CD4+T cells, can be divided into subsets based on the different cytokines they produce.
Activated Th1cells secrete for example large amounts of the cytokines interleukin(IL)-2, IL-12,
tumour necrosis factor(TNF)-, and interferon(IFN)-, while Th2cells produces IL-4, IL-5, IL-6
and IL-10. Cytokines produced by one subset can inhibit the function of the other subset, reinforcing the functional differentiation of Th1and Th2subsets. In humans, however, the
cytokine profile is generally more diverse, and forms a continuous spectrum in which Th1and
Th2cells may be only be two of the possible phenotypes.42It seems that naïve T cells have
the option to differentiate either in the Th1or Th2direction and the cytokines present during
initial and subsequent antigen presentation appear to be crucial factors dictating the prospective cytokine pattern of a responsive T cell. This initial cytokine profile might be influenced by factors including particular antigen-presenting cells, co-stimulatory factors and the nature of the peptides presented.
Under normal circumstances, the immune system reliably attacks foreign invaders and ignores self-structures. T cell clones with receptors recognising self-antigens such as myelin specific antigens (myelin reactive T cells) are eliminated in the thymus,43kept in a state of anergy or
non-reactivity, or down regulated.44Thus, the existence of regulated self-reactive T cell clones
is part of the healthy immune repertoire. If, however, these T cells escape, they can attack normal tissues and cause tissue damage and autoimmune disease.
MS is thought to be an example of an autoimmune disease where Th1lymphocytes play a
major role. There are several lines of evidence for this. Firstly, MS has many pathological similarities with experimental allergic encephalomyelitis (EAE), the animal model of MS. EAE is an autoimmune disease that can be induced in a variety of animal species by injections of myelin antigens. The disease is characterised by focal demyelination and Th1cell infiltration.45
seen in EAE. Thirdly, in MS plaques the majority of infiltrating lymphocytes are T cells46-48and
cytokines TNF-and IFN-, often produced by Th1cells, have been observed in plaques of
people with MS.49-51. Fourthly, there is currently good evidence that the genetic HLA class II
region is associated with MS (see section genetic factors). Peptides bound to class II antigen-presenting cells are known to be presented to CD4+ T cells, while class I-embedded peptides, which are relatively short peptides, are presented to CD8+ T cells.
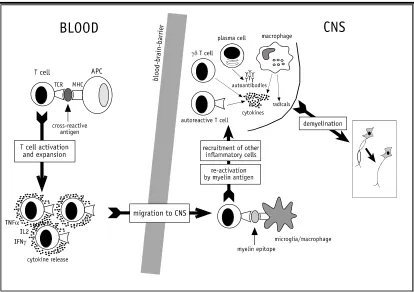
Hellings et al.52has provided a schematic overview of the current hypothesis on the
immunopathogenesis of MS (Figure 1). The first hypothetical event is the activation of myelin reactive T cells in the blood in the periphery, outside the CNS. This initial activation could be
triggered by“molecularmimicry”,bacterialorviralsuperantigensornon-specific mechanisms. According to the hypothesis of molecular mimicry, some foreign agents (including infectious and dietary agents) are comprised of peptides that mimic autoantigenic epitopes.53Upon
infection for example, presentation of those peptides in the periphery by infected antigen presenting cells may cross-activate autoreactive T cells. Bacterial or viral superantigens may also be able to activate autoimmune T cells, because they can activate T cells irrespective of their antigen specificity by crosslinking MHC class II molecules to a specific T cell receptor segment.54Lastly, non-specific mechanisms, such as the exposure to high local
concentrations of cytokines, secreted as a result of immune inflammatory responses to foreign invaders, could activate autoimmune T cells.55As mentioned above, activation of myelin
reactive T cells in the periphery is actually part of the normal T cell repertoire. They are found in similar frequencies in people with MS as well as in healthy controls.56, 57There is, however,
evidence that the frequency ofactivatedmyelin reactive T cells is significantly higher in peripheral blood from people with MS compared to controls with other neurological diseases after stimulation with for example myelin basic protein or myelin proteolipid protein,58-60
[image:27.595.128.542.429.721.2]indicating that myelin reactive T cells of MS patients exist in an in vivo activated state.
Figure 1. Current concepts of the multiple sclerosis pathogenesis.
TCR: T cell receptor; APC: antigen presenting cell; MHC: Major histocompatibility complex; CNS: central nervous system; TNF: Tumor necrosis factor; IL: Interleukin; IFN: Interferon.
Once these myelin reactive T cells are activated, they expand and traffic to the CNS by crossing the endothelial blood brain barrier.61The blood brain barrier includes vascular
endothelial barriers that separate blood within the brain from blood outside the brain and separates blood from cerebrospinal fluid. It provides a blocking function of substances that the brain does not require. Myelin reactive T cells are found in the cerebrospinal fluid of people with MS but not in patients with other neurological diseases.58Within the CNS, they are
thought to become reactivated once they encounter their specific myelin epitope presented by resident antigen presenting cells: microglia cells or perivascular macrophages.62
The reactivated T cells will locally produce proinflammatory cytokines such as TNF and IFN-
leading to the up-regulation of MHC class II molecules on astrocytes and microglia and adhesion molecules on the blood brain barrier endothelium. This will facilitate the further influx of T cells, B cells and macrophages, thus contributing to the amplification of the immune inflammatory response. Although T cells are though to be key players in the
immunopathogenesis of MS, autoantibodies produced by B cells such as plasma cells may also be involved. Demyelination will be the ultimate result of this vicious circle of events. Most probably, the myelin breakdown is brought about by the combined effects of cytotoxic cells (macrophages and-T cells), demyelinating autoantibodies, and cytokine-induced toxicity.49, 63-65Although the vast majority of T cells in MS plaques carry the-receptor (most CD4+
and CD8+T cells), a variable number of-T cells (1-10%) can also be found,15but their role
in MS remains enigmatic.66The degradation of the myelin sheath is the main event in MS and
proteins within the CNS myelin are considered to contain candidate antigens eliciting the pathogenic autoimmune responses. Possible candidate antigens are MOG, MBP, and proteolipid protein (PLP).
The fact that functional rather than quantitative differences exist between autoreactive T cell populations of MS patients and control subjects in the periphery may indicate that regulatory mechanisms which are responsible for controlling autoreactive T cells in normal conditions are impaired in MS. There is evidence of the existence of a peripheral regulatory T cell network that prevents uncontrolled expansion of potentially pathogenic T cells. The knowledge about the immunoregulatory mechanisms are partially based on T cell vaccination and T cell receptor vaccination studies in both animal models and MS. This experimental therapy is aimed at enhancing the regulatory networks to specifically suppress the circulating
autoreactive T cells. These studies showed evidence for the involvement of several immune cell types in the immunoregulatory T-T cell interactions: (a) anti-idiotypic T cells (cells that recognise T cell receptor related structures), (b) anti-ergotypic T cells (cells that recognise unknown markers commonly expressed by activate T cells), (c)-T cells, (d) natural killer cells, and (e) CD8+suppressor cells.52Thus, although the active role of regulatory T cells in
the pathogenesis of MS remains to be proven,66it is possible that an imbalanced regulatory
network could lead to the suboptimal suppression of activated pathogenic T cells, which may finally result in autoimmunity.52
2.9 MS
MORBIDITY IN TIME,
PLACE AND PERSONpoint to a role for genetic influences are: (1) a difference in morbidity rates in different racial groups and (2) the extent of familial clustering.
As mentioned before, Davenport8noted in 1922 that MS was more common among drafted
men in the northern states of the United States compared to the southern states, but inaccurate denominators could have influenced the estimates. The next report in 1950 reported that mortality rates were greater in temperate zones than in the tropics or sub-tropics and that the rates were higher in northern parts of the United States and Italy than in southern regions.9Other carefully designed studies confirmed this pattern.67In addition, MS prevalence
among United States veterans correlated well with latitude (r=0.76).14In 1975, Kurtzke
suggested that the distribution of MS prevalence could broadly be classified into bands of low, medium, and high prevalence.68, 69High risk (>30 per 100,000) was found throughout northern
Europe, the northern United States, Canada, southern Australia, and New Zealand; medium risk (5-30 per 100,000) was found in southern Europe, the southern United States and northern Australia; and low risk (<5 per 100,000) areas included Asia, South America, and many uncharted regions.68, 69Thus, regional differences were thought to be related to latitude
and studies were conducted to search for environmental factors that correlated with latitude.
Currently, over 400 publications are published on the prevalence of MS.1Although
comparison of the surveys is often difficult due to differences in diagnostic criteria, case ascertainment, and variability of the surveyed populations in terms of size, age structure, ethnic origin and composition, a number of observations can be made: (1) the increase of morbidity rates over time, (2) an increased awareness of the importance of genetic factors in the development of MS, and (3) the remaining importance of environmental factors in the development of MS. These observations will now be further discussed.
Systematic updating of prevalence and incidence rates showed that the absolute number of cases identified in different parts of the world has risen steadily since the 1950s.70The
question is whether this was partly due to a real increase, or that improved diagnosis and increased awareness fully accounted for the difference.70A study in a province of Italy
indicated that the increase in this location was partly due to a real increase and that a better diagnosis could not fully explain the difference.71In northern Sardinia (Sassari) a steady
increase in incidence rate was found from 2.0 per 100,000 (1968-1972) to 6.8 per 100,000 (1993-1997).71Over time, improvement in diagnosis would decrease the lag time between
symptomatic onset and diagnosis. When they compared the trend in lag time between symptomatic onset and diagnosis with another region in Italy (Ferrara), no differences were detected, but a clear difference in the incidence trend was observed between the two areas, with Ferrara having a much lower increase in incidence (1.4 fold) than Sassari (3.4 fold).71, 72
Therefore, although it is often difficult to separate true increases from increases due to diagnosis and awareness, there are locations such as northern Sardinia where the increase is thought to be partly real. Another study conducted in Newcastle, Australia, found a steady and significant rise in MS prevalence and incidence from 1961 to 1996.73Although there is the
possibility that a better case ascertainment contributed to the increase, the authors concluded that the homogeneity of the population studied on each occasion and the application of identical study methods suggests a true increase in prevalence, and that the increase in prevalence was attributed to an increased incidence in females and an increased survival in the MS population.73
the early seventies could also be partly explained by the distribution of ancestral
background.74Bulman and Ebers found a high correlation (r=0.73, p<0.01) between the rank
order of case control ratios among veterans in each state and the percentage of people with a Scandinavian origin in those states.74
The influence of genetic factors using prevalence data might be best assessed by comparing populations with different ethnic background within the same geographical location, limiting environmental confounding. For example, indigenous populations might be compared with groups that colonised the area. One limitation is that in many circumstances the way of life of the indigenous population is also substantially different from the population that colonised the region, so they differ not only genetically but also in their exposure to many environmental agents.75In addition, a uniform case ascertainment for both populations should improve the
interpretation of the results, but it is known that well-designed surveys are not always conducted in different sub-populations.75Lastly, a prevalence is a cross product of the
[image:30.595.68.451.296.578.2]incidence rate and duration of disease, and thus, differences in prevalence between regions and/or populations could also be attributed to differences in survival.
Figure 2. Distribution of MS (prevalence per 100,000) in Canada and the United States of America.(Data from Rosati (2001))
Region: study area, state (prevalence year)
Canada: NF, Newfoundland (1984); Ott, Ottawa, Ontario (1975); Lond, London and Middlesex County, Ontario (1984); Sask, Saskatoon, Saskatchewan (1999); Card, Cardston Region, southern Alberta (1988); Barr, Barrhead, Alberta (1990); Br C, British Columbia (1982).