Learning from Accidents: Analysis and Representation of Human
Errors in Multi-attribute Events
Raphael Moura
PhD Student, Institute for Risk and Uncertainty, University of Liverpool, UK
Michael Beer
Professor, Institute for Risk and Uncertainty, University of Liverpool, UK
John Lewis
Lecturer, Institute for Risk and Uncertainty, University of Liverpool, UK
Edoardo Patelli
Lecturer, Institute for Risk and Uncertainty, University of Liverpool, UK
ABSTRACT: Regardless of the evolution of engineering systems and fabrication methods, recent major accidents exposed the risk behind modern human economic activities to an inquiring and perplexed society. These events brought out the fact that interactions between complex systems, cutting-edge technologies and human factors may trigger particular accident sequences that are very difficult to predict and mitigate through traditional risk assessment tools. Thus, the purpose of this study is to overcome barriers to dealing with complex data by translating multi-attribute events into a two-dimensional visualisation framework, providing means to communicate high-technology risks and to disclose surrounding factors and tendencies that could lead to the manifestation of human errors. This paper first discusses the human error and human factors role in industrial accidents. The second part applies Kohonen’s self-organising maps neural network theory to an accident dataset developed by the authors, as an attempt to improve data exploration and classify information from past events. Graphical interfaces are then generated to produce further insight into the conditions leading to the human errors genesis and to facilitate risk communication among stakeholders.
1. INTRODUCTION
1.1.Perspectives on human errors
Human error is a term coined in numerous fields, such as engineering, management, design,
economics, psychology, sociology and
philosophy, for different purposes. From a general perspective, it can be commonly defined as a failure to perform a certain task that leads to
an adverse consequence, whereas the
understanding of the relationship between humans, tasks, technologies, organisations and the surrounding environment is usually called “Human Factors”. The growth of this applied discipline as a way to improve human reliability at work and enhance systems’ safety is closely associated with the development of human error studies and understanding. However, the
to define the cause (when accidents are said to be due to human error), the event (when an action, e.g. the early activation of a switch, is said to be a human error) or the consequence (when the outcome of the action is said to be an error, e.g. the driver made the error of fuelling with diesel instead of petrol, inferring a car malfunction). So, how can we communicate risks intimately associated with human performance, without a common ground regarding its definition, understanding and handling?
Notwithstanding this, Reason (2013) has recently reaffirmed his former definition for the term, emphasising three basic characteristics to define error: plans, actions and consequences, surrounded by two situational factors: intention and absence of chance interference (e.g. an act of God). This view is particularly useful to tie up two loose ends: firstly, the need for a common understanding of human error, a deeply rooted term in both technical and general public reality, serving as a useful bridge between the two worlds; and secondly, a clear and convenient definition, focused on the characteristics of the analysed subject and on the genesis of error, to facilitate communication among authorities, the general public and wider stakeholder groups.
1.2.Echoes from recent high-technology, multi-attribute accidents
The significance of human factors to industrial domains was extensively highlighted by current studies. Graeber (1999) portrayed human error as a major contributor to more than 70% of commercial airplane hull-loss accidents. According to Dhillon (2007), the United Kingdom Protection and Indemnity (P&I) Club reported costs of US$541 million per year for the marine industry due to human error.
Likewise, the chairman of the independent
investigation commission appointed to
investigate the Fukushima nuclear disaster that occurred in March 2011, Mr. Kiyoshi Kurokawa, during the presentation of his final report, pointed out that the tsunami was not the sole cause of the accident, regarding cultural issues and human factors as vital contributing factors (Kurokawa et al, 2012): "What must be admitted – very
painfully – is that this was a disaster 'Made in Japan'. Its fundamental causes are to be found in the ingrained conventions of Japanese culture (…). Therefore, we conclude that the accident was clearly 'man-made'”.
Undoubtedly, this accident triggered a worldwide commotion, and the information released to the general public caused Japanese public opinion and the international community to perceive the nuclear industry as unsafe.
It is important to notice that the interaction between operators, technology and organisation is also a common issue during the information release from investigations of high-technology accidents. The final report of the Bureau d’Enquêtes et d’Analyses pour la sécurité de l’aviation civile (2011) on the AF-447 Rio-Paris flight accident described an apparently simple equipment defect (i.e. ice blockage of the Pitot probes) due to a design failure, resulting in an inconsistency of speed parameters. This deficiency triggered several human-related events (wrong system diagnosis and inappropriate control inputs, among others) which led to 228 fatalities and the loss of the Airbus A-330 in 1st June 2009. Besides, this emblematic investigation report has also stressed some features such as the de-structuring of the task-sharing during the response to the abnormal event, the lack of training in manual aeroplane handling in high altitudes, and the absence of a clear display of the airspeed inconsistencies in the cockpit, exposing an intricate combination of factors leading to the disaster.
The examples above highlight the
Therefore, this work aims to overcome barriers to dealing with complex data by means of applying an unsupervised learning neural network algorithm to an accident dataset developed by the authors, generating two-dimensional graphical representations of the multi-attribute events. The graphical interface will provide innovative means to communicate high-technology risks and to disclose surrounding factors and tendencies that could lead to the manifestation of human errors.
2. DATA SOURCE AND ANALYSIS
METHOD
2.1.The Accidents Database - Multi-attribute Technological Accidents Dataset (MATA-D)
Complex industrial accidents are multi-attribute events, and many specific interactions are necessary to generate undesirable consequences. These attributes are usually exposed after laborious and sensitive investigations following serious events, the reports from which can be considered a very important source of accidents data. However, despite the considerable number of institutions responsible for investigating accidents and issuing recommendations to minimise the possibility of similar occurrences, the unavailability of a suitable dataset on human performance to consolidate data and promote profounder predictions is a significant bottleneck
highlighted by Swain (1990) and the
International Atomic Energy Agency (1990), among other academic and professional institutions. Attempts to reduce this bottleneck, such as the CORE-DATA database developed by Gibson and Megaw (1999), have not prospered so far, due to several complications, e.g. accessibility, taxonomy limitations and updating issues.
To overcome these issues and assuming that one of the primary methods to better understand multi-attribute events is to analyse data from past accidents, a Multi-attribute Technological Accidents Dataset (MATA-D) was developed by the authors, to highlight common features and reveal comparable conditions under which serious accidents may occur. Major accident
reports from numerous industrial sectors were classified under a common framework based on Hollnagel’s (1998) Cognitive Reliability and Error Analysis Method (CREAM) taxonomy, which allows up to 53 different attributes per event. Further data collection and usage restrictions, as well as an extensive description of CREAM are widely explored by Moura et al (2015). Currently, the MATA-D contains 216 industrial accidents.
2.2.Data clustering using Self-Organizing Maps
A well-stablished clustering method has been applied in this work in order to support the data exploration process and to disclose relevant associations within the MATA-D multi-attribute dataset. Self-Organizing or Kohonen’s Map (SOM) is an unsupervised learning neural network algorithm created by Teuvo Kohonen, which provides simplified visualisation (usually two-dimensional) of multi-dimensional data, in a way that similar models are mutually attracted and associated with adjacent grid nodes in a topographic map.
Basically, the network is trained with the definition of the best matching unit (BMU) in the output space, defined as the one that minimises the Euclidean Distance ‖ − ‖ between each
input pattern x and output node mi (Eq. (1)).
= arg min
Ω‖ − ‖ (1)
A neighbourhood function hci will define the
spatial influence of the BMU, attracting adjacent nodes to the BMU in the output space, and all the neighbours nodes will be successively updated following the Eq. (2). This sequence will be repeated (through iterations) until the map converges (Kohonen, 2001).
+ 1 = +∝ ℎ − (2)
The fact that SOM’s learning process is designed not to be affected by external influence can be extremely helpful in this specific research, as it avoids potentially biased concepts and prevents excessively subjective interpretations during the analysis of circumstances which leads to the genesis and perpetuation of human errors.
3. THE MATA-D EXPLORATION USING
SELF-ORGANISING MAPS
3.1.SOM Input Data
As an attempt to go beyond data statistical analysis and gain further insight into the relationship among contributing factors leading to accidents, the Self-Organising Maps was applied in this work, using the MATA-D as input data.
According to Kohonen (2013), the usage of a variant of the Eq. (2) updating rule is recommendable for practical applications, to eliminate convergence complications and generate steadier asymptotic mi values.
Consequently, he developed the batch-learning version of SOM (Batch-SOM) expressed in Eq. (3), which will be applied in the current dataset, to generate more robust results.
∗= ∑ ! !"!#&&&$%
∑ ! !"!# (3)
Therefore, in the practical case, the learning factor ∝ was no longer necessary, with the codevectors being updated once, rather than in a recursive fashion. Each ∗ is the centroid of the influence region defined by (' (the mean value of x(t)), the neighbourhood function and the number of samples )*.
Maps were generated from the 216 records with 49 attributes each, as four CREAM categories were not found in any event, i.e. Cognitive Style, Sound, Humidity and Other. The width of the kernel (the radius of the neighbourhood function) was 0.75, and the output space was trained with 84 batches.
3.2.SOM Results
The expert version of Viscovery® SOMine software was used to produce maps and enhance graphical visualisation. A quality measurement
[image:4.612.317.560.140.311.2]for different cluster numbers, which indicated the chosen grouping as a possibly good clustering (highest quality indicator factor), was used to favour the resulting arrangement shown in Figure 1.
[image:4.612.315.560.323.733.2]Figure 1: SOM Clustering Results
Table 1: Clusters main characteristics
Cluster Events #
Factors #
Min Max Mean Median Mode
C1 50 04 19 08.6 08 08
C2 52 01 11 04.3 04 04
C3 53 01 05 02.7 03 02
C4 36 05 20 09.4 09 09
C5 25 06 24 11.3 10 10
Table 2: Factors incidence per cluster
Factor C1 C2 C3 C4 C5
Wrong Time 0.380 0.058 0.019 0.028 0.320
Wrong Type 0.260 0.173 0.019 0.083 0.080
Wrong Object 0.020 0.038 0.000 0.056 0.000 Wrong Place 0.060 0.288 0.000 0.528 0.840
Observation missed 0.260 0.154 0.019 0.000 0.440
False Observation 0.000 0.000 0.000 0.028 0.160
Wrong Identification 0.020 0.000 0.000 0.056 0.120
Faulty diagnosis 0.160 0.038 0.000 0.111 0.560
Wrong reasoning 0.200 0.038 0.000 0.278 0.160
Decision error 0.120 0.154 0.000 0.028 0.160
Interpretation delay 0.080 0.038 0.000 0.056 0.120
Incorrect prediction 0.060 0.019 0.000 0.111 0.000
Inadequate plan 0.160 0.096 0.019 0.028 0.240
Priority error 0.140 0.115 0.000 0.028 0.040
Memory failure 0.000 0.038 0.000 0.000 0.000
Fear 0.020 0.019 0.019 0.000 0.080
Distraction 0.040 0.019 0.000 0.028 0.400
Fatigue 0.040 0.000 0.000 0.028 0.160
Perform. variability 0.000 0.000 0.000 0.000 0.120
Inattention 0.020 0.019 0.000 0.000 0.120
Physiological stress 0.000 0.019 0.000 0.028 0.000 Psychological stress 0.020 0.038 0.000 0.056 0.080
Functional impairmt. 0.020 0.000 0.000 0.000 0.000
Cognitive bias 0.100 0.038 0.000 0.083 0.280
[image:4.612.315.559.346.730.2]Poor procedure 0.440 0.423 0.038 0.778 0.840
Access limitations 0.000 0.000 0.000 0.028 0.080
Ambiguous info 0.060 0.000 0.000 0.028 0.080
Incomplete info 0.200 0.058 0.000 0.167 0.440
Access problems 0.020 0.000 0.000 0.056 0.040
Mislabelling 0.000 0.019 0.019 0.028 0.000 Communic. Failure 0.260 0.038 0.019 0.056 0.240
Missing information 0.200 0.135 0.057 0.583 0.080
Maintenance failure 0.420 0.058 0.283 0.833 0.280
Poor quality control 0.820 0.173 0.472 0.972 0.720
Managemt. problem 0.180 0.019 0.019 0.194 0.160
Design failure 0.860 0.423 0.472 0.833 0.760 Poor task allocation 0.620 0.577 0.132 0.972 0.920
Social pressure 0.000 0.058 0.000 0.222 0.160
Insufficient skills 0.720 0.212 0.057 0.361 0.720
Insuffic. knowledge 0.600 0.154 0.057 0.639 0.400
Temperature 0.020 0.000 0.019 0.000 0.040
Illumination 0.000 0.000 0.000 0.056 0.000
Adv. ambient cond. 0.040 0.173 0.075 0.056 0.000
Excessive demand 0.020 0.077 0.000 0.056 0.200
workplace layout 0.020 0.038 0.000 0.028 0.080
Poor team support 0.040 0.019 0.000 0.056 0.120
Irreg. working hours 0.020 0.000 0.000 0.056 0.240
Table 1 summarises the main characteristics of the generated clusters, while Table 2 presents factors frequency results (minimums in italic, maximums in bold) per cluster.
4. DISCUSSION AND CONCLUSIONS
4.1.Clustering Interpretation
The first cluster comprises 50 accidents, 23.28% of the dataset. Design Failure (86%) highest incidence is grouped with two specific execution factors, Wrong Time and Wrong Type, which attained their maximum clustering values (38% and 26%, respectively), indicating that in-built design deficiencies seem to have prompted basic execution errors (timing, duration, force, distance/magnitude, speed or direction).
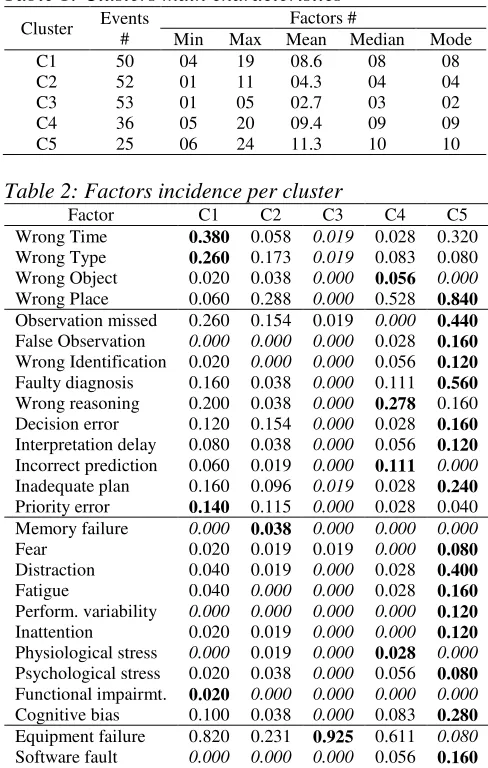
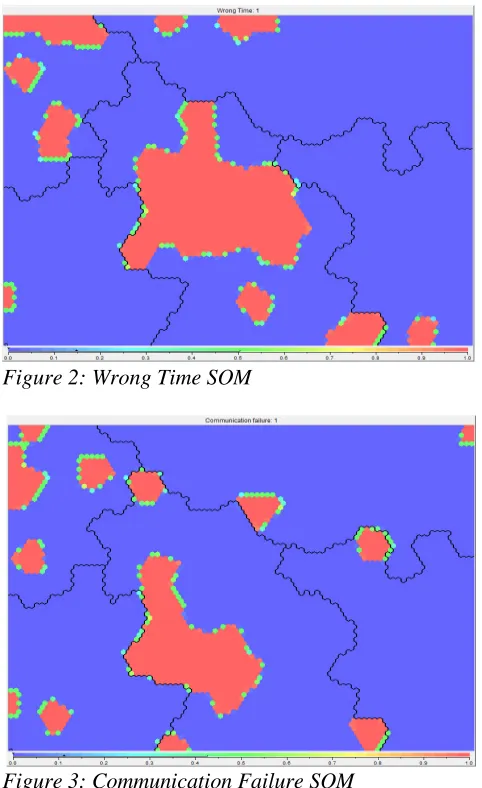
A specific cognitive function related to planning, namely Priority Error, showed strong similarity with the Wrong Type execution factor, while Communication Failure (26%) was linked to the Wrong Time factor. Also, the significance of the organisational factor Insufficient Skills can be highlighted, which reached its maximum figures (72%). An example of graphical analysis of the isolated factors’ SOM is shown through the comparison between Figures 2 and 3, where the relationships above mentioned can be
depicted, providing further support to risk communication.
[image:5.612.55.296.65.304.2]Figure 2: Wrong Time SOM
Figure 3: Communication Failure SOM
[image:5.612.316.557.98.492.2]with the findings depicted in the Figures 2 and 3 above.
The Adverse Ambient Conditions factor attained its maximum level in Cluster 2 (17.3%), and the analysis leads to an association with Design Failure and Equipment Failure. For this group, design seems to have failed to cope with foreseeable adverse ambient conditions, resulting in some kind of equipment failure.
Accidents within cluster 3 are strongly characterised by the Equipment Failure technology factor, with 92.5% of frequency. However, the grouping shows 53 accidents encompassing one to five factors, with low mean, median and mode values. It means that the majority of accidents have limited identified factors leading to the undesirable outcome. Fundamentally, the main finding which can be extracted from the analysis is that Inadequate Quality Control and Design Failure are more associated with Equipment Failure (and to be regarded as its cause) than a Maintenance Failure. Although further assumptions regarding this group might be unsupported, due to the low amount of straight recognisable relationships among features, it is possible to suggest that some strong evidence found during an accident investigation (such as an equipment failure) may influence the event’s examination process as a whole (being considered the main or direct cause) and override the search for further underlying causes.
Cluster 4 is largely dominated by the Inadequate Quality Control (97.2%), Inadequate Task Allocation (97.2%) and Maintenance Failure (83.3%), being also apparent a high frequency of the Design Failure factor, with 83.3% of incidence. Insufficient Knowledge (63.9%) and Missing Information (58.3%) reached their maximums, and Permanent Interface technological problems (Access Problems and Mislabelling) related to design are noticeable too.
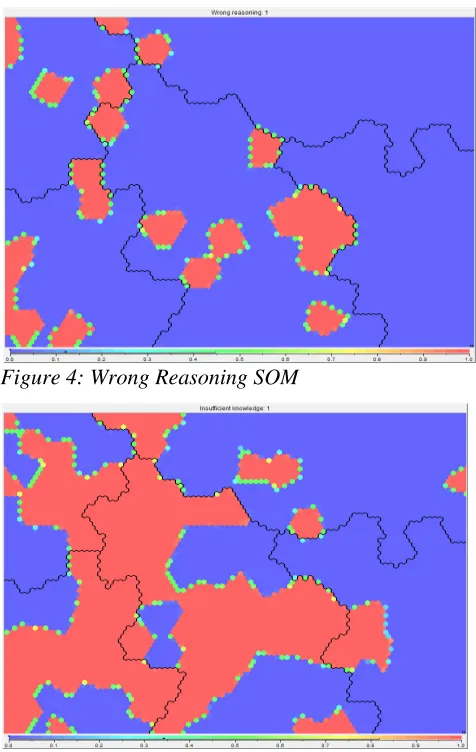
Specific cognitive functions related to interpretation (Wrong Reasoning and Incorrect Prediction) are strongly associated to the Insufficient Knowledge factor, emphasising a lack of understanding of the current situation or
[image:6.612.317.555.232.608.2]being not certain about the action that should be performed. The Missing Information factor high incidence means that information provided by organisations within the group is generally lacking, incorrect or misunderstood. Hence, communication issues seem to have poisoned these organisations, being largely reflected by the Inadequate Task Allocation, Inadequate Quality Control and Maintenance Failure maximum figures, and disclosing an asynchrony between organisation of work, task planning, managerial rule and the information available.
Figure 4: Wrong Reasoning SOM
Figure 5: Insufficient Knowledge SOM
the existing structural protection level when full or abrupt flight control inputs are made at airspeeds below the manoeuvring speed (Insufficient Knowledge) and the first officer associated wake turbulence encounters with the need for aggressive roll upset recovery techniques (Wrong Reasoning, i.e. deduction error).
Cluster 5 shows a very robust presence of the Wrong Place erroneous action factor, with 84% of frequency. This sequence factor is combined with all three categories of cognitive functions: (i) Observation (Observation Missed, False Observation and Wrong Identification); (ii) Interpretation (Faulty Diagnosis, Decision Error and Delayed Interpretation) and (iii) Planning (Inadequate Plan), in addition to the highest incidence of Temporary and Permanent Person Related Functions.
Consequently, this cluster is indisputably the most significant in terms of human-related features and it is intensely associated with Technology issues, especially Inadequate Procedure (84%) and Incomplete Information
(44%) as well as Working Conditions
organisational factors, which were all significant for this group.
These features indicate that deficient technology information (from interface – warnings, alarms and indications – and from procedures – ambiguous, incomplete, incorrect or mismatched with reality) required for the safe operation of systems boosted difficulties to identify signals, events or measurements which should have prompted a suitable action. As a result, the wrong system diagnosis led to a wrong action sequence issue (omission, jump forward, jump backwards and extraneous actions).
4.2.Final Remarks
The possibility of reducing a 216-event dataset with 49 attributes each to a two-dimensional map is a noteworthy feature taken from the SOM algorithm, which permitted the translation of extremely intricate data into a friendly interface to communicate high-technology risks to stakeholders, support findings and assist the decision-making process. Furthermore, the usage
of a techno-social framework such as the Cognitive Reliability and Error Analysis Method to organise and create the MATA-D dataset, followed by a mathematical method to explore data and disclose surrounding factors and tendencies, provided a very useful common ground for cross-disciplinary understanding of risks and allowed the visualisation and interpretation of case studies from the real world.
Clustering and nodal analysis indicated that design must anticipate the skills and knowledge level that should be required from operators,
possibly providing some training
recommendations to minimise interpretation and mental planning issues leading to execution errors. Skills are usually linked to practical experience, thus setting up on-the-job trainings with senior instructors seems to be a reasonable alternative. Relevant technology information (from interface and procedures) must be identified and assessed in terms of adequacy, focusing on how some missing information could induce erroneous human actions or inhibit correct actions during operations, directing at arrangements prone to be affected by sequence issues. The establishment of a specific method to maintain communication channels, to improve the message format and to timely deliver the required information is vital for the organisation of work, task planning and managerial rule. Also, the quality of accident investigations involving equipment failures is an issue that deserves additional attention by managers. A strong indication (e.g. an equipment failure) might induce a biased conception from investigators towards a final conclusion, without further reflection concerning deeper underlying causes and contributing factors. Those conclusions from the dataset are naturally visualised and communicated with the use of a graphical interface, considering that the algorithm has perfectly conserved the input factors in the output space, allowing further interpretation of isolated factors.
4.3.Future Developments
human-related features and other dataset relevant factors which figured frequently, such as inadequate quality control, equipment failure, inadequate task allocation and training, indicating a pathway for further investigation. Future research could also focus on the usage of graphical methods to communicate risks to specific stakeholder groups, such as the workforce – as a tool to improve awareness and allow them to recognise potentially hazardous patterns – or the general public, to depict past accident data in an approachable way and reduce information asynchronies.
Furthermore, other datasets such as the ASRS (Aviation Safety Reporting System) could be solely used or integrated with the MATA-D to produce further insight.
5. ACKNOWLEDGEMENTS
The authors gratefully acknowledge the insights from Dr. Franz Knoll (NCK Inc.). This study was partially funded by CAPES (Proc. nº 5959/13-6).
6. REFERENCES
Araujo, A. F. R. & Rego, R. L. M. E. (2013) ‘Self-organizing maps with a time-varying structure’ ACM Computing Surveys, 46, No 1, October, pp. 7:1-7:38.
Bureau d’Enquêtes et d’Analyses pour la sécurité de l’aviation civile (2011) Final Report on the accident on 1st June 2009 to the Airbus
A330-203 [Online]. Available from:
http://www.bea.aero/docspa/2009/f-cp090601
.en/pdf/f-cp090601.en.pdf (Accessed: 06
November 2014).
Cottrell, M. et al. (2009) ‘Fault Prediction in Aircraft
Engines Using Self-Organizing Maps’,
Príncipe, J.C. and Miikkulainen, R. (Eds): Proceedings of the 7th International Workshop, WSOM 2009, 8-10 June 2009, St. Augustine. Berlin: Springer-Verlag Berlin Heidelberg, pp. 37-44.
Cullen, W. (1990) The public inquiry into the Piper
Alpha disaster. London: Her Majesty's
Stationery Office (HMSO).
Dhillon, B. (2007) Human reliability and error in transportation systems. London: Springer-Verlag
Gibson, W. & Megaw, T. (1999) The implementation of CORE-DATA, a computerised human error probability database. Suffolk: HSE Books. Graeber, C. (1999) ‘The Role of Human Factors in
Aviation Safety’, AERO magazine, QTR_04
1999, pp. 23-31.
Hammer, B., Gisbrecht, A. & Schulz, A. (2013) ‘How to Visualize Large Data Sets?’, Estévez, P.A., Príncipe, J.C. & Zegers, P. (Eds): Proceedings
of the 9th International Workshop, WSOM
2012, 12-14 December 2012, Santiago. Berlin: Springer-Verlag Berlin Heidelberg, pp. 1-12. Hollnagel, E. (1998) Cognitive Reliability and Error
Analysis Method. Oxford: Elsevier Science Ltd. International Atomic Energy Agency (1990) ‘Human Error Classification and Data Collection’, Report of a technical committee meeting organised by the IAEA, 20-24 February 1989, Vienna. Vienna: INIS Clearinghouse.
Kohonen, T. (2001). Self-Organizing Maps. 3rd ed. Berlin: Springer.
Kohonen, T. (2013) ‘Essentials of the self-organizing map’, Neural Networks, 37, pp. 52-65. Elsevier.
Kurokawa, K. et al. (2012)The Official Report of The
Fukushima Nuclear Accident Independent Investigation Commission - Executive Summary [Online] Tokyo: The National Diet of Japan.
Available from:
https://www.nirs.org/fukushima/naiic_report.pd
f (Accessed: 6 November 2014).
Moura, R. et al. (2015) ‘Human error analysis: Review of past accidents and implications for improving robustness of system design’, Nowakowski, T. et al. (Eds), Proceedings of the 24th European Safety and Reliability Conference, 14-18 September 2014, Wroclaw. London: Taylor & Francis Group, pp. 1037-1046.
National Transportation Safety Board - NTSB (2004) In-Flight Separation of Vertical Stabilizer - American Airlines Flight 587 - Belle Harbor, New York, November 12, 2001 - Airbus Industrie A300-605R Aircraft Accident Report. Springfield: National Technical Information Service.
Reason, J. (2013) A Life in Error: From Little Slips to Big Disasters. Farnham: Ashgate Publishing Ltd.