'ESE GEMEENSCHAPPEN DET STATISTISKE DEPARTEMENT FOR DE EUROPÆ ISKE FÆ LLESSKABER OFFICE STATISTIOUE DES COMMI IAUTES EUROPEENNES STATISTICAL OFFICE OF THE EUROPEAN COMMUNITIES STATISTISCHES AMT OER EUROPAISCHEN GEMEINSCF *FTEN ISTITUTO STATISTICO OELLE COMUNITÀ EUROPEE BUREAU VOOR DE STATISTIEK DER EUROPESE GEMEENSCHAPPEN DET S" R DE EUROPÆ ISKE F Æ LLESSKABER OFFICE STATISTIOUE DES COMMUNAUTES EUROPEENNES STATtST ¡AL OFFICE OF THE EUROPEAN COMMUNITIES STATISTISCHES AMT DER EUROPAISCHEN GEMEINSCHAFTEN ISTITUTO STATISTICO DEL E COMUNITÀ EUROPEE BUREAU VOOR DE STATISTIEK DER EUROPESE GEMEENSCHAPPEN DET STATISTISKE DEPARTEMENT FOR DE JROPÆ ISKE FÆ LLESSKABER OFFICE STATISTIOUE DES COMMUNAUTES EUROPEENNES STATISTICAL OFFICE OF THE EUROPEAN CC ■ riSCHES AMT DER EUROPAISCHEN GEMEINSCHAFTEN ISTITUTO STATISTICO DELLE COMUNITÀ EUROPEE BUREAl YOOR DE STATISTIEK DER EUROPESE GEMEEN5CHAPPEN DET STATISTISKE DEPARTEMENT Γ OR DE EURQPÆJSjtE_£ÆJA^SSKABER_^ ÍFFICE STATISTIOUE DES C O M M l [ H
DER EUROPAISCHEN GEMEIN ■ . ^ ^ ^ ^ ^ ^ ^ ^ ^ ^ ^ ^ ^ ^ ^ ESL GEMEENSCHAPPEN DET
JAUTES EUROPEENNES STAT TITUTO STATISTICO TATISTISKE DEPARTEMENT FOR ICAL OFFICE OF THE EUROPEAN E COMUNITÀ EUROPEE BURE UROPÆ ISKE FÆ LLESSKABER «(UNITIES STATISTISCHES AM )OR DE STATISTIEK DER EUROI tiQUE DESCOMMUI ( EUROPAISCHEN GEMEINSCHAI ÌEMEENSCHAPPEN DET STATIS|
ï EUROPEENNES CE OF THE EUROPEAN COMMUNITIES
eurostat
UROPÆISKE FÆLLESSKABER OFFICE STATISTIQUE DES C O M M I IMMUNITIES STATISTISCHES AMT DER EUROPAISCHEN GEMEINSC U VOOR DE STATISTIEK DER EUROPESE GEMEENSCHAPPEN DET í OFFICE STATISTIOUE DES COMMUNAUTES EUROPEENNES STATISI DER EUROPAISCHEN GEMEINSCHAFTEN ISTITUTO STATISTICO DEI SE GEMEENSCHAPPEN DET STATISTISKE DEPARTEMENT FOR DE UTES EUROPEENNES STATISTICAL OFFICE OF THE EUROPEAN CO* EN ISTITUTO STATISTICO DELLE COMUNITÀ EUROPEE BUREAU \ Ì T I S K E DEPARTEMENT FOR DE EUROPÆ ISKE FÆ LLESSKABER OF OFFICE OF THE EUROPEAN COMMUNITIES STATISTISCHES AMT DE
STATISTISCHES AMT OER EUROPAISCHEN GEMEINSCHAFTEt* OMUNITA EUROPEE BUREAU VOOR DE STATISTIEK DER EUROPESE GEMEENSCHAPPEN D E T STATISTISKE DEPARTEMENT FOR DE EURO! ÎUE DES COMMUNAUTES EUROPEENNES STATISTICAL OFFICI MPEAN COMMUNITIES STATISTISCHES AMT DER EUROPAISCHEN GEMEINSCHAFTEN ISTITUTO STATISTICO DELLE COMUNIT BUREAU VOOR OE STATISTIEK DER EUROPESE GEMEENSCHAPPEN DET STATISTISKE DEPARTEMENT FOR DE EUROPÆ ISK .UE DES COMMUNAUTES EUROPEENNES STATISTICAL OFFICE OF THE EUROPEAN COMMUNITIES ■ STATISTISCHES AMT DER EUROPÄISCHEN GEMEINSCHAFTEN ISTITUTO STATISTICO DELLE COMUNITÀ EUROPEE BUREAU VOOR DE STi I EUROPESE GEMEENSCHAPPEN DET STATISTISKE DEPARTEMENT FOR DE EUROPÆ ISKE FÆ LLESSKABER OFFICE STATIST QUE DES COMMUNAUTES EUROPEENNES STATISTICAL OFFICE OF THE EUROPEAN COMMUNITIES STATISTISCHES AMT DER EUROPAIÍ : H E N GEMI r TUTO STATISTICO DELLE COMUNITÀ EUROPEE BUREAU VOOR DE STATISTIEK DER EUROPESE GEMEENSC ^ P P E N DET STATISTISKE DEPARTEMENT FOR DE EUROPt ISKE F * LLESSKABER OFFICE STATISTIQUE DES COMMUNAUTES EUROPE
BASIC STATISTICS
OF THE COMMUNITY
Comparison with some European countries,
Canada, the United States of America, Japan
rea
eurostat
STATISTISCHES AMT DER EUROPÄISCHEN GEMEINSCHAFTEN STATISTICAL OFFICE OF THE EUROPEAN COMMUNITIES OFFICE STATISTIQUE DES COMMUNAUTÉS EUROPÉENNES ISTITUTO STATISTICO DELLE COMUNITÀ EUROPEE
BUREAU VOOR DE STATISTIEK DER EUROPESE GEMEENSCHAPPEN
Luxembourg, Centre Europeen. Boîte pönale 1907 T e l 47 941 Tele« Comeur Lu 3 * 2 3
1049 Bruxelles, Bâtiment Betlaymont. 200. rue de la Lo· (Bureau de liaison! Tel 7 3 5 8 0 4 0
Denne publikation kan l ä ; gennem de «algssiede'. som er nasvnt ρ Λ bagsiden al dette h.rlie
Diese Verollenilichung ist beiden auf der Ruck sei le des E inbands aufgeführten Vertnebsitellen erhältlich
This publication is obtainable from the sales agents mentioned on the back of the cover
Pour obtenir cette publication, prière de s'adresser aux bureaux de vente dont les adresses sont indiquées ai
Per ottenere Questa pubblicazione. Si prega d i rivolgersi agli uffici d i vendita ■ cui indirizzi sono indicati sul dorso della copertina
OF THE COMMUNITY
Comparison with some European countries, Canada, the United States of America, Japan
and the Union of Soviet Socialist Republics
Fourteenth edition
0 nil
0* datum less than half the unit used
0.0* datum less than half the last decimal place used not available
Φ uncertain or estimated estimate made by Eurostat < less than
DM German marks Ffr French francs Lit Italian lire Fl Guilders Fb Belgian francs Fix Luxembourg francs C Pounds sterling Dkr Danish crowns $ Dollars Dr Drachma Lt Turkish lire Nkr Norwegian crowns Skr Swedish crowns Sfr Swiss francs Sch Schillings (Austrian) Esc Escudos Mkf Finnish markka Pes Pesetas R Roubles GDP Gross domestic product AA Agricultural Area
EUROSTAT Statistical Office of the European Communities EC European Communities
ECSC European Coal and Steel Community
EUR-6 Total of the six first member countries of the EC EUR-9 Total of member countries of the EC
OECD Organization for Economic Cooperation and Development UN United Nations
ILO International Labour Office FAO Food and Agriculture Organization
AOM Overseas States, territories and departments associated with the EC UIC International Union of Railways
IATA International Air Transport Association
CST Statistical and Tariff Classification for International Trade NACE General Nomenclature of Economic Activities in the European
Table Page
I.POPULATION
1 Area, population, density per sq. kilometre and estimated population growth 11
2 Population by age and sex (Ό00) 12 3 Population by age and sex (% of total) 13 4 Births, marriages and deaths 14 5 Size of private households 15
II. LABOUR FORCE
6 Civilian labour force by occupational status (Ό00) 16 7 Civilian labour force by occupational status (%) 17 8 Civilian employment by main sectors of economic activity ('0001 18
9 Civilian employment by main sectors of economic activity (%) i g
10 Trends in unemployment 20
III. NATIONAL ACCOUNTS
11 Gross domestic product at market prices 21 12 Volume indices of gross domestic product at market prices 22
13 Annual rates of growth of gross domestic product at market prices —
1964 - 1974 at constant prices 23 14 Gross domestic product at market prices by branch (%) 24
15 Cost-structure of gross domestic product at market prices (%) 25 16 Use of gross domestic product at market prices (%) 26 17 Use of gross domestic product at market prices (Mrd Eur) 27 18 Gross fixed capital formation by products (%} 28 19 Taxes and actual social contributions 29
IV. RESEARCH AND EDUCATION
20 Number of pupils and students 30 21 Number of pupils and students by level 32 22 Pupils and students of the third level (full-time education) 33
V. AGRICULTURE
24 Principal categories of land use 35 25 Use of agricultural area 36 26 Agricultural holdings of 1 ha and over by size groups 38
27 Agricultural area (AA) on holdings of 1 ha and over by size groups 40
28 General survey on agriculture 42 29 I ndices of agricultural output 44 30 Production of cereals 45 31 Production of selected agricultural commodities 46
32 Livestock 47 33 Meat supply balance sheet 48
34 Meat production 50 35 Milk production, milk products and eggs 51
36 Yields of some principal crops from arable land 52
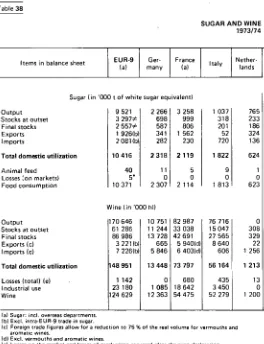
37 Cereal supply balance sheet 54 38 Sugar and wine supply balance sheets 56
39 Degree of self-sufficiency 58 40 Manpower, machinery, fertilizers 60
41 Agricultural accounts 62 42 Agricultural accounts - volume index-numbers 64
43 Forestry accounts 65 44 Forestry accounts — volume index-numbers 66
45 Wooded area and timber production 67
V I . ENERGY
46 Production of primary energy products 68 47 Production of primary energy 69
48 Energy trade 70 49 Gross inland consumption of primary energy products and equivalents . . . 71
50 Inland consumption of primary energy products and equivalents 72 51 Part of different sources of primary energy in gross inland consumption . . 73
52 Degree of dependence on foreign supply 74
53 Coal - total output 75 54 Coal - Lignite - Coke oven coke 76
55 Crude oil 77 56 Production of petroleum products 78
57 Petroleum products — total production 80 58 Natural gas - production 1960-1974 81
59 Natural gas - 1974 82 60 Maximum output capacity of power stations 83
61 Electrical energy — total net production 84 62 Electrical energy — net production by sources of energy 85
V I I . INDUSTRY
65 Output of iron ore 88 66 Production of copper, lead and zinc ores, bauxite and potash 89
67 Production of pig iron, steel and finished rolled products 90
68 Production of crude steel 91 69 Consumption of steel per head of population 92
70 Production of aluminium, copper, lead, zinc and tin 93 71 Production of cement and building bricks 94 72 Production of certain basic chemicals 95 73 Chemicals: production of ammonia, fertilizers and plastics 96
74 Production of man-made fibres 97 75 Spindles and looms installed 98 76 Motor vehicles, production and assembly 99
77 Merchant vessels under construction and launched 100
78 Production of tobacco 101 79 Production of cotton and woollen yarns and fabrics 102
80 Production of wood pulp, paper and board 103 81 General indices of industrial production 104 82 Building: number of dwellings completed 105
V I I I . TRANSPORT
83 Railways: length of line, passenger-kilometres and ton-kiiometres 106
84 Rail freight traffic 107 85 Inland waterways 108 86 Civil aviation 109 87 Merchant fleets 110 88 Merchant shipping - International traffic 111
89 Length of road network by administrative categories 112 90 Goods transport between the Community-countries (EUR-61 113
IX. E X T E R N A L T R A D E
92 Total imports 116 93 Total exports ι ,8
94 Volume index of external trade — imports extra EC 120 95 Volume index of external trade - exports extra EC 121
96 Balance of trade 122 97 Imports from member countries of EC (EUR-9) 124
98 Exports to member countries of EC (EUR-9) 125
99 Intra-Community trade 126 100 Total imports by area of origin (Mio Eur) 127
101 Total imports by area of origin (%) 128 102 Total exports by area of destination (Mio Eur) 129
103 Total exports by area of destination (%) 130 104 Imports by groups of products (Mio Eur) 131 105 Imports by groups of products (%) 132 106 Exports by groups of products (Mio Eur) I33 107 Exports by groups of products (%) I34 108 External trade figures of EC and other countries I35
109 EC (EUR-9) share in imports by main non-EC countries 136 110 EC (EUR-9) share in exports by main non-EC countries I37
X. EARNINGS AND HOURS OF WORK
111 Index of wages in industry 138 112 Hourly labour-cost for manual workers in industry 139
113 Average hourly gross earnings 140 114 Hourly labour cost for manual workers in industry 144
115 Monthly labour cost for employees in industry 146 116 Hourly labour cost in industry (manual workers + employees) 148
117 Average weekly hours of work offered per manual worker 150
X I . SOCIAL ACCOUNTS
118 General account of social protection. 1 -expenditure 154 119 General account of social protection. 2 - receipts 156
120 Function of social benefits 158 121 Sources of receipts 160 122 Social security benefits per head (Total population) 162
123 Social security benefits per head (Persons aged 15-64) 163 124 Social security expenditure as percentage of gross domestic product at
X I I . STANDARD OF LIVING
125 Nutritional value of food consumption 165 126 Consumption of selected vegetable products 166 127 Consumption of selected animal products 167 128 Consumption of energy and stiel per head of population 168
129 Motor vehicles in use 169 130 Television sets and telephones in use 170
131 Health services 171
X I I I . PRICES
132 Wholesale price index 172 133 Consumer price index 173
XIV. FINANCE
134 Conversion rates in Eur 174 135 Balances of payments by main heading 176
136 Central government debt 178 137 Money market rates 179 138 Money supply (in Eur) 180 139 Money supply (in national currencies) 181
140 Financial market rates 182 141 Index of share prices 183 142 Gross reserves in gold and convertible currencies 184
143 Official gross reserves of gold and convertible currencies 185 144 International Monetary Fund positions (IMF) 186
XV. REGIONAL POPULATION A N D GROSS DOMESTIC PRODUCT 145 Area and population
146 Area and population 147 Area and population 148 Area and population 149 Area and population 150 GDP at market prices 151 GDP at market prices 152 GDP at market prices 153 GDP at market prices 154 GDP at market prices 155 Origin of GDP at market prices 156 Origin of GDP at market prices 157 Origin of GDP at market prices 158 Origin of GDP at market prices 159 Origin of GDP at market prices
X V I . ADDITIONAL FIGURES FOR IRON AND STEEL INDUSTRY AND MINING 160 Personnel employed in the Community's coal-mining, iron-mining and iron
and steel industries 206 161 Supply of iron ore in the Community (EUR-6) 208
162 Consumption of steel in the Community 209 163 Production of finished steel in the Community (EUR-6) 210
164 All iron and steel products - Imports by ECSC (EUR-6) from non-ECSC
countries 211 165 All iron and steel products - Exports from ECSC (EUR-6) to non-ECSC
countries 212 166 All iron and steel products: Intra-Community (EUR-6) trade 213
167 Hourly labour cost for manual workers 214 168 Accidents in the iron and steel industry (injury rates) 215
169 Accidents in the iron and steel industry (average number of calendar days
lost) 216
Table 1 AREA. POPULATION, DENSITY PER SQ. KILOMETRE
AND ESTIMATED POPULATION GROWTH Middle of 1974
1 2 3 4 5 6
/
8 9 IO 11 17 13 14 15 IC 1/ 18 li) 20 71 22
Country
EUR 9 GL'I m,my Frinire: Hilly Nrlhril.in.h Βι.Ίψι.ιη Luxiini Un 1 Kiniiiliiin lirl.m. Duumin k Giuuiu: 1 in kry Noi W. IV Sweden Swil/ui kind Ausin.ι Poi 1II||,il F inland Sii.iiri USSR USA C,III,III.ι J.ipiin World
Area
Ό00 sq km
1 528.2 248.6 547.0 301.3 40.8 30.5 2.6 244.0 70.3 43.1 132.0 814.6 323.9 450.0 41.3 83.9 91.6 337.0 504.8 22 402.0 9 363.1 9 976.1 3 7 0 0 135 897.0
Popu lation Ό00
257 835 62 054 52 507 5 5 4 1 3 13 545 9 772 357 56 056 3 086 5 045 8 962 38 270 3 987 8 161 6 481 7 528 8 735 4 682 35 225 252 064 211 909 22 479 109671 3 890 000
Den sity per sq km
169 250 96 184 332 320 137 230 44 117 68 47 12 18 157 90 95 14 70 11 23 2 296 29
Projected population 000
1980
263 507 61 940 55 302 57 181 14 190 9 867 364 56 214 3 309 5 140 9 479 45 767 4 100 8 334 6 636 7 778 9 283 4 570 3 6 4 1 3 270 634 229 000 25 299 115972 4 401 000
1985
268 962 61 814 57 744 58 773 14 729 9 933 370 56 878
Table 2
POPULATION BY AGE AND SEX 1974
V00
1 2 3 4 5 6 7 8 9 10 11 12 13 14 15 16 17 18 If) 70 21 72
Country
EUR-9 Germany (a) F rance Italy Netherlands Belijium Luxembourg Uniteti Kingdom Ireland Denmark Greece Turkey(b| Norway Sweden Switzerland Austria (c) Portugal (b) Finland (d) Spain (c) USSR (d| USA (d) Canada Japan (d|
Under 15
male
7 109 6 494 6 897 1 793 1 135 37 6 803 492 587 1 116 7 673
491 866 745 933 1 245
559 4 853 34 874 28 929 3 165 13 294
fern.
6 756 6 224 6 541 1 712 1 082 35 6 449
470 560 1 050
7231 466 822 712 889 1 206 537 4 626 33 586 27 819 3 020 12 676
From 15 to 64
male
19 268 16 551 17 445 4 337 3 101 121 17 516 "900 1 628 2 795 9 674 1 255 2 660 2 046 2 168 2 5 1 1 1 511 10 425 76 037 64 453 7 070 35 901
fern.
20 248 16 268 17 927 4 261 3 104 118 17 572 881 1 607 2 927 9 543 1 230 2 600 2 078 2 405 2 816 1 577 10 835 90 849 66 688 7 005 37 579
65 and over
male
3 269 2 683 2 765 617 547 19 2 986 157 286 477 716 229 528 311 401 333 164 1 364 3 506 8 6 7 1
809 3 444
fern.
5 326 4 287 3 838 825 803 27 4 730 186 377 597 829 303 668 458 660 500 278 1 935 8 607 12 278 1 026 4 438
Total
male
29 646 25 728 27 107 6 747 4 783 177 27 305
1 548 2 501 4 388 18 063 1 975 4 054 3 102 3 502 4 089 2 234 16 642 114417 102 053 11 044 52 639
fern.
32 330 26 779 28 306 6 798 4 989 180 28 751 1 538 2 544 4 574 17 603 1 998 4 090 3 248 3 954 4 522 2 392 17 396 133 042 106 785 11 051 54 693
ta) 1973 (bl 1970 Icl 1971 Idi 1972
POPULATION BY AGE AND SEX 1974
Table 3
% oí total
I 2 3 4 5 6 7 8 9 10 11 12 13 14 15 16 17 18 19 20 21 72
Country
EUR-9 Germany (a) France Italy Netherlands Belgium Luxembourg United Kingdom Ireland Denmark G reece Turkey (b) Norway Sweden Switzerland Austria (c) Portugal (b) Finland (a) Spain (c) USSR (d) USA (d) Canada Japan (d)
Under 15
male
11.5 12.4 12.4 13.2 11.6 10.4 12.1 15.9 11.6 12.4 21.5 12.4 10.6 11.8 12.5 14.5 12.1 14.3 14.1 13.8 14.3 12.4
fern.
10.9 11.8 11.8 12.6 11.1 9.8 11.5 15.2 11.1 11.7 20.3 11.7 10.1 11.2 11.9 14.0 11.6 13.6 13.6 13.3 13.7 11.8
Fro •π 15 to 64
male
31.1 31.5 31.5 32.0 31.7 33.9 31.2 29.2 32.3 31.2 27.1 31.6 32.7 32.2 29.1 29.2 32.7 30.6 30.7 30.9 32.0 33.4
fern.
32.6 31.0 32.4 31.5 31.8 33.0 31.4 28.6 31.8 32.7 26.8 31.0 31.9 32.7 32.3 32.7 34.1 31.8 36.7 31.9 31.7 35.0
65 and over
male
5.3 5.1 5.0 4.6 5.6 5.3 5.4 5.1 5.7 5.3 2.0 5.7 6.5 4.9 5.4 3.9 3.5 4.0 1.4 4.2 3.7 3.2
fern.
8.6 8.2 6.9 6.1 8.2 7.6 8.4 6.0 7.5 6.7 2.3 7.6 8.2 7.2 8.8 5.8 6.0 5.7 3.5 5.9 4.6 4.1
Total
male
47.9 49.0 48.9 49.8 48.9 49.6 48.7 50.2 49.6 48.9 50.6 49.7 49.8 48.9 47.0 47.5 48.3 48.9 46.2 48.9 50.0 49.0
fern.
52.1 51.0 51.1 50.2 51.1 50.4 51.3 49.8 50.4 51.1 49.4 50.3 50.2 51.1 53.0 52.5 51.7 51.1 53.8 51.1 50.0 51.0
Table 4
BIRTHS, MARRIAGES AND DEATHS 1974
1 2 3 4 5 6 7 8 9 10 11 12 13 14 1b 16 17 18 19 20 21 22
Country
EUR-9 Germany France Italy Netherlands Belgium Luxembourg United Kingdom Ireland Denmark Greece Turkey(b) Norway Sweden Switzerland Austria Portugal Finland Spain USSR USA Canada |a) Japan
Births
'000
3 489
623 800 871 186 124 4 741 69 71 144 61 110 85 97 169 62 681 4 589 3 166 343 2 030
per '000 popu-lation
13.5 10.1 15.2 15.7 13.8 12.7 11.0 13.2 22.3 14.2 16.1 39.6 15.4 13.4 13.1 12.8 19.3 13.3 19.3 18.2 15.0 15.5 18.6
Marr
'000
1 850 377 394 404 110 74 2 435 23 31(a) 68 28 45 38 49 81 35 268 2 515(a) 2 225
205 1 009
ages
Per '000 popu-lation
7.2 6.1 6.3 6.3 8.1 7.6 6.2 7.8 7.3 6.1(a) 7.6 7.1 5.5 6.0 6.6 9.3 7.5 7.6 10.1(a) 10.5
9.1 9.2
Deaths
'000
2 785 725 551 529 108 116 4 667 34 51 76 40 86 56 94 96 45 295 2 199 1 933 164 711
per '000 popu-lation
10.8 11.7 10.5 9.5 8.0 11.9 12.1 11.9 11.2 10.2 8.5 14.6 10.1 10.6 8.8 12.5 11.1 9.6 8.4 8.7 9.1 7.4 6.5
Infant mor-tality
18.2 21.1 14.6 22.6 11.2 18.8 13.5 16.7 17.1 11.5(a) 24.0 11.9 9.2 13.2 23.4 38.4 10.1 13.7 26.4 6.5 15.6 11.3
(al 1973. (b) 1967.
Table 5 SIZE OF PRIVATE HOUSEHOLDSÍa)
(a) Private households as distinct f r o m institutional households (boarding schools, communities, homes for the aged, etc.).
(b) Figures relate to private dwellings, (c| Households of t w o or more persons
'000
1 2 3 •1 5 6 7 8 9 10 11 12 13 14 16 16 17 18 19 20 21 22
Country
EUR-9 Germany France Italy Netherlands Belgium Luxembourg United Kingdom Ireland Denmark (b) Greece Turkey Norway Sweden Switzerland Austria Portugal Finland Spain USSR (c) USA Canada Japan
Year
1970 1970 1970 1970 1970 1970 1971 1971 1970 1971 1970 1960 1970 1970 1971 1970 1971 1970 1972 1971 1970
1
5 527 3 473 1906 580 505 8 3 350 103 422 304 171 205 771 403 623 234 363
12 189 812 2 888
Number of persons constituting household
2
5 959 4 594 3 488 1 076 958 31 5 860 149 537 566 509 269 903 584 672 515 336 14 930 19 482 1 525 4 152
3
4 314 3 101 3 937 730 653 24 3 560
116 333 553 563 235 590 395 454 523 291 15 366 11 542 1 046 5 291
4
3 351 2 556 3 692 772 481 21 3 240 102 301 612 772 221 497 347 361 434 256 14 155 10679
1 063 6 853
5 or more
2 839 2 947 4 149 774 517 19 2 690 256 208 521 3 478
209 289 323 426 639 273 14 239 12 784 1 595 7 672
Total
21 990 16 671 17 172 3 932 3 114 102 18 700 726 1 801 2 556 5 493 1 139 3 050 2 052 2 536 2 345 1 519 58 690 66 676 6 041 26 856
Table 6
C I V I L I A N LABOUR FORCE BY OCCUPATIONAL STATUS
1974(a)
■ooo
1 2 3 4 5 6 7 8 9 10 11 12 13 14 15 16 17 18 19 20 21 22
Country
EUR9 Germany France Italy Netherlands (b) Belgium Luxembourg United Kingdom Ireland Denmark Greece Turkey Norway Sweden Switzerland Austria Portugal Finland Spain USSR USA Canada Japan
Employers, own account workers and family workers
17 486 4 063 4 058 5 278 719 634 24 1 977 303 429
279 358 751 760 415
8 160 1 002 16 380
Wage earners
and salaried employees
84 782 21 626 17 108 13 437 3 860 3 164 127 22 790 744 1 926
1 375 3 521
2 288 2 349 1 739
76 249 7 757 35 950
Civilian employment
102 270 25 689 21 166 1 8 7 1 5 4 579 3 801 151 24 767 1 047 2 355 3 320 13 810 1 654 3 879 3 097 3 039 3 109 2 154 12 844 84 409 8 759 52 330
Un employed
2 576 582 501 560 143 94 0 543 64 89 100 740 26 98 0 29 51 159 4 304 520 670
Total
104 846 26 271 21 667 19 275 4 722 3 895 151 2 5 3 1 0 1 111 2 444 3 420 14 550 1 680 3 977 3 097 3 068 3 462 2 205 13 003 88714 9 279 52 990
CIVILIAN LABOUR FORCE BY OCCUPATIONAL STATUS
1974(a)
Table 7
l 2 3 4 5 6 7 8 9 in 11 12 13 14 15 Ili 17 18 19 20 21 22
Country
EUR-9 Germany France Italy Netherlands Belgium Luxembourg United Kingdom Ireland Denmark Greece Turkey Norway Sweden Switzerland Austria Portugal Finland Spain USSR USA Canada Japan
Employers, own account workers and family workers
16.7 15.5 18.7 27.4 15.2 16.3 15,9 7.8 27.3 17.6
16.6 9.0 24.5 22.0 18.8
8.5 10.8 30.9
Wage earners
and salaried employees
80.8 82.3 79.0 69.7 81.8 81.3 84.1 90.1 66.9 78.8
81.8 88.5 74.6 67.9 78.9
86.6 83.6 67.8
Civilian employment
97.5 97.8 97.7 97.1 97.0 97.6 100.0 97.9 94.2 96.4 97.1 94.9 98.5 97.5 100.0 99.1 89.8 97.7 98.8 95.1 94.4 98.8
Un-employed
2.5 2.2 2.3 2.9 3.0 2.4 0.0 2.1 5.8 3.6 2.9 5.1 1.5 2.5 0 0.9 2.3 1.2 4.9 5.6 1.3
Total
100 100 100 100 100 100 100 100 100 100 loo 100 100 100 100 100 100 100 100 loo 100 100 loo.
Table 8
CIVILIAN EMPLOYMENT BY MAIN SECTORS OF ECONOMIC ACTIVITY
1974(a)
VOO
1 2 3 4 5 6 7 8 9 10 11 12 13 14 15 16 17 18 19 20 21 22
Country
EUR-9 Germany France Italy Netherlands (b) Belgium Luxembourg United Kingdom Ireland Denmark Greece Turkey Norway Sweden Switzerland Austria Portugal Finland Spain USSR USA Canada Japan
Agriculture
9 085 1 882 2 452 3 1 1 1
304 140 10 705 254 227 1 134 8 760 189 276 220 489 895 369 3 406 3 452 571 7 030
Industry
43 595
12 221 8 301 8 256 1 625 1 565 74 10 467 326 760 852 2 090
560 1 428 1 435 1 219 1 052 769 4 879 26 745 2 738 19 470
Services
49 590 11 586 10412
7 348 2 650 2 096 67 13 596
467 1 368 1 334 2 960 905 2 175 1 442 1 331 1 162 1 016 4 559 54 212 5 450 25 830
Total
102 270 25 689 21 165 18715
4 579 3 801 151 24 767 1 047 2 355 3 320 13 810 1 654 3 879 3 097 3 039 3 109 2 154 12 844 84 409 8 759 52 330
CIVILIAN EMPLOYMENT BY MAIN SECTORS OF ECONOMIC ACTIVITY
1974 (a)
Table 9
1 2 3 4 5 6 7 8 9 10 11 12 13 14 15 16 17 18 19 20 21 22
Country
EUR-9 Germany France Italy Netherlands Belgium Luxembourg United Kingdom Ireland Denmark Greece Turkey Norway Sweden Switzerland Austria Portugal Finland Spain USSR USA Canada Japan
Agriculture
8.9 7.3 12.0 16.6 6.6 3.7 6.6 2.8 24.3 9.6 34.2 63.4 11.4 7.1 7.1 16.1 28.8 17.1 26.5 4.1 6.5 13.4
Industry
42.6 47.6 39.2 44.1 35.5 41.2 49.0 42.3 31.1 32.3 25.7 15.1 33.9 36.8 46.3 40.1 33.8 35.7 38.0 31.7 31.3 37.2
Services
48.5 45.1 49.2 39.3 57.9 55.1 44.4 54.9 44.6 58.1 40.2 21.4 54.7 56.1 46.6 43.8 37.4 47.2 35.5 64.2 62.2 49.4
Total
100 100 100 100 100 100 100 100 100 100 100 100 100 100 100 100 100 100 100 100 100 100
Table 10
TRENDS IN UNEMPLOYMENT 1970 = 100
1 2 3 4 5 6 7 8 9 10 11 12 13 14 15 16 17 18 19 20 21 22
Country
Germany France Italy Netherlands Belgium Luxembourg United Kingdom Ireland Denmark Greece Turkey Norway Sweden Switzerland Austria Portugal Finland Spain USSR USA Canada Japan
1969
120 96 108 118 116 93 86 153
133 122 148 151 95 69 77 97
1970
100 100 100 100 100 100 100 100 100 loo 100 100 100 100 100 100 100 100 100 100 100 100
1971
124 125 100 123 97 130 100 159
171 90 120 133 122 112 109
1972
165 138 114 205 122 145 109 135
233 181 121 : 134 107 118 114 124
1973
183 126 110 209 126 104 102 124
217 166 100 : 124 82 105 105 114
1974
391 141 92 255 136 98 98 524
208 136
Table 11 GROSS DOMESTIC PRODUCT AT
MARKET PRICES
(at current prices and current exchange rates) (a)
Mrd Eur 1 2 3 4 5 6 7 8 9 10 11 12 13 14 lb 16 17 18 19 70 21 22 Country EUR-9 Germany France Italy Netherlands Belgium Luxembourg United Kingdom Ireland Denmark Greece Turkey Norway Sweden Switzerland Austria Portugal Finland Spain USSR USA Canada Japan 1966 448.6 121.7 104.9 63.2 20.4 17.8 0.7 105.9 2.8 11.1 6.6 10.1 23.8 15.2 10.3 4.1 8.7 24.2 748.2 57.9 102.6 1967 472.4 122.8 113.1 69.6 22.4 19.1 0.7 109.7 3.0 12.0 7.2 11.2 25.8 16.2 10.9 4.6 8.8 26.8 792.5 62.2 121.3 1968 497.7 133.7 124.0 75.1 24.8 20.4 0.8 103.5 3.0 12.3 7.8 12.4 8.9 27.4 17.4 11.6 5.1 8.1 25.9 862.7 67.8 143.7 1969 549.7 151.9 135.3 82.7 28.1 22.7 0.9 110.5 3.5 14.1 8.9 13.8 9.7 29.6 18.9 12.8 5.6 9.3 28.9 927.9 74.5 166.3 1970 617.7 185.5 141.0 92.7 31.7 25.2 1.1 121.1 3.9 15.6 9.9 12.7 11.2 33.0 20.6 14.3 6.2 10.4 32.3 983.2 82.3 196.9 1971 685.2 206.2 156.9 100.9 35.8 27.7 1.1 135.2 4.4 17.0 10.9 12.4 12.4 35.5 23.5 16.4 6.9 11.3 36.4 1 056.9 93.4 220.9 1972 762.7 235.7 176.1 109.3 41.7 31.6 1.2 142.9 5.0 19.1 11.5 15.1 13.6 38.1 27.2 18.6 7.9 12.3 42.9 1 070.2 97.0 270.0 1973 837.0 275.2 199.6 110.9 47.6 36.0 1.5 139.3 5.1 21.8 12.9 16.8 15.5 40.3 32.2 21.8 8.9 13.9 48.6 1 038.0 97.1 327.4 1974 918.1 304.9 213.0 119.8 55.4 42.1 1.7 151.4 5.3 24.5 15.3 23.5 18.7 45.3 37.2 26.3 17.6 58.7 1 118.4 116.5 364.0
ia) For exchange rates used see table 134 on page 174, It must be emphasized that these exchange rates do not reflect the relationships between the domestic purchasing powers of the currencies.
Table 12
VOLUME INDICES OF GROSS DOMESTIC PRODUCT AT MARKET PRICES
Table 13
A N N U A L RATES OF GROWTH
OF GROSS DOMESTIC PRODUCT AT M A R K E T PRICES
1964-1974
(at constant prices)
1 2 3 4 5 6 7 8 9
10 11 12 13 14 16 16 17 18 19 20 21 77
Country
EUR 9
Germany France Italy Netherlands Belgium Luxembourg United Kingdom Ireland Denmark
Greece Turkey Norway Sweden Switzerland Austria Portugal (a) Finland Spain USSR USA Canada Japan
Total
4.1
4.0 5.3 4.7 5.0 4.7 3.7 2.5 3.9 3.8
6.5 6.4 4.5 3.5
5.0 6.7 5.1 10.4
3.7 5.2 8.6
Per head of total population
3.5
3.3 4.4 4.0 3.8 4.3 2.9 2.1 3.2 3.1
5.9 3.8 3.8 2.9
4.6 7.2 4.8 9.2
2.6 3.6 7.3
Per head of occupied
population
4.0
4.2 4.5 4.8 4.4 4.2 2.5 2.4 4.1 2.9
7.0 5.0 3.4 2.7
6.0 7.3 4.8 9.2
1.6 2.0 7.4
Table 14
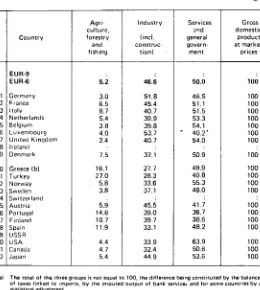
GROSS DOMESTIC PRODUCT AT MARKET PRICES BY BRANCH (a)
1973
1 2 3 4 5 6 7 8 9 10 11 12 13 14 15 16 17 18 19 2Ü 21 22
Country
EUR-9 EUR-6 Germany France Italy Netherlands Belgium Luxembourg United Kingdom Ireland Denmark Greece (b) Turkey Norway Sweden Switzerland Austria Portugal Finland Spain USSR USA Canada Japan
Agri-culture, forestry and fishing
5.2 3.0 6.5 8.7 5.4 3.8 4.0 2.4 7.5 16.1 27.0 5.8 3.8 5.9 14.6 10.7 11.9 4.4 4.7 5.4
Industry (incl.
construc-tion)
46.6 51.8 45.4 40.7 39.9 39.8 53.7 40.7 37.1 27.7 28.3 33.6 37.1 45.5 39.0 39.7 33.1 33.9 32.4 44.9
Services ond genera! govern-ment
50.0 46.5 51.1 51.5 53.3 54.1 * 4 0 . 2 '
54.0 50.9 49.9 40.8 55.3 48.0 41.7 36.7 38.6 48.2 63.9 50.6 53.6
Gross domestic
product at market
prices
100 100 100 100 100 100 100 100 100 100 100 100 100 100 100 100 100 100 100 100
(a) The total of the. three groups is not equal to 100, the difference being constituted by the balance of taxes linked to imports, by the imputed output of bank services and for some countries by a statistical adjustment.
COST-STRUCTURE OF GROSS DOMESTIC PRODUCT AT MARKET PRICES
1974
Table 15
1 2 3 4 5 6 7 8 9 in 11 17 13 14 15 16 17 18 19 .'0 21 22
Country
EUR-9 Germany France Italy Netherlands Belgium Luxembourg United Kingdom Ireland Denmark Greece (a) Turkey (a) Norway Sweden Switzerland Austria Portugal (b) Finland Spain (b) USSR USA Canada Japan (b)
Compen-sation
of employees
56.9 55.7 52.4 55.0 60.1 55.7 58.5 64.5 54.9 58.0 33.0 55.3 61.5 51.2 44.0 52.2 52.0 61.6 54.2 48.4
Taxes linked to
produc-tion and imports
minus sub-sidies
10.9 11.0 12.7 9.5 9.8 8.5 8.0 10.0 12.7 13.6 13.2 11.2 11.5 12.1 14.7 9.7 9.4 6.8 8.9 12.6 6.2
Con-
sump-tion of fixed capital
10.7 11.8 11.7 9.5 8.7 9.1 15.3 10.3 7.6 9.4 6.0 5.9 14.3 10.4 10.6 5.0 10.0 8.0 10.8 10.9 13.6
Net
opera-ting surplus
21.5 21.5 23.2 26.0 21.4 26.7 18.1 15.1 24.8 19.0 47.8 18.9 16.0 23.5 41.3 28.4 33.2 18.7 22.3 31.8
Gross domestic
product at market
prices
100 100 100 100 100 100 100 100 100 100 100 100 100 100 100 100 100 100 100 100 100
Table 16
USE OF GROSS DOMESTIC PRODUCT AT MARKET PRICES
1974
1 2 3 4 5 6 7 8 9 10 11 12 13 14 15 16 17 18 19 20 21 22
Country
EUR-9 Germany France Italy Netherlands Belgium Luxembourg United Kingdom Ireland Denmark Greece Turkey (a) Norway Sweden Switzerland (b) Austria Portugal (b) Finland Spain (b) USSR USA Canada Japan
Private consump-tion
on the economic
terri-tory
61.4 58.2 61.7 66.9 55.8 58.7 53.4 63.7 71.0 56.5 70.9(c) 72.2(c) 51.4 52.0 56.1 53.9 72.3(c) 49.6 71.4 62.9 55.5 52.4
Collec-tive
consump-tion of general govern-ment
15.5
13.9 13.0 14.0 17.2 14.7 12.1 20.5 18.2 23.2 13.6 14.0 16.5 23.6 11.6 15.3 13.5 17.1 11.3 19.2 19.2 10.1
Gross fixed capital formation
22.8 22.8 25.1 23.4 22.2 22.7 25.5 20.1 24.7 21.9 21.7 17.6 32.1 22.0 28.8 28.0 20.1 29.0 21.7 17.5 23.2 34.3
Change in stocks
1.3 0.1 1.8 1.8 2.3 2.1 1.8 1.4 3.3 1.6 3.7 0.3 1.8 2.1 0.8 3.3 - 0 . 1 9.0 1.9 1.0 1.9 3.8
Balance of exports
and imports of goods
and services
- 1.1 5.0 - 1.5 - 6.1
2.5 1.8 7.1 - 5.7 - 17.2 - 3.2 - 9.9 - 4.1 - 1.8 0.3 2.6 - 0.6 - 5.8 - 0.5 - 6.3 - 0.6 0.1 - 0.5
Gross domestic
product at market
prices
100 100 100 100 100 100 100 100 100 100 100 100 100 100 loo 100 100 100 100 100 100 100
(al 1972. (b) 1973.
USE OF GROSS DOMESTIC PRODUCT AT MARKET PRICES
1974
Table 17
Mrd Eur
1 2 3 4 5 6 7 8 9 10 11 12 13 14 15 16 1 / 18 19 20 21 22
Country
EUR-9 Germany France Italy Netherlands Belgium Luxembourg United Kingdom Ireland Denmark Greece Turkey (a) Norway Sweden Switzerland (b) Austria Portugal (b) Finland Spain (b) USSR USA Canada Japan
Private consump-t i o n
on the economic
terri-tory
559.5 177.4 131.3 80.2 30.9 24.7 0.9 96.4 3.8 13.8 10.9(c) 10.9(c)
9.6 23.5 18.1 14.2
6.4(c) 8.7 34.7 703.1
64.6 190.9
Collec-tive
consump-tion of general govern-ment
140.5 42.4 27.6 16.8 9.5 6.2 0.2 31.1 1.0 5.7 2.1 2.1 3.1 10.7 3.7 4.0 1.2 3.0 5.5 215.2 22.4 36.6
Gross fixed capital formation
210.3 69.5 53.4 28.0 12.3 9.6 0.4 30.4 1.3 5.4 3.3 2.7 6.0 10.0 9.3 7.4 1.8 5.1 10.5 195.2 27.0 124.7
Change in stocks
11.2 0.3 3.9 2.2 1.3 0.9 0.0 2.1 0.2 0.4 0.6 0.0 0.3 0.9 0.3 0.8 - 0 . 0 1.5 0.9 11.2 2.2 13.7
Balance of exports
and imports of goods
and services
- 3.3 15.2 - 3.2 - 7.3
1.4 0.8 0.1 - 8.6 - 0.9 - 0.8 - 1.5 - 0.6 - 0.3
0.1 0.8 - 0.2 - 0.5 - 0.8 3.1
0.2 - 1.9
Gross domestic
product at market
prices
918.1 304.9 213.0 119.8 55.4 42.1 1.7 151.4 5.3 24.5 15.2 15.1 18.7 45.3 32.2 26.3 8.9 17.6 48.6 1 118.4
116.5 364.0
la) 1972 lb) 1973.
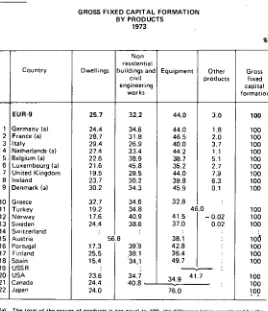
Table 18
GROSS FIXED CAPITAL FORMATION BY PRODUCTS
1973
1 2 3 4 5 6 7 8 9
10 11 12 13 14 15 16 17 18 19 20 21 22
Country
EUR-9
Germany (a) France (a) Italy Netherlands (a) Belgium (a) Luxembourg (a) United Kingdom Ireland Denmark (a)
Greece Turkey Norway Sweden Switzerland Austria Portugal Finland Spain USSR USA Canada Japan
Dwellings
25.7
24.4 28.7 29.4 27.4 22.6 21.6 19.5 23.7 30.2
32.7 19.2 17.6 24.4
56 17.3 25.5 15.4
23.6 24.4 24.0
Non residential buildings and
civil engineering
works
32.2
34.6 31.8 26.9 33.4 38.9 45.8 28.5 30.2 34.3
34.6 34.8 40.9 38.6
.8 39.9 38.1 34,1
34.7 40 8 ■
Equipment
44.0
44.0 46.5 40.0 44:2 38.7 35.2 44.0 39.8 45.9
32.8
4e
41.5 37.0
38.1 42.8 36.4 49.7
Othc produ
3.0
1.8 2.0 3.7 1.1 5.1 2.7 7.9 6.3 0.1
.0 - 0 . 0
0.0
34.9~4lT
776.0
r Gross
cts fixed capital formation
100
100 100 100 100 100 100 100 100 100
100
2 100
2 100
10(5 100 100 100
100 100 100
TAXES AND ACTUAL SOCIAL CONTRIBUTIONS 1974
Table 19
1 2 3 4 5 6 7 8 9
Country
EUR-9 Germany France Italy Netherlands Belgium Luxembourg United Kingdom Ireland Denmark
Taxes and actual
social contri-butions,
total Eur mio
342 441 116 064 77 493 37 846 25 596 16 555 687 55 552
1 779 10 869
Taxes linked to production
and imports
Current taxes
on income
and wealth
Capital taxes
Actual social contri-butions
in % of total
34.9 32.4 40.2 36.4 25.2 30.2 28.0 36.8 55.8 36.2
32.1 33.7 20.4 20.9 34.8 37.7 43.2 43.4 30.9 62.2
0.6 0.2 0.6 1.0 0.5 0.7 0.4 1.3 1.7 0.4
Table 20
School-year
1962/63 1963/64 1964/65 1965/66 1966/67 1967/68 1968/69 1969/70 1970/71 1971/72 1972/73 1973/74
1962/63 1963/64 1964/65 1965/66 1966/67 1967/68 1968/69 1969/70 1970/71 1971/72 1972/73 1973/74
EUR-9 Ger-many
'000
40 238 41 100 42 344 43 598 44 921 46 232 47 588 48 723 49 632
7 462 7 594 7 755 7 983 8 268 8 644 8 975 9 447 9 877 10 337 10719 11 053
France
8 933 9 065 9 2 1 3 9 374 9 436 9 633 9 888 10081 10 206 10 362 10 555 10614 % of total population
16.4 16.7 17.1 17.5 17.9 18.2 18.6 19.0 19.2
13.0 13.1 13.2 13.5 13.9 14.5 14.9 15.6 16.1 16.8 17.3 17.8
18.7 18.8 18.9 19.1 19.0 19.3 19.7 19.9 19.9 20.0 20.2 20.2
NUMBER OF PUPILS
Italy
7 279 7 521 7 771 8 043 8 276 8 520 8 784 9 082 9 449 9 781 10 077 10313
14.2 14.6 14.9 15.3 15.7 16.1 16.5 16.9 17.5 18.0 18.4 18.6
(full-time
Nether-lands
2 352 2 375 2 407 2 451 2 491 2 545 2 599 2 655 2 719 2 795 2 851 2 9 1 5
19.7 19.6 19.6 19.7 19.8 20.0 20.2 20.4 20.6 21.0 21.2 21.5
AND STUDENTS (al education)
Table 20
Bel-gium
1 585 1 627 1 665 1 707 1 738 1 800 1 840 1 857 1 902 1 938 1 932 1 939
17.1 17.3 17.6 17.9 18.1 18.7 19.1 19.2 19.7 20.0 19.8 19.8
Luxem-bourg
45 46 47 49 50 51 51 52 54 56 55 56
13.9 14.0 14.2 14.7 14.9 15.2 15.1 15.3 15.7 15.8 15.6 15.7
United
King-dom
9 128 9 282 9 482 9 749 10 023 10 227 10512 10 766 10 933 11 1 2 0 *
16.8 17.0 17.3 17.7 18.1 18.5 18.9 19.3 19.5 1 9 . 8 *
Ireland Den-mark
'000
5 7 1 * 587 596 612 629 644 661 678 693 679
763 762 790 810 827 852 875 909 943 % of total population
1 9 . 9 * 20.4 20.5 20.9 21.5 21.8 22.2. 22.5 22.7 22.0
15.9 15.8 16.2 16.6 16.8 17.2 17.5 18.1 18.7
School-year
1962/63 1963/64 1964/65 1965/66 1966/67 1967/68 1968/69 1969/70 1970/71 1971/72 1972/73 1973/74
NUMBER OF PUPILS AND STUDENTS BY LEVEL
Schoolyear EUR-9
Ger-many Italy
Nether-lands Belgium
Luxem-bourg
United Kingdom
1969/70 1970/71 1971/72 1972/73 1973/74
1969/70 1970/71 1971/72 1972/73 1973/74
1969/70 1970/71 1971/72 1972/73 1973/74
6 198 6 385 6 6 1 6 6 778 7 034
23 148 23 675 23 941 23 950 24 000
19 001 19 558 20 387 2 1 3 1 2 22 004
1 127 1 196 1 282 1 386 1 464
3 886 4 296 4 491 4 526 4 497
4 940 4 899 5 068 5 347 5 6 2 1
2 116 2 213 2 298 2 371 2 458
5 218 5 147 5 042 4 987 4 954
4 156 4 294 4 515 4 714 4 798
1 560 1 587 1 620 1 567 1 605
4 819 4 929 4 997 5 043 5 040
3 640 3 833 4 0 1 8 4 225 4 426
're-School level
493 493 493 497 508
First level
1 523 1 530 1 533 1 531 1 524
466 457 450 444 443
1 020 1 044 1 041 1 005 987
Second level
967 1 0 1 1 1 068 1 118 1 176
Third leve 717 727 742 768 784
7.4 7.8 8.3 8.5 8.6
36.4 31.7 33.2 31.3 31.6
14.1 20.2 20.9 21.4 21.9
320 305 332 362 3 7 0 *
5 842 5 881 5 972 5 982 6 1 3 0 *
3 997 4 174 4 320 4 468 4 5O0#
97.0 103.6 101.7 105.1 136.4
422.8 427.6 431.3 433.2 408.0
195.3 208.5 219.8 231.1 241.7
11.9 20.9 31.3 37.6 41.4
381.1 389.3 400.7 414.1 428.6
373.9 384.1 391.7 403.2 416.2
1969/70 1970/71 1971/72
2 770 3 000 3 259
620 684 777
707 764 806
622 687 766
165 178 193
119 126 148
1.7 1.9 2.1
438 457 474
24.0 26.2 27.1
PUPILS AND STUDENTS OF THE T H I R D LEVEL (full-time education)
Table 22
Schoolyear EUR-9 Ger
many France Italy
Nether
lands Belgium Luxem
bourg
.United
Kingdom Ireland Denmark
in absolute value (χ '000) 1962/63
1965/66 1970/71 1971/72 1972/73 1973/74
1 932* 3 000 3 259 3 460 3 632
474 517 684 777 848 934
315 421 764 806 855 866
314 408 687 766 809 847
96 120 178 193 202 215
64 84 125 132 141 149
in % of the total school-population 1.0 1.2 1.9 2.1 2.2 2.3
222 309 457 474 482 4 9 0 *
19.4 26.2 27.1 28.6 29.6
51.0 78.2 82.9 92.0 98.2
1962/63 1965/66 1970/71 1971/72 1972/73 1973/74
4.2 5.7 6.0 6.2 6.4
5.7 5.8 6.2 6.7 7.0 7.5
3.0 3.8 6.2 6.4 6.6 6.7
3.7 4.4 6.2 6.7 6.9 7.1
3.5 4.1 5.5 5.9 6.0 6.3
3.2 3.9 5.3 5.5 5.9 6.2
2.0 2.3 3.1 3.3 3.5 3.6
2.4* 3.2 4.2 4.3 4.3 4.3*
2.9 3.4 3.5 3.6 3.6
PUBLIC EXPENDITURE ON RESEARCH AND DEVELOPMENT (Budget appropriations)
Ger-many Italy
Nether-lands Belgium
Luxem-bourg United
Kingdom Ireland Denmark
in Mio Eur (current exchange rates)
1971 1972 1973 1974 1 9 7 5 *
1971 1972 1973 1974 1 9 7 5 *
1971 1972 1973 1974 1 9 7 5 *
7 185.0 7 992.2 9 058.1 9 645.8 10 343.8
7 185.0 7 992.2 9 058.1 10 063.9 11 019.2
28.36 31.38 35.34 39.08 42.64
2 309.3 2 744.6 3 394.0 3 701.2 3 955.9
2 306.3 2 623.6 3 086.2 3 256.0 3 480.1
37.62 42.54 49.80 52.47 56.20
2 011.6 2 198.1 2 404.8 2 494.4 2 730.5
2 011.6 2 198.1 2 404.8 2 699.2 2 905.4
ir
39.26 42.51 46.13 51.41 54.82
454.7 441.9 467.9 440.7 485.2
in Mio Eu
454.9 446.4 545.8 573.3 689.3
333.3 380.2 448.2 504.3 585.8
(exchange
333.0 369.9 430.1 467.4 543.0
226.5 266.0 279.5 334.4 345.0
rates 197C
226.2 258.9 272.0 325.4 335.7
Eur per capita (exchange rates 1
8.44
8.23 9.94 10.35 12.35
25.29 27.71 32.00 34.51 39.79
23.30
26.66 27.92 33.31 34.27
1 734.0 1 953.5
1 760.7 2 003.0 2 046.4
1 734.0 1 953.5 2 159.1 2 567.0 2 858.4
31.18 35.01 38.54 45.78 50.95
15.1 18.4 21.5 22.7 2 6 4
15.1 18.4 2 6 4 2 9 0 37 0
5.08 6.13 8.65
9.40
11.86 103.9 122.2 132.3 145.1 168.6
103.9 123.4 133.6 146.6 170.3
20.95 24.73 26.60 29.06 33.70
in % of the gross domestic product
1971 1972 1973 1974
1 05 1 05 1 09
1.11 1.16 1.23 1.21
1.28 1.25 1.20
1.17 0.46
0.41
0.43 0.37
0.93 0.91 0.94
0.91
0.81 0.83 0.78 0.80
1.30
1.32
1.28 1.34
0.34 0.35 0.42 0.43
Table 24 PRINCIPAL CATEGORIES OF LAND USE
1973
1 2 3 4 5 S 7 8 9 10 11 12 13 14 15 16 17 18 19 70 71 22
Country
EUR 9 Germany France Italy Netherlands Belgium Luxembourg Uniteti Kingdom Ireland Denmark Greece (c) Turkey (d) Norway Sweden Switzerland Austria Portugal (c) Finland Spain USSR USA (g) Canada (h) Japan (i)
World
Agricu turai area
'000 ha
93 684 13 429 32 459 17 482 2 110 1 568 133 18 683(b)
4 844 2 976 8 870 54 331 904 3 7 1 8 2 0 1 7 3 793 4 405(e) 2 766 32 280 607 901 435 330 68 663 5 685 4 466 000
% o f total area
61.4 54.0 59.1 58.0 57.3 51.4 51.3 76.6 68.9 69.1 67.2 69.6 2.8 8.3 48.9 45.2 49.5 8.2 63.9 27.1 46.5 68.8 15.3 33.3
Arable land
(a)
%
Permanent meadows
and pastures
of agricultural
area
55.3 60.2 57.6 70.0 40.0 53.2 47.4 38.3 25.3 89.3 40.9 51.9 87.4 81.2 19.0 42.5 88.0 98.1 65.0 38.2 43.9 63.7 93.2 33.0
44.7
39.8 42.4 30.0 60.0 46.8 52.6 61.7 74.7 10.7 59.1 48.1 12.6 18.8 81.0 57.5 12.0 1.9(f) 35.0 61.8 56.1 36.3 6.8 67.0
(a) Incl. land under permanent cultivation {orchards, vineyards etc.). (b) Moreover 442 000 ha statistically insignificant holdings w i t h o u t breakdown (c) 1968.
(d) 1973 permanent grassland: 1967.
le) Incl. 8 0 0 302 ha of temporary crops in association w i t h permanent crops or forests If) On agricultural holdings,
Table 25
Land use
Agricultural used area Arable land Cereals
Wheat Rye lb) Barley Oats I d Maize Other cereals Rice
Dried pulses Roots and tuber crops
Potatoes Sugar beet Fodder beet
Other roots and tuber crops Industrial crops
Green fodder from arable land Vegetables and other commercial
horticulture (d) Other area le) Permanent grassland
Permanent grassland for mowing Permanent grassland for grazing Land under permanent crops Fruit
Olive growing Vineyards
Other land under permanent crops
EUR-9 (a)
93 486 47 075 2 6 4 1 6 11 055
961 8 7 1 9 2 812 2 781 85 202 456 4 220 1 409 1 651 821 340 847 12 164
1 735 1 034 4 1 4 6 2 11 690(f) 28 240(f) 4 950 1 076 1 087 2 707 80
Ger-many
13 344 7 874 5 298 1 631 735 1 665 1 159 108
0 32 1 112
467 369 255 21 136 870 397 29 5 264 3 864 1 400 206 87 0 99 20
France
32 441 17 235 9 8 1 9 4 140
122 2 712
846 1 916 81 15 55 1 328 307 538 310 173 496 4 710
546 270 13 597 4 787 8 8 1 0 1 609
249 30 1 316
13 Italy
17 503 9 310 4 726 3 544 16 201 210 750 4 186 252 357 137 193 12 15 75 2 690 450 573 5 214 1 154 4 060 2 979 604 1 057 1 291 26
Nether-lands
2 101 807 261 130 22 73 33 2 0* 0 12 279 159 116 4 0* 28 121 82 24 1 255
42 35 0 0* 7
(a) Where statistics are available. (b) Incl. maslin.
AGRICULTURAL AREA
Table 25
'000 ha
Bel-gium
1 553 805 440 200 14 150 71 5 0 4 181 48 105 27 0* 12 102 59 6 729 169 561 19 17 0 0* 2
Luxem-bourg
132 61 43 11 1 16 14 0 0 0* 2 2 0* 0* 0* 0* 15 0* 1 70 29 40 1 0* 0 1 0*
United King-dom
18 637 7 077 3 747 1 233 5 2 2 1 4 295 1 0 ' 0 93 582 215 195 102 70 34 2 372 181 68 1 1 4 8 4 1 127 10356
76 69 0 0* 7
Ireland
4 846 1 271 345
55 0* 246
44 0 0 0 3 99 40 26 3 30 0* 815
7 2 3 572
560 3 013
3 3 0 0
Den-mark
2 928 2 635 1 737 111
46 1 441
140 0 0 0 4 281 34 109 108 30 66 470 13 65 277
15 12 0 0 3
Land use
Agricultural used area Arable land Cereals
Wheat Rye (b) Barley Oats (cl Maize Other cereals Rice
Dried pulses Roots and tuber crops
Potatoes Sugar beet Fodder beet
Other roots and tuber crops Industrial crops
Green fodder from arable land Vegetables and other commercial
horitculture (d) Other area (el Permanent grassland
Permanent grassland for mowing Permanent grassland for grazing Land under permanent crops Fruit
Olive growing Vineyards
Table 26
AGRICULTURAL HOLDINGS OF 1 HA 1974
Size groups (ha AA)
EUR-9 EUR-6 Ger many
France Italy (a)
1-< 5 5 - < 1 0 1 0 - < 2 0 20- < 50
» 5 0 Total
1 < 5 5 - < 1 0 1 0 - < 2 0 20- < 50
» 5 0 Total
Number of holdings (χ '000) 2 250
941 940 854 322
5 307
42.4 17.7 17.7 16.1 6.1
100
2 145 826 776 672 209
4 628
46.3 17.8 16.8 14.5 4.5
100
323.9 184.6 220.6 175.5 25.3
930
34.8 19.8 23.7 18.9 2.7
100
262.0 197.0 297.0 365.0 140.0
1 487.0 387.2 182.2 80.2 36.8 1 261
20.8 15.6 23.6 28.9 11.1
100
2 173
68.4 17.8 8.4 3.7 1.7
100
1 - < 5 5 - < 1 0 1 0 - < 2 0 20- < 50
» 5 0 Total
100 100 100 100 100 100
95.3 87.8 82.5 78.7 64.9 87.2
14.4 19.6 23.5 20.5 7.9 17.5
11.6 20.9 31.6 42.7 43.5 23.8
AND OVER BY SIZE GROUPS
Nether lands
37.0 31.8 45.1 29.9 3.1 147
25.2 21.6 30.7 20.3 2.1 100 1.6 3.4 4.8 3.5 1.0 2.8
Bel gium
33.5 25.1 29.6 18.6 3.2 110
30.5 22.8 26.9 16.9 2.9 100 1.5 2.7 3.1 2.2 1.0 2.1
Luxem bourg
Number 1.2 0.7 1.2 2.4 0.4 6
19.9 12.4 19.7 40.7 7.3 100 0.1 0.1 0.1 0.3 0.1 0.1
United King dom
of holdings (x 40.9 34.9 44.1 73.7 83.8 277
%
14.8 12.6 15.9 26.6 30.3 100 1.8 3.7 4.7 8.6 26.0 5.2
Ireland (a)
Ό00) 48.0 54.0 82.0 66.0 20.0 270
17.8 20.0 30.4 24.4 7.4 100 2.1 5.7 8.7 7.7 6.2 5.1
Denmark
16.0 26.1 38.3 42.6 9.6 133
12.1 19.7 28.8 32.1 7.3 100 0.7 2.8 4.1 5.0 2.9 2.5
Size groups (ha AA)
1-< 5 5 - < 1 0 1 0 - < 2 0 20- < 50
» 5 0 Total
1-< 5 5 - < 1 0 1 0 - < 2 0 20- < 50
» 5 0 Total
1-< 5 5 - < 1 0 1 0 - C 2 0 20- < 50
Table 27
AGRICULTURAL
HOLDINGS OF 1 HA AND
1974Size groups (haAA)
EUR-9 EUR-6 Ger many
France Italy
1-< 5
5 - < 1 0
10-<20 20- < 50
> 5 0
Total
1 5 10 20
1 5
< 5 < 1 0 < 2 0 < 5 0 » 5 0
< 5 < 1 0 10-<20 20 < 5 0 » 5 0 Total
Total
5 678 6 707 13 180 25 831 36 774 88170
6.4 7.6 14.9 29.3
41.7
100 100 100 100 100 100 loo
16.6
χ '000 ha 5 393 5 9 1 2 10 964 20 347 20 032 62 647
836 1 341 3 196 5 148 2 005
12 527
8.6 9.4 17.5 32.5 32.0 100 95.0 88.1 83.2 78.8 54.5 71.0 ha per ho
13.5
6.7 10.7 25.5 41.1 16.0 100 14.7 20.0 24.2 19.9 5.4 14.2 Id ing
13.5
719 1 410 4 160 11 300 12 030 29 619
2.4 4.8 14.0 38.2 40.6 100 12.7 21.0 31.6 43.7 32.7 33.6
23.5
3 649 2 737 2 522 2 421 5 479 16 807
21.7 16.3 15.0 14.4 32.6 100 64.3 40.8 19.1 9.4 14.9 19.1
7.7
AREA (AA) ON OVER BY SIZE GROUPS
Table 27
Nether lands
99 235 646 859 246 2 083
4.7 11.3 31.0 41.2 11.8 100 1.7 3.5 4.9 3.3 0.7 2.4
14.2
Bel gium
87 184 423 541 244 1 479
5.9 12.4 28.6 36.6 16.5 100 1.5 2.7 3.2 2.1 0.7 1.7
13.4
Luxem bourg
3 5 17 78 28 132
2.3 4.1 13.1 59.3 21.1 100 0.1 0.1 0.1 0.3 0.1 0.1
22.4
United King dom
Ireland (a)
χ '000 ha 119 254 644 2 4 1 4 14 375 17 806
%
0.7 1.4 3.6 13.6 80.7 100 2.1 3.8 4.9 9.3 39.1 20.2 ha per holdi
64.3
120 350 1 020 1 780 1 520 4 790
2.5 7.3 21.3 37.2 31.7 100 2.1 5.2 7.7 6.9 4.1 5.4 19
1 , 7
Denmark
46 191 552 1 290
847 2 927
1.6 6.5 18.9 44.1 28.9 100 0.8 2.8 4.2 5.0 2.3 3.3
22.0
Size groups (ha A A)
1 - < 5 5- < 10 1 0 - < 2 0 20- < 50
» 5 0 Total
1 < 5 5 - < 1 0 1 0 - < 2 0 20- < 50
» 5 0 Total
1 < 5 5 - < 1 0 1 0 - < 2 0 20- < 50
> 5 0 Total
Table 28 GENERAL SURVEY
Characteristics
Total number of agricultural holdings (χ Ό00)
Woodland
Agricultural area used (AA) AA owner farmed AA tenant farmed Arable land
Permanent meadow and pasture Permanent crops
Cereals Wheat Grain maize Potatoes Sugar beet
Forage roots and tubers Dried vegetables Industrial plants
Green fodder crops on arable lane Fresh vegetables
Fruit plantations Vineyards
Equines Cattle/Buffaloes
Dairy cows Sheep Pigs
Laying hens Broilers
EUR-6
5 888
1 848 5 855 5 260 2 406 4 657 3 279 2 871
3 754 2 922 1 070 2 3 1 6
373 1 508
443 208 2 4 1 4 1 243
577 2 093
936 3 049 2 357 446 2 429 3 375 1 673
Ger many
1 074.6 France
1 587.6 Italy
2 849.9 of which: holdings 474.2
1 071.0 999.3 631.5 956.2 929.9 153.4
896.1 659.8 56.3 758.8 115.6 621.9 26.7 31.1 490.0 56.4 91.5 72.3
96.4 793.4 713.4 28.3 751.1 725.3 30.1
658.9 1 583.3 1 348.9 928.7 1 285.0 1 207.6 720.8
1 052.0 762.2 352.1 895.0 55.1 773.1 114.0 119.4 891.8 221.8 139.2 659.9
294.4 1 051.5
815.5 173.7 655.6 1 203.9 775.2
695.5 2 832.6 2 627.6 599.1 2 149.2
852.0 1 957.8
1 621.8 1 411.3 659.4 485.3 136.1
290.2 48.1 950.8 900.8 319.7 1 359.2
443.3 939.5 604.4 211.0 857.6 1 304.6
852.5 Nether
lands
184.6 with...
6.8 181.1 140.3 112.2 121.3 136.2 21.6
73.2 24.5 0.4 76.2 33.2 29.7 6.4 3.1 24.1 36.7 14.6 0
50.1 130.8 116.3 19.8 75.8 48.7 2.8
Bel gium
184.0
8.7 179.5 136.6 129.2 138.8 146.9 16.3
104.4 60.2 2.1 95.4 32.7 80.0 4.8 5.8 52.8 27.2 11.0 0
51.1 127.9 101.4 12.8 83.7 87.5 12.1
Luxem bourg
7.6
3.7 7.6 7.4 5.3 6.6 6.6 1.5
6.1 4.4 0 4.8 0* 2.8 0.4 0.1 4.1 0.1 0.5 1.3
ON AGRICULTURE 1970/71 Table 28
Characteristics
Total area of agricultural holdings (χ '000 ha)
Woodland
Agricultural area used (AA) AA owner farmed AA tenant farmed Arable land
Permanent meadow and pasture Permanent crops
Area under: Cereals
Wheat Grain maize Potatoes Sugar beet
Forage roots and tubers Dried vegetables Industrial plants
Green fodder crops on arable land Fruit vegetables
Fruit plantations Vineyards
Number of animals (χ '000): Equines
Cattle/Buffaloes Dairy cows Sheep Pigs Laying hens Broilers
EUR-6
78 023
9 4 1 1 63 588 39 490 23 695 33 705 24 945 4 752
20 034 9 154 2 241 1 107 1 141 1 045 312 673 7 685
794 2 431
1 343 52 169 18 573 16 701 45 800 169 741 177 386
Ger many
15 236
1 831 12651
8 964 3 6 1 6 7 310 5 1 1 4
159
5 131 1 500 114 490 314 330 29 129 812
65 77
197 14 674 5 480 971 19 898 50 508 21 993
France
35 039 Italy
23 650 consisting of: 3 083 29 940 16 438 14 568 16014 12 330 1 488
9 201 3 669 1 441 311 400 671 60 469 4 310
230 1 200
452 21 400 7 280 9 052 10 703 43 156 54 704
4 423 17 179 12 454 3 328 8 7 1 6 5 423 3 040
4 836 3 651 683
100 234
199 48 2 384
442 1 153
533 8 701 2 861 5 987 5 835 43 013 59 618
Nether lands
2 342
42 2 143 1 112 1 030 818 1 282 43
360 142 1 157 104 9 17 15 61
38 0
86 4 3 1 4 1 895
575 5 533 17 846 30 060
Bel gium
1 603
15 1 540
440 1 100
783 727 21
461 181 2 47 89 34 7 12 104
19 0
74 2 887 995 113 3 728 14 996 10 981
Luxem bourg
153
17 135 82 53 64 69 1
45 11 0 2 0* 1 0* 0* 14
0* 1
Table 29
INDICES OF AGRICULTURAL OUTPUT (a) Average 1961-1965= 100
1 2 3 4 5 6 7 8 9 10 11 12 13 14 15 16 17 18 19 20 21 22
Country
Germany France Italy Netherlands Belgium Luxembourg United Kingdom Ireland Denmark Greece Turkey Norway Sweden Switzerland Austria Portugal Finland Spain USSR USA Canada Japan World (b)
1966
104 102 110 100 94 100 108 104 101 115 113 98 94 100 102 95 101 108 121 103 122 107 109
1967
113 114 115 112 109 118 110 115 102
118 114 100 105 114 109 107 104 108 120 109 105 118 113
1968
117 118 113 116 111 106 108 115 106 114 120 111 108 111 112 106 105 118 127 111 115 123 116
1969
114 112 118 116 113 107 109 117 99 121 119 104 94 113 115 105 111 119 124 110 115 121 117
1970
116 116 120 128 117 104 116 115 94 135 126 103 104 107 110 109 111 123 135 109 106 119 120
1971
121 121 119 137 126 105 120 127 98 138 134 106 106 114 112 102 119 127 136 118 122 113 125
1972
115 121 113 132 120 103 121 120 96 142 139 108 108 111 109 101 118 130 132 118 113 119 124
1973
119 128 122 138 121 110 124 120 99 146 129 110 101 122 115 107 109 139 152 120 116 120 130
lal FAO Index.
PRODUCTION OF CEREALS (a) Average 1971-1973
Table 30
•mot
1 2 3 4 5 6 7 8 9 10 11 12 13 14 15 16 17 18 19 20 21 22
Country
EUR-9 Germany France Italy Netherlands Belgium Luxembourg United Kingdom Ireland Denmark Greece Turkey Norway Sweden Switzerland Austria Portugal Finland Spain USSR USA Canada Japan World
Total of all cereals
(a)
103 275
20 788 40 176 15 159 1 392 2 004 140 15 262 1 435 6 919 3 333 18 193 863 5 139
765 3 550 1 497 2 976 12 103 181 529 230 494 37 074 770 1 013 000
Wheat
40 961 6 961 17 126 9 445 701 960 36 4 866 293 573 1 804 11 983 14 1 160
396 925 661 456 4 661 98 179 44 162 15 128 309 359 000
Rye and
me-siin (b)
3 758 2 975 336 44 155 77 5 18 0* 148
8 780 6 332 51 417 155 125 261 11 058 887 421 1 30 000
Barley
33 109 6 131 10 108 407 365 649 55 8 937 959 5 498 834 3 598
542 1 893
166 1 027
67 1 062 4 514 42 143 9 499 11 536 348 158 000
Oats and mixed grains other than mesiin
(cl
10 446 4 144 3 031 449 164 296 44 1 435 183 700 111 410 300 1 569
39 274 96 1 279
482 15 420 10 839 5 092 54 54 000
Grain maize
14 712 577 9 299 4 801 7 22 0 6 0 0* 573 1 088 0 0 99 804 518 0 2 006 10 548 142 764 2 759 28 307 000
Other ce-reals
(d)
289
276 13
0 0 0* 3 334 1 185 14 103 0 54 179 4 181 22 343 2 138 30 105 000
(a) Excl. rice.
(b) Non-EC (EUR-9) countries: excl. mesiin.