1
USE OF SOFA (SEQUENTIAL ORGAN FAILURE
ASSESSMENT) SCORING IN ASSESSING THE
INCIDENCE AND SEVERITY OF ORGAN
DYSFUNCTION AND PREDICTING THE OUTCOME IN
PATIENTS WITH SEPSIS IN SURGICAL UNIT
Dissertation Submitted in the
In partial fulfillment of the regulations required for the award of
M.S. DEGREE
in
GENERAL SURGERY
THE TAMILNADU
DR. M.G.R. MEDICAL UNIVERSITY
CHENNAI
2
CERTIFICATE
This is to certify that this dissertation titled “USE OF SOFA (SEQUENTIAL ORGAN FAILURE ASSESSMENT) SCORING IN ASSESSING THE INCIDENCE AND SEVERITY OF ORGAN DYSFUNCTION AND PREDICTING THE OUTCOME IN PATIENTS WITH SEPSIS IN SURGICAL UNIT” is the bonafide work of Dr. Sharath CT postgraduate student in M.S. General Surgery, Coimbatore Medical College and Hospital, Coimbatore. This study was undertaken in the department of General Surgery, Coimbatore Medical College and Hospital during the period September 2014 to September 2015 in partial fulfillment of the requirement of the “The Tamil Nadu Dr.M.G.R.Medical university” for the award of M.S. Degree in General Surgery. This dissertation has not been submitted in part or fully to any other University or Board. It gives me great pleasure to forward this dissertation.
Dr. Edwin Joe MD., BL. The Dean,
Coimbatore Medical College and Hospital Coimbatore
HOD GUIDE
Prof. Dr. V. Elango M.S., Prof. Dr.S.Saradha.M.S, F.I.C. S, F.A.I.S Head of the Department, Chief Unit V,
3
DECLARATION
The dissertation titled “USE OF SOFA (SEQUENTIAL ORGAN FAILURE ASSESSMENT) SCORING IN ASSESSING THE INCIDENCE AND SEVERITY OF ORGAN DYSFUNCTION AND PREDICTING THE OUTCOME IN PATIENTS WITH SEPSIS IN SURGICAL UNIT” is being submitted by me to “The Tamil Nadu Dr.M.G.R. medical university” in partial fulfillment of the regulation for the completion of the M.S. General Surgery degree examination to be held in 2016.This work has been carried out in the Department of General Surgery, Coimbatore Medical College and Hospital, Coimbatore under the guidance of Dr. S.Saradha, M. S, F.I.C.S, F.A.I.S, Professor of General Surgery, Coimbatore Medical College and Hospital, Coimbatore.
Date:
7
ACKNOWLEDGEMENTS
I wish to express my sincere gratitude and respect to Dr. S. Saradha. M.S, Professor of General Surgery. Without her active interest, constant and continuous guidance and direct supervision, this work would not have been possible. I am grateful to Prof. Dr. V. Elango, M.S., Professor and Head of the Department of General Surgery, Coimbatore Medical College
Hospital, for his valuable inputs. My gratitude to Dr. R.Radhika .M.S, Dr.Umamaheshwari. M.S, Assistant Professors, Department of general Surgery, for their support and guidance. I am grateful to my teachers, Staff members of the Department of Surgery for their constant guidance and suggestions. I extend my gratitude towards my seniors, juniors and colleague post graduates in the Department of Surgery who were always ready to help. Last but not the least I thank my patients in this study.
Date :
8 CONTENTS
SI.NO. PARTICULARS PAGE NO.
1. INTRODUCTION 1
2. AIM & OBJECTIVES 3
3. REVIEW OF LITERATURE 4
4. MATERIALS AND METHODS 34
5. RESULTS 38
6. DISCUSSION 65
7. CONCLUSION 67
8. BIBLIOGRAPHY 68
9. ANNEXURES
ANNEXURE I - PROFORMA 76
ANNEXURE II – CONSENT FORM 79
9
LIST OF TABLES
S. NO TITLE PAGE NO.
1 Classification of shock 32 2 SOFA score on admission 38 3 SOFA at 48hours for non-survivors 42 4 SOFA at 96 hours for non-survivors 45 5 SOFA score 48hour changes 48 6 SOFA score 96 hour changes 51
7 Outcome based on sex 61
10
LIST OF FIGURES
S. NO TITLE PAGE NO.
1 Ignaz Semmelweis 4
2 William osler 5
3 Robert koch 6
4 Initiation of inflammatory response 10 5 Pathway showing inflammatory response 11 6 Management of septic shock 14
7 APACHE scoring system 17
8 SAPS scoring system 18
9 Mortality probability models 19 10 Therapeutic intervention scoring system 20
11 SOFA scoring system 21
12 Arterial blood gas analyser(ABG) 24
13 Glasgow coma scale 30
14 Shock induced vicious cycle 33 15 ROC curve for admission SOFA 40 16 Comparison between admission SOFA and number of
deaths
41
17 ROC curve for SOFA at 48hours 43 18 Comparison between SOFA at 48hours and number of
deaths
44
11
20 Comparison between SOFA at 96hours and number of deaths
47
21 ROC curve for SOFA 48hour changes 49 22 Comparison between SOFA 48hour changes and
number of deaths
50
23 ROC curve for SOFA 96hour changes 52 24 Comparison between SOFA 96hour changes and
number of deaths
53
12
INTRODUCTION
Multi - organ dysfunction syndrome (MODS) is the leading cause of morbidity and mortality for patients admitted with sepsis, and develops in about 15% of all admissions. Over the past years many scoring models have been developed to describe the severity of illness in patient admitted with sepsis. As an example, the first Sepsis-related Organ Failure Assessment score, later called the Sequential Organ Failure Assessment (SOFA) score, was introduced in 1994(1).The aim was to quantify the severity of the patient’s illness based on the degree of organ dysfunction, serially over time. Although severity of illness scoring systems such as the Acute Physiology and Chronic Health Evaluation (APACHE) II and the Simplified Acute Physiology Score (SAPS) II are based on the first 24hrs of admission, the SOFA scoring system takes into account the time course of a patient's condition during the entire stay in the hospital . This enables surgeons to follow the evolving disease process.
The Sequential Organ Failure Assessment (SOFA) score is a simple and objective score that allows for calculation of both the number and the severity of organ dysfunction in six organ systems. It is a six-organ dysfunction score measuring multiple organ failure daily. Each organ is graded from 0 (normal) to 4 (the most abnormal).
13
14
AIMS AND OBJECTIVES
1. To assess the incidence and severity of organ dysfunction in patients with sepsis in surgical unit
15
REVIEW OF LITERATURE
HISTORY
The word sepsis was first coined by Hippocrates (460-370bc) and it is derived from greek word .
[image:15.612.272.390.220.387.2]
Figure 1 Ignaz Semmelweis
16
fact, he lowered the mortality rate to 2.55% by introducing hand washing using chlorinated lime solution before any gynaecological procedures.
However, these hygienic measures were not accepted and his colleagues harassed him and made him to leave the city .In 1863, after around 15yrs of his findings, his work was published as "Aetiology, terminus and prophylaxis of puerperal fever" (Die Aetiologie, der Begriff und die Prophylaxis des Kindbettfiebers)(42). Semmelweis later died from wound infection. It is an irony of fate that he died from the same disease that he detected.
[image:16.612.251.407.445.640.2]William Osler, was considered as father of American medicine, made his observations in treatise The Evolution of Modern Medicine: “Except on few occasions, the patient appears to die from the body's response to infection rather than from it.”(5)
17
From 1878 - 1880, Robert Koch, (41) District Medical Officer for Wollstein. He developed the following four postulates to identify the ssociation between organisms with specific diseases:
1. The microorganism or other pathogen must be present in all cases of the disease.
2. The pathogen can be isolated from the diseased host and grown in pure culture.
3. The pathogen from the pure culture must cause the disease when inoculated into a healthy, susceptible laboratory animal.
[image:17.612.243.426.411.656.2]4. The pathogen must be re-isolated from the new host and shown to be the same as the originally inoculated pathogen.
18
The French chemist Louis Pasteur (1822-1895) discovered that a single cell organisms caused putrefaction. He found that as microbes and these are responsible for causing the disease.(6) He also found that the bacteria can be killed by heating at specific temperature.
This meant that a fluid could be sterilised. He was able to elucidate the principle that contagious diseases are caused by specific microbes and that these microbes are foreign to the infected organism.
DEFINITIONS
19
Infection is defined as presence of microorganism in the body tissue or in blood stream associated with inflammatory response to that organism . At the site of infection the classic findings of rubor, calor, and dolor in areas like the skin or subcutaneous tissue are common.
SIRS Criteria is as follows:
Heart rate ≥ 90 beats/min
Respiratory rate ≥20/min OR PaCo2<32mmHg
Temperature ≥38°C (100.4oF) or ≤36°C (96.8oF
WBC total count ≥12,000/mL or ≤4,000/mL
SIRS can be caused by a variety of disease processes, including pancreatitis, polytrauma, malignancy, and transfusion reaction, and infection. SIRS caused by infection is termed sepsis, and is mediated by the production of a cascade of pro-inflammatory mediators produced by exposure to microbial products.
20
Frequently, patients suffering from septic shock are cared for in intensive care unit. The mortality rate from septic shock is approximately 25– 50%.(38) Septic shock is defined as stage of SIRS (Systemic inflammatory response syndrome), in which sepsis, severe sepsis and multi organ
dysfunction were considered as different stages of its patho-physiological
process.
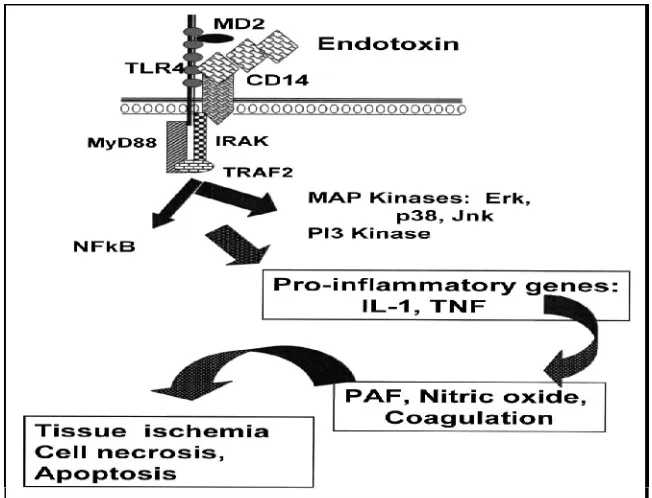
PATHOPHYSIOLOGY
21
Figure 4: Initiation Of Inflammatory Response
Experimental evidence indicates that excessive production of nitric oxide, a potent vasodilator, is a primary mechanism for the reduced SVR in patients with septicshock. Because of the induction of a potent enzyme system, patients with severe sepsis and septic shock produce large amounts of nitric oxide, and elevated generation of nitric oxide near vascular smooth muscle overwhelm the vasoconstrictive effects of the endogenous vasoconstricting
22
Figure 5 : Pathway Showing Inflammatory Response
MULTI ORGAN DYSFUNCTION SYNDROME
The abnormal function or failure of more than one organ or organ system requiring medical support to maintain homeostasis is called MODS(8). In a susceptible individual, under the influence of associated co-morbidities, the organ systems fail one by one ultimately leading to a complicated disease process and death.
Pathogenesis: The general principles governing the syndrome of multiorgan dysfunction are,(46)
23
These observations remain true across various critical care settings all over the world. Systemic inflammatory response syndrome (SIRS) is the common basis for multi organ system failure. Infection is by far the commonest cause of SIRS. Though other triggers like pancreatitis, trauma and burns etc can also elicit a similar response.
MANAGEMENT OF SEPTIC SHOCK(33)
Treatment of septic shock consists of following methods
Volume resuscitation
Early antibiotic administration
Early goal directed therapy
Rapid source identification and control.
Support of major organ dysfunction.
Sequestration of lipopolysaccharides.
24
therapy, which covers a wide range of potential causative organisms, is tied to better outcomes.
Because lowered blood pressure, in septic shock contributes to poor perfusion, fluid resuscitation is an initial treatment to increase blood volume. Crystalloids such as normal saline and lactated Ringer's solution are recommended as the initial fluid of choice(9), while the use of colloid solutions such as hydroxyethyl starch have not shown any advantage or decrease in mortality. When large quantities of fluids are given, administering albumin has shown some benefit.
Among the choices for vasopressors, norepinephrine is superior to dopamine in septic shock. Norepinephrine is the preferred vasopressor, while epinephrine can be added to norepinephrine when needed. Low dose vasopressin may also be used as an addition to norepinephrine, but is not recommended as a first-line treatment. Dopamine can cause rapid heart rate and arrhythmias, and is only recommended in combination with norepinephrine in those with slow heart rate and low risk of arrhythmia(31). In the initial treatment of hypotension in septic shock, the goal of vasopressor treatment is a mean arterial pressure (MAP) of 65mm Hg.(47)
25
Low dose steroids (hydrocortisone) for 5 – 7 days led to improved outcomes.
[image:25.612.118.535.359.613.2] Recombinant activated protein C (drotrecogin alpha) in a 2011 concrane review was found not to decrease mortality and thus was not recommended for use. Other reviews however comment that it may be effective in those with very severe disease. The first and only activated protein C drug, drotrecogin alfa (Xigris)(10), was voluntarily withdrawn in October 2011 after it failed to show a benefit in patients with septic shock, including the more severe disease .
26 SCORING SYSTEMS
Typically, scoring systems are used to quantify the severity of illness of a study population, to compare different populations by summarizing the cases, and more recently, as an entry criteria for certain interventional studies. They are also used to compare actual versus expected outcomes for a specific physician, ICU, hospital, or region (30). Although these systems can be applied to individual patients to predict outcome, that practice is controversial. Previous investigators have identified a link between the number of dysfunctional organs and both short-term and long-term mortality among emergency department patients with infection. A few of the most commonly used such scoring systems are
APACHE
SOFA
Simplified acute physiology score (SAPS)
Mortality probability model (MPM)
Therapeutic intervention scoring system (TISS)
Logistic organ dysfunction score (LODS)
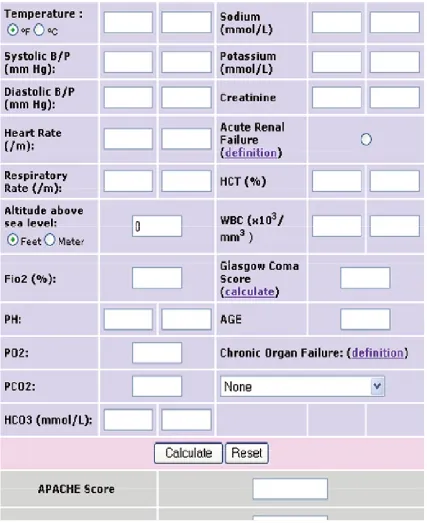
27 APACHE SCORING SYSTEM (48)
Knaus et al developed APACHE scoring system in 1985. It consists of 12 physiological variables calculated by multivariate analysis. The scores ranges from 0 – 71. The data of APACHE II are calculated using the equation(11).
In Hospital Mortality .
(R/1-R) = -3.517 + (APACHE × 0.146 + S + D)
R = Risk of death in hospital, S = Risk due to emergency surgery, and D = Risk due to any specific disease.
28
29
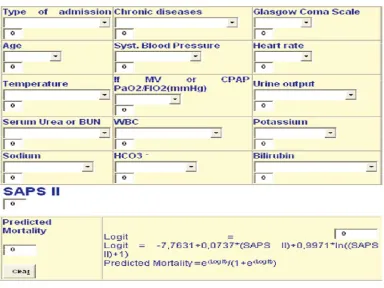
SIMPLIFIED ACUTE PHYSIOLOGY SCORE (SAPS)
[image:29.612.137.521.322.610.2]Simplified acute physiology score was introduced by Le Gall et al in 1984(28). It was designed to encounter the difficulties faced during assessment of APS used in APACHE score. It was calculated by taking the 13 most easily measurable physiological variables used in APACHE score. The total score is obtained as the highest score of ICU admission in the first 24 hours. SAPS had its advantage over APACHE II in accurately predicting mortality in a stratified group of patients.(12)
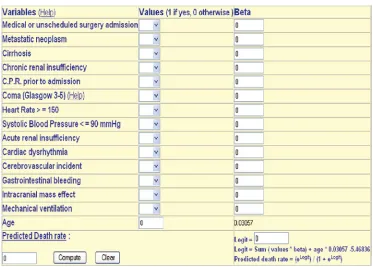
30 MORTALITY PROBABILITY MODEL
[image:30.612.138.511.405.672.2]Lemeshow et al in 1985, first published the mortality prediction model(49). He designed 4 models, like probability of death from data collected at ICU admission (MPM0), Probability of death based on 24 hours data(MPM24)probability of death based on 48 hours data(MPM48), probability of death over a period of time based on MPM0 and change in probability between MPM0 and MPM24 and change in probability between MPM24 and MPM48. Lemeshow et al also developed MPM II to assess serial changes in ICU patients over 72 hours of ICU stay(13). Hence this model had a better advantage over APACHE and SAPS since these two models lack ability of serial assessment.
31
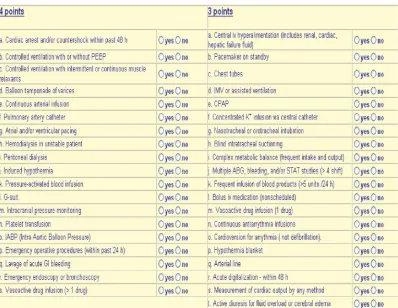
THERAPEUTIC INTERVENTION SCORING SYSTEM
[image:31.612.148.546.313.621.2]Cullen et al in 1974 developed this scoring system(14). It utilises 76 monitoring and therapeutic parameters. Scores of the first three day ICU stay correlate well with survival. So it is useful in discriminating survivors and non survivors, according to whether the score increases or decreases, respectively.(50)
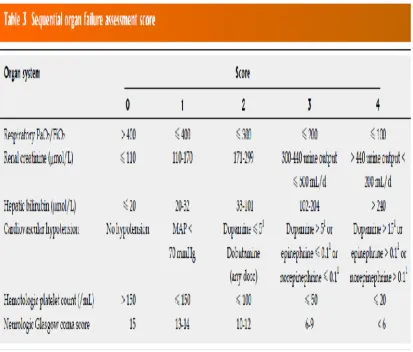
32 SOFA SCORING SYSTEM
[image:32.612.134.547.276.628.2]The SOFA score was developed in 1994, by the European Society of Intensive Care and Emergency Medicine, to provide a means to describe the degree of organ failure in individuals and groups of ICU patients. Vincent et al published the SOFA score and proved that infected patients had more risk of organ dysfunction than the non- infected .(15)
33
SOFA scoring system analyses 6 variables namely (16)
Pao2/Fio2 ratio(for respiration)
Platelets(for coagulation)
Bilirubin (for liver function)
Creatinine (for renal function)
Glasgow coma scale(to assess level of consciousness)
Blood pressure and the need for inotropic support.
A score of 0 to 4 is given for each of these six variables and a score is obtained using sum total value of each of these parameters. The worst values on each day are recorded and organ function total score can thus be monitored over time.
The increasing SOFA score and the mean SOFA score are highly useful in assessing prognosis and risk stratification of patients.
PARAMETERS
PAO2/FIO2 RATIO:
34
carrico index(27). According to AECC criteria, acute respiratory distress syndrome is diagnosed , if Pao2/Fio2 ratio is less than or equal to 200.(17)
Pao2 is the partial pressure of oxygen in the arterial blood. It is measured in millimetres of mercury (mmHg) or torr units. It is measured by an arterial blood gas analyser(ABG). Normal Pao2 is 75 – 100mmHg.
Fio2 is the percentage of oxygen in the inspired mixture of air. Normal Fio2 in inspired atmospheric air is 0.21(21%). In a mechanical ventilator it is usually set as 30 – 40%. In a mechanically ventilated patient 100% oxygen is not administered due to high risk of oxygen toxicity.
Kerbing and his co workers assessed the clinical relevance of variation in Pao2/Fio2 ratio. They demonstrated the clinical utility of this parameter.
The Pao2/Fio2 scores are
Score 0 – more than 400
Score 1 – less than or equal to 400
Score 2 – less than or equal to 300
Score 3 – less than or equal to 200
35
Figure 12 :Arterial blood gas analyser (ABG)
CREATININE
36
Severe dehydration
Acute pyelonephritis
Diabetes
Hypertension
Renal calculi
Hemorrhagic fevers
Disseminated intravascular coagulation
Autoimmune and other connective tissue disorders.
The scores used for creatinine in SOFA score are,(19)
Score 0 – less than 1.2 mg/dl
Score 1 – 1.2 to 1.9 mg/dl
Score 2 – 2.0 to 3.4 mg/dl
Score 3 – 3.5 to 4.9 mg/dl
37 PLATELET COUNT
Platelet count is used as a parameter in SOFA score to assess coagulation function and its impairment during disease states. The coagulation mechanism involves activation, adhesion and aggregation of platelets in response to a stimuli, say an injury or infection. Both platelet number and function should be adequate for this function to be intact. Coagulation cascade is one of the best understood system in humans. Primary hemostasis is mainly due to platelets, which is characterised by formation of platelet plugs. Activated platelets release stored granules into the blood. These granules contain
Serotonin
ADP
Platelet activating factor
Platelet factor 4
Vonwillebrand factor
Thromboxane A2
38
decreased platelet count. It can be either due to decreased production, increased destruction or impairment of platelet function.
Causes of thrombocytopenia (20)
Vitamin B12 and folate deficiencies
Infections like HIV disease
Leukemias
Disseminated intravascular coagulation
Thrombotic thrombocytopenic purpura
Viral infections
Gram negative septicaemia
Heparin induced thrombocytopenia
Radiation induced bone marrow suppression
Drug toxicity
The scores used for platelet count in SOFA are
Score 0 - >150 × 103/mm3
Score 1 - <150× 103/mm3
39
Score 3 - <50× 103/mm3
Score 4 - <20× 103/mm3
BILIRUBIN
` Bilirubin levels are measured as a marker of liver function. Liver plays a pivotal role in regulating a large number of metabolic pathways in the body. Bile is secreted in the hepatic lobules and it drains ultimately into the bile duct after traversing through canaliculi, small bile ducts and larger bile ducts.
It consists of bile acids, phospholipids and unesterified cholesterol. Daily bile output from the liver is 500 – 600ml. It consists of two fractions. Direct or hydrophilic type and indirect or hydrophobic type. Conjugation of indirect to direct fraction takes place in the liver, which is an enzyme mediated process. This whole array of steps in the formation to elimination of bile can be disturbed in disease states. Elevations in bilirubin levels can be used to assess liver function over time(21), which helps in predicting worsening or improvement of liver function in a patient with sepsis.
Some of the conditions in which bilirubin levels are raised are,
Acute hepatitis
Alcoholic liver disease
DIC and septicaemia
40
Haemolytic jaundice
Obstructive jaundice
Congenital liver enzyme abnormalities
Massive blood transfusion
Most biologic system in the body gets affected by excess bilirubin in blood. Normal bilirubin levels in blood are 1.0 to 1.5mg/dl. Upto 30% of that is direct or conjugated bilirubin, which equals 0.3 mg/dl. It is water soluble. The rest of the fraction is insoluble in water and it is called unconjugated bilirubin. This is the toxic form of bilirubin, which when accumulates in excess gets deposited in the brain especially in the basal ganglia which may lead to seizures or neurological deficits.
The scores used for bilirubin are
Score 0 - < 1.2 mg/dl
Score 1 – 1.2 to 1.9 mg/dl
Score 2 – 2.0 to 5.9 mg/dl
Score 3 – 6.0 to 11.9 mg/dl
41 GLASGOW COMA SCALE
It gives a reliable and objective way of recording the conscious state of a person. It is easy to use both for the medical and paramedical personnel for initial as well as continuing medical assessment in an ICU(22). It has value in predicting ultimate outcome. Three types of responses are assessed.
[image:41.612.153.501.372.658.2]GCS scale was used initially only for head injury patients. Now it is being used both for acute medical and trauma patients. It is also being used to monitor patients in ICU in a seriously ill state. The scale was published in 1974 by Graham Teasdale and Bryan J. Jennett, at the University of Glasgow Institute Of Neurological Sciences. Both of them were neurosurgeons.(23)
42
The highest possible score is 15, that is in a fully awake person. The lowest possible score is 3, which means deep coma or death.
The scores used for GCS in SOFA are
Score 0 – 15
Score 1 – 13 to 14
Score 2 – 10 to 12
Score 3 – 6 to 9
Score 4 - <6
BLOOD PRESSURE
“There is no doubt that proper functioning of our pipes and pumps does have an immediate urgency well beyond that of almost any of our other bits and pieces”. (24)
Steven vogel (vital circuits, 1992)
43
This goes on and on like a vicious cycle resulting in cellular death and multi organ dysfunction.
Classification of shock (25)
Hypovolemic Septic
Traumatic Hyperdynamic(early)
Cardiogenic Hypodynamic(late)
Intrinsic Neurogenic
[image:43.612.120.524.143.412.2]Compressive Hypoadrenal
Table 1 : Classification of shock
The scores used for blood pressure in SOFA are
Score 0 – No hypotension
Score 1- Mean arterial pressure <70
Score 2 – dopamine infusion </= 5 or requiring dobutamine
Score 3 – dopamine infusion >/= 5 or requiring nor epinephrine </=0.1
44
45
MATERIALS AND METHODS
100 patients admitted to the surgical unit in Coimbatore medical college hospital with suspected/confirmed sepsis
STUDY DESIGN
Prospective observational study
STUDY GROUP
Patients admitted to the surgical unit at Coimbatore medical college
STUDY DURATION
One year (September 2014- September 2015)
INCLUSION CRITERIA
All patients admitted to the surgical ward with suspected infection, satisfying Two or more criteria of systemic inflammation like
Heart rate ≥ 90 beats/min
Respiratory rate ≥20/min OR PaCo2<32mmHg
Temperature ≥38°C (100.4oF) or ≤36°C (96.8oF
46
Patients which are included in the study are perforation peritonitis with Septicemia, Diabetic ulcer foot with gangrene, Necrotizing fascitis of limbs and abdomen, Burns, Mesenteric ischemia with bowel gangrene, Intestinal Obstruction, Carcinoma, Blunt injury abdomen with solid organ injury.
EXCLUSION CRITERIA
All patients with age less than 12 years
All patients who will not give consent for study
Patients with HIV and chronic renal failure
Moribund and terminally ill patients with impending mortality within
48-72 hours.
SAMPLE SIZE
A total of 100 patients admitted to Coimbatore medical college surgical unit were studied
CONSENT
Informed consent was taken as per the standard procedures in the institution
ETHICAL CLEARANCE
47 PROCEDURE
All patients with suspected/confirmed sepsis admitted in the surgical unit were included in the study. This included operated, non-operated and trauma patients (eg: perforation peritonitis, Diabetic ulcer foot with gangrene Necrotizing fascitis). Patients had to fulfill two or more criteria of systemic inflammation. The parameters involved in calculating the SOFA score were collected on a daily basis . The score was calculated till discharge from ICU, mortality or day7 of admission to ward whichever was the earliest. The SOFA at admission was labelled T0 and at day 2 was labelled as T48(i.e. at 48 hours) and at day 4 was labelled as T96(i.e. at 96 hours) . The difference calculated as Delta SOFA. The Maximum, Mean and total SOFA were also calculated and Compared with outcome of the patient.
Blood Investigations were taken under aseptic conditions with adequate care and sent to the hospital 24 hours laboratory immediately. All the investigations were done in our hospital and no investigations or procedure done outside the hospital. Any experimental or so far unused materials or methods were not used on the patients. Serum bilirubin was calculated using an auto analyser using the method of malloy and evelyn.
48 STATISTICAL METHODS
49
RESULTS
SURVIVORS AND NON SURVIVORS
Among the 100 patients involved in the study 53% survived and 47% succumbed to their illness. The minimum age of the person enrolled in the study was 17 and the maximum age was 85.
SOFA SCORE ON ADMISSION
SOFA score Survivors Non survivors Total
6 – 7 5 1 6
8 – 9 19 7 26
10 – 11 13 4 17
12 and above 16 35 51
[image:49.612.125.525.248.569.2]Total 53 47 100
Table 2 : SOFA score on admission
50 AREA UNDER THE CURVE
Test Result Variable(s):SOFA ADMISSION
Area Std. Errora
Asymptotic Sig.b
Asymptotic 95% Confidence Interval
Lower Bound Upper Bound
.760 .048 .000 .665 .855
The test result variable(s): SOFAADMISSION has at least one tie between the positive actual state group and the negative actual state group. Statistics may be biased.
a. Under the nonparametric assumption
51 ROC CURVE FOR ADMISSION SOFA
52 BAR CHART
[image:52.612.128.515.143.386.2]NO. OF DEATHS
Figure 16: Comparision between Admission SOFA and No. of Deaths
The minimum admission SOFA score of patients in this study is 6. Among the 6 patients who had this score 1 patient expired. That is, the mortality rate is 16.7 %. Among the 51 patients who had an admission SOFA score of 12 and above 35 patients expired escalating the mortality rate to 68.6%.
1
7
4
35
0 10 20 30 40
SOFA 6 - 7 SOFA 8 -9 SOFA 10 - 11 SOFA 12 and
above
Admission SOFA
53
SOFA AT 48 HOURS FOR NON SURVIVORS
SOFA SCORE NO.OF NON SURVIVORS
8 – 9 3
10 - 11 4
[image:53.612.156.512.94.297.2]12 and above 40
Table 3 : SOFA at 48 hours for non survivor
At 48 hours the minimum SOFA score observed among the study population is 8. Hence the data column starts with 8 and above.
AREA UNDER THE CURVE
Test Result
Variable(s): SOFA48Hr
Area Std. Errora
Asymptotic Sig.b
Asymptotic 95% Confidence Interval
Lower Bound Upper Bound
54
The test result variable(s): SOFA 48Hr has at least one tie between the positive actual state group and the negative actual state group. Statistics may be biased.
a. Under the nonparametric assumption
b. Null hypothesis: true area = 0.5
[image:54.612.202.443.316.587.2]ROC CURVE FOR SOFA AT 48 HOURS
55 BAR CHART
[image:55.612.129.539.185.424.2]NO. OF DEATHS
Figure 18: Comparison between SOFA at 48 Hrs and No of Deaths
This picture shows that a SOFA score of 12 and above at 48 hours of admission shows an increase in the number of non survivors. The minimum SOFA score of the study population at 48 hours is 8. Among the 47 non survivors, 3 patients had these minimum score. Patients who had a score of 12 and above were 40.
3 4
40
0 5 10 15 20 25 30 35 40 45
SOFA 8 -9 SOFA 10 - 11 SOFA 12 and above
SOFA at 48 hours
56
SOFA SCORE AT 96 HOURS FOR NON SURVIVORS
SOFA SCORE NO. OF NON SURVIVORS
8 – 9 3
10 – 11 3
12 and above 41
Table 4 : SOFA Score at 96 hours for Non Survivors
AREA UNDER THE CURVE
Test Result Variable(s): SOFA 96HR
Area Std. Errora
Asymptotic Sig.b
Asymptotic 95% Confidence Interval
Lower Bound Upper Bound
57 ROC CURVE AT 96 HOURS
58 BAR DIAGRAM
[image:58.612.129.536.184.425.2]NO OF DEATHS
Figure 20: Comparison between SOFA at 96 Hrs and No of Deaths
This chart depicts that survival rate is reduced when the SOFA score increases above 12, at 96 hours of admission. At 96 hours 41 out of the 47 patients expired, had a score of 12 and above.
3 3
41
0 5 10 15 20 25 30 35 40 45
SOFA 8 - 9 SOFA 10 - 11 SOFA 12 and above
SOFA score at 96 hours
59 DELTA SOFA
It is the difference between the subsequent SOFA scores. Δ SOFA 48 is
the difference between admission score and the score at 48 hours. ΔSOFA 96 is
the difference between the score at admission and 96 hours.
SOFA SCORE 48 HOUR CHANGES
The patient data is analysed as those who decreased, unchanged and increased from the initial score respectively, and the outcome is analysed.
Δ SOFA 48 Survivors Non survivors
Decreased 35 6
Unchanged 8 9
Increased 10 32
60 AREA UNDER THE CURVE
Test Result Variable(s): SOFA 48 difference
Area Std. Errora
Asymptotic Sig.b
Asymptotic 95% Confidence Interval
Lower Bound Upper Bound
.830 .041 .000 .749 .910
[image:60.612.182.425.392.646.2]SOFA 48 HOUR CHANGES:
61 BAR CHART
[image:61.612.128.536.144.386.2]NO. OF DEATHS
Figure 22: Comparison between SOFA 48 Hrs changes and no of deaths
These data depicts that when the SOFA score is increased from admission to 48 hours, there is an increase in mortality. On contrary the mortality rate has decreased when the score falls. Among the 47 non survivors
32 (68.08%) had an increase in their Δ48 scores.
6 9
32
0 5 10 15 20 25 30 35
Decreased Unchanged Increased
62 SOFA SCORE 96 HOUR CHANGES
The patient data is analysed as those who decreased, unchanged and increased from the initial score respectively, and the outcome is analysed.
Δ SOFA 96 Survivors Non survivors
Decreased 39 7
Unchanged 7 2
Increased 7 38
63 SOFA 96 HOUR CHANGES
64 BAR CHART
[image:64.612.127.538.143.387.2]NO. OF DEATHS
Figure 24: Comparison between SOFA 96 Hrs change and no of deaths
This chart depicts mortality rate is increased when the SOFA score is increased from admission to 96 hours. On contrary, the mortality rate has decreased when the score falls. Among the 47 non survivors 38 (80.85%) had
an increase in their Δ 96 scores.
0 5 10 15 20 25 30 35 40
Decreased Unchanged Increased
65 MEAN SOFA
[image:65.612.215.468.181.407.2]Mean SOFA calculates the average value of the prognostic score during the entire hospital stay of the patient.
66 AREA UNDER THE CURVE
Test Result Variable(s): MEAN SOFA
Area Std. Errora
Asymptotic Sig.b
Asymptotic 95% Confidence Interval
Lower Bound Upper Bound
.908 .029 .000 .851 .966
COORDINATES OF THE CURVE Test Result Variable(s): MEAN SOFA
Positive if Greater
Than or Equal Toa Sensitivity 1 – Specificity 4.3333 1.000 1.000
5.6667 1.000 .962
6.3333 1.000 .925
7.0000 1.000 .755
7.5000 1.000 .660
7.8333 .979 .642
8.1667 .957 .623
8.5000 .936 .623
8.8333 .936 .491
9.1667 .936 .472
9.5000 .915 .434
67
10.5000 .894 .321
10.8333 .872 .226
11.167 0.87 0.17
11.5000 .830 .151
11.8333 .809 .132
12.1667 .766 .132
12.5000 .723 .113
12.8333 .660 .075
13.1667 .660 .057
13.5000 .617 .000
13.8333 .574 .000
14.1667 .532 .000
14.5000 .489 .000
14.8333 .404 .000
15.1667 .383 .000
15.5000 .319 .000
16.1667 .277 .000
16.8333 .213 .000
17.1667 .191 .000
17.5000 .149 .000
18.0000 .106 .000
18.5000 .064 .000
20.0000 .021 .000
68
The test result variable(s): MEAN SOFA has at least one tie between the positive actual state group and the negative actual state group.
The smallest cutoff value is the minimum observed test value minus 1, and the largest cutoff value is the maximum observed test value plus 1. All the other cutoff values are the averages of two consecutive ordered observed test values. These data shows that, a mean SOFA score of 11 and above is an excellent predictor of mortality, above which the number of non survivors increase.
TOTAL SOFA
It is the sum total of all the scores obtained from an individual patient during his hospital stay. It gives information about the severity of the illness since it gives the total worst score of all organs.
AREA UNDER THE CURVE
Test Result Variable(s):TOTALSOFA
Area Std. Errora
Asymptotic Sig.b
Asymptotic 95% Confidence Interval
Lower Bound Upper Bound
69 COORDINATES OF THE CURVE
Test Result Variable(s): TOTAL SOFA
Positive if Greater Than
or Equal Toa
Sensitivity 1 – Specificity
15.0000 1.000 1.000 17.0000 1.000 .962 19.0000 1.000 .925 21.0000 1.000 .755 22.5000 1.000 .660 23.5000 .979 .642 24.5000 .957 .623 25.5000 .936 .623 26.5000 .936 .491 27.5000 .936 .472 28.5000 .915 .434 30.0000 .915 .396 31.5000 .894 .321 32.5000 .872 .226
33.500 0.87 0.17
34.5000 .830 .151 35.5000 .809 .132 36.5000 .766 .132 37.5000 .723 .113 38.5000 .660 .075
70 40.5000 .617 .000
41.5000 .574 .000
42.5000 .532 .000
43.5000 .489 .000
44.5000 .404 .000
45.5000 .383 .000
46.5000 .319 .000
48.5000 .277 .000
50.5000 .213 .000
51.5000 .191 .000
52.5000 .149 .000
54.0000 .106 .000
55.5000 .064 .000
60.0000 .021 .000
71
The test result variable(s): TOTAL SOFA has at least one tie between the positive actual state group and the negative actual state group.
The smallest cutoff value is the minimum observed test value minus 1, and the largest cutoff value is the maximum observed test value plus 1. All the other cutoff values are the averages of two consecutive ordered observed test values
72 OUTCOME BASED ON SEX
Sex Survivors Non survivors Total
Male 33 36 69
Female 20 11 31
[image:72.612.128.538.294.536.2]Total 53 47 100
Table 7 : Outcome Based on Sex
GRAPHIC REPRESENTATION
Figure 26: Comparison between outcome and Sex
Out of 69 male patients, 36 (52.2%) patients expired and out of 31 female patients, 11(35.5%) patients expired.
0% 10% 20% 30% 40% 50% 60% 70% 80% 90% 100%
Male Female
Non survivors
73
OUTCOME FOR VENTILATOR SUPPORT
Mechanical Ventilation status
Survivors Non survivors
Ventilated 8 33
[image:73.612.127.538.302.545.2]Non ventilated 45 14
Table 8 : Outcome for ventilator support
GRAPHIC REPRESENTATION
Figure 27: Comparison between Outcome and Ventilator Support
Among the 41 patients ventilated 33 (80.5%) expired and among the 59 patients who did not require ventilator support 14 (23.7%) expired.
0% 10% 20% 30% 40% 50% 60% 70% 80% 90% 100%
ventilated non ventilated
non survivors
74
52 48
non-operated
operated
OPERATED AND NON-OPERATED CASES
Status of operation Operated Non-operated Total
Survivors 27 26 53
Non-survivors 21 26 47
[image:74.612.129.520.290.535.2]Total 48 52 100
Table 9 : Operated And Non-Operated Cases
GRAPHIC REPRESENTATION
75 STATUS OF BODY FLUID CULTURES
Positive 45
[image:75.612.128.524.350.592.2]Negative 55
Table 10 : Status of Body Fluid Cultures
GRAPHICAL REPRESENTATION
Figure 29 : Comparison between Status of Body Fluid Cultures
positive
76
DISCUSSION
Since the cost of health care is increasing day to day, assessment of a patient’s prognosis is vital during the course of treatment. Outcome prediction gains importance in this regard. So scoring systems have been used to predict this. SOFA scoring system, because of its simplicity and easy applicability, has been widely used in critical situation. This system has also been evaluated in many ICUs and found to be useful as a simple bedside tool.
In our study sex of the patient did not play a significant role in influencing mortality. The morbidity and mortality is purely related to the underlying disease state.
But, the need for mechanical ventilation clearly predicted mortality outcome, since the patients who were ventilated showed a higher mortality rate compared to those who did not require ventilator support, as evidenced by the statistically significant p value < 0.001.
There is a significant increase in mortality rate when the SOFA score is above 12. There is a steep rise in the mortality curve at this value. Admission SOFA, 48 hours SOFA and 96 hours SOFA are all statistically significant with a p value < 0.001
77
patients whose delta SOFA values when increased from the previous value, there is a greater chance that the patient may succumb to his illness.
Mean SOFA value also proved to be an independent predictor of mortality. A value of more than 11 showed a sharp rise in mortality.
78
CONCLUSION
SOFA score is very useful in predicting mortality in critically ill patients, since there is a strong correlation between a rise in the score and mortality in all stages of admission.
Mechanically ventilated patients have a high risk of mortality compared to non ventilated patients.
The total SOFA and Mean sofa are better predictors of mortality.
Delta SOFA score is also a better predictor of mortality.
Early prediction of outcome in sepsis using SOFA score is useful to aid suitable modification of management strategies.
In our study, out of 51 patients whose admission SOFA score was very high (above 12), 16 patients were survived .This data depicts that, with early prediction of outcome using SOFA score and suitable therapeutic intervention, 16 critically ill patients were survived .
Same way out of 32 pts whose SOFA score on admission was low (less than 8), 8 pts died. This data depicts, even with low SOFA score on admission, few patients died, because so many other factors are also contributing to the death of critically ill patients.
79
BIBLIOGRAPHY
1. Marshall JC, Cook DJ, Christou NV, Bernard GR, Sprung CL, Sibbald
WJ.Multiple Organ Dysfunction Score:A reliable descriptor of a complex clinical outcome;Crit Care Med 1995, 23:1638-1652.
2. Annette M Esper and Greg S Martin et al. Extending international sepsis epidemiology: the impact of organ dysfunction;Critical Care 2009, 13:120.
3. Vincent JL, Moreno R, Takala J, et al. The SOFA (Sepsis-related Organ Failure Assessment) score to describe organ dysfunction/failure. Intensive Care Med 1996;22:707–710.
4. TommiPätilä, SinikkaKukkonen, Antti Vento, MD, et al. Relation of the Sequential Organ Failure Assessment Score to Morbidity and Mortality After Cardiac Surgery. Ann Thorac Surgery 2006;82:2072-2078
5. Acharya SP, Pradhan B, Marhatta MNet al. Application of "the Sequential Organ Failure Assessment (SOFA) score" in predicting outcome in ICU patients with SIRS. Kathmandu University Med J (KUMJ) 2007 Oct-Dec;5(4):475-83.
80
7. Jansen TC, van Bommel J, Woodward R, et al. Association between blood lactate levels, Sequential Organ Failure Assessment subscores, and 28-day mortality during early and late intensive care unit stay: a retrospective observational study. Crit Care Med 2009 Aug;37(8):2369-74.
8. F. Charles Brunicardi. Schwartz's Principles of Surgery, Ninth Edition. The McGraw-Hill Companies, Inc.2010
9. Osler W. The Evolution of Modern Medicine. New Haven, CT: Yale University Press, 1913, p 1
10. Wangensteen OH, Wangensteen SD: Germ theory of infection and disease, in Wangensteen OH, Wangensteen SD: The Rise of Surgery: From Empiric Craft to Scientific Discipline. Minneapolis: University of Minnesota Press, 1978, p 387
11. Louis H. Alarcon.Townsend: Sabiston Textbook of Surgery, 18th ed.Saunders. Elsevier 2008
12. Marshall JC, Cook DJ, Christou NV, et al: Multiple organ dysfunction score: A reliable descriptor of a complex clinical outcome. Crit Care Med 1995; 23:1638.
81
14. Valles J, Rello J, Ochagavia A, et al: Community-acquired bloodstream infection in critically ill patients. Chest 123:1615, 2003.
15. Van den Berghe G, Wouters P, Weekers F, et al: Intensive insulin therapy in the critically ill patients. N Engl J Med, 2001; 345:1359.
16. Ventilation with lower tidal volumes as compared with traditional tidal volumes for acute lung injury and the acute respiratory distress syndrome. The Acute Respiratory Distress Syndrome Network. N Engl J Med, 2000; 342:1301.
17. Abramson D, Scalea TM, Hitchcock R, et al: Lactate clearance and survival following injury. J Trauma 35:584; discussion 588, 1993.
18. Shapiro N, Howell MD, Bates DW, et al. The association of sepsis syndrome and organ dysfunction with mortality in emergency department patients with suspected infection. Ann Emerg Med 2006; 48:583–590.
19. Zimmerman JE, Kramer A. Acute Physiology and Chronic Health Evaluation (APACHE) IV: Hospital mortality assessment for today's critically ill patients. Crit Care Med 2006; 34:1297–1310.
82
21. Le Gall JR, Klar J, Lemeshow S, et al. The Logistic Organ Dysfunction system. A new way to assess organ dysfunction in the intensive care unit. ICU Scoring Group. JAMA 1996; 276:802–810.
22. Higgins TL, Teres D, Copes WS, et al. Assessing contemporary intensive care unit outcome: An updated Mortality Probability Admission Model (MPMO-III). Crit Care Med 2007; 35:827–835.
23. Jones AE, Trzeciak S, Kline JA et al. The Sequential Organ Failure Assessment score for predicting outcome in patients with severe sepsis and evidence of hypoperfusion at the time of emergency department presentation. Crit Care Med. 2009 May;37(5):1807-8.
24. GS Shrestha, R Gurung, R Amatya. Comparison of acute physiology, age, chronic health evaluation III score with initial sequential organ failure assessment score to predict ICU mortality. Nepal Med Coll J 2011 ; 139(1) : 50 54
25. Levy MM, Macias WL, Vincent JL, et al. Early changes in organ function predict eventual survival in severe sepsis. Crit Care Med 2005;33:2194–2201.
83
27. Bakker J, Coffernils M, Leon M, et al: Blood lactate levels are superior to oxygen-derived variables in predicting outcome in human septic shock. Chest1991; 99:956–962
28. Nguyen HB, Rivers EP, Knoblich BP, et al: Early lactate clearance is associated with improved outcome in severe sepsis and septic shock. Crit Care Med 2004; 32:1637–1642
29. Gillespie DJ, Marsh HMM, Divertie MB, et al. Clinical outcome of respiratory failure in patients requiring prolonged (24 hours) mechanical ventilation. Chest 1986;90:364 – 369
30. Suchyta MR, Clemmer TP, Elliot CG, et al. The adult respiratory syndrome: a report of survival and modifying factors. Chest 1992;101:1074-1079
31. Rubenfeld GD, Caldwell, Peabody E,et al. Incidence and outcomes of acute lung injury. N Engl J med 2005; 353:1685 -1693.
32. Lim W, Qushmaq I, Cook DJ, Crowther MA, Heels-Ansdell D, et al. (2005) Elevated troponin and myocardial infarction in the intensive care unit: a prospective study. Crit Care 9: R636-644.
84
34. Lim W, Qushmaq I, Cook DJ, Crowther MA, Heels-Ansdell D, et al. (2005) Elevated troponin and myocardial infarction in the intensive care unit: a prospective study. Crit Care 9: R636-644.
35. Ammann P, Maggiorini M, Bertel O, Haenseler E, Joller-Jemelka HI, et al. (2003) Troponin as a risk factor for mortality in critically ill patients without acute coronary syndromes. J Am Coll Cardiol 41: 2004-2009.
36. Bell RC, Coalson JJ, Smith JD, Johanson WG (1983) Multiple organ failure and infection in adult respiratory distress syndrome. Ann Intern Med 99: 293±298
37. Tran DD, Cuesta MA (1992) Evaluation of severity in patients with acute pancreatitis. Am J Gastroenterol 87: 604±608
38. Marshall WG, Dimick AR (1983) Natural history of major burns with multiple subsystem failure. J Trauma 23: 102±105
39. Henao FJ, Daes JE, Dennis RJ (1991) Risk factors for multiorgan failure: a case-control study. J Trauma 31: 74±80
40. Faist E, Baue AE, Dittmer H, Heberer G (1983) Multiple organ failure in polytrauma patients. J Trauma 23: 775±787
85
42. Bernard GR, Doig BG, Hudson G, et al. (1995) Quantification of organ failure for clinical trials and clinical practice. Am J Respir Crit Care Med 151: A323
43. Marshall JC, Cook DA, Christou NV, Bernard GR, Sprung CL, Sibbald WJ (1995) Multiple organ dysfunction score: a reliable descriptor of a complexclinical outcome. Crit Care Med 23: 1638±1652
44. Le Gall JR, Klar J, Lemeshow S, et al. (1996) The logistic organ dysfunction system. A new way to assess organ dysfunction in the intensive care unit. JAMA 276: 802±810
45. Knaus WA, Draper EA, Wagner DP, Zimmerman JE (1985) APACHE II: a severity of disease classification system. Crit Care Med 13: 818±829
46. Knaus WA, Wagner DP, Draper EA, et al. (1991) The APACHE III prognostic system. Risk prediction of hospital mortality for critically ill hospitalized adults. Chest 100: 1619±1636
86
48. Wagner DP, Knaus WA, Harrel FE Jr, Zimmerman JE, Watts C (1994) Daily prognostic estimates for critically ill adults in intensive care units: results from a prospective, multicenter, inception cohort analysis. Crit Care Med 22:1359±1372
49. Zimmerman JE, Knaus WA, Sun X, Wagner DP (1996) Severity stratification and outcome prediction for multisystem organ failure and dysfunction. World J Surg 20: 401±405 696
87
ANNEXURE – I
PROFORMA
I. Basic Details:
Name of the patient :
Age (in years) :
Sex : M / F
Diagnosis :
Surgery :
II. History:
i. Chief Complaints
ii. Duration
iii. History of present illness
iv. Past History
a. History of Pulmonary Disease
b. History of Diabetes
c. History of Heart Disease
d. History of previous surgery
v. Personal History
88 III. General Examination:
Pulse rate :
Blood Pressure :
Respiratory Rate :
SPO2(saturation) :
Temperature :
Glassgow coma score :
IV. Systemic Examination:
i. Cardiovascular system
ii. Respiratory system
iii. Per abdomen examination
iv. Central nervous system
V. Blood investigations
I Serum creatinine
II Serum bilirubin
III Platelet count
VI.Follow up of patients
89
SOFA SCORE
0 1 2 3 4
Respiration
PaO2/FIO2 (mmHg) SaO2/FIO2
>400 <400 221– 301 <300 142–220 <200 67–141 <100 <67 Coagulation Platelets 103/mm3
>150 <150 <100 <50 <20
Liver
Bilirubin (mg/dL)
<1.2 1.2–1.9 1.9 2.0–5.9 6.0–11.9 >12.0
Cardiovascular Hypotension No hypotension MAP <70 Dopamine </=5 or Dobutamine (any) Dopamine >5 or norepinep hrine </=0.1 Dopamine >15 or norepinep hrine >0.1 CNS
Glasgow Coma score
15 13-14 10-12 6-9 <6
Renal
Creatinine (mg/dL) or urine output(ML/dl)
<1.2 1.2– 1.9
2.0–3.4 3.5–4.9 or <500
>5.0 or <200
90
ANNEXURE - II
INFORMED CONSENT
DEPARTMENT OF GENERAL SURGERY
Coimbatore Medical College, Coimbatore
I have been invited to participate in the research project titled “use of SOFA(SEQUENTIAL ORGAN FAILURE ASSESSMENT) scoring in
assessing the incidence and severity of organ dysfunction and predicting the
outcome inpatients with sepsis in surgical unit”
I understand, it will be answering a set of questionnaire, undergo physical examination, investigations and appropriate treatment. I also give consent to utilise my personal details for study purpose and can be contacted if necessary. I am aware that I have the right to withdraw at any time which will not affect my medical care.
Name of the participant :
Signature :
91
ANNEXURE - III
MASTER CHART
S.NO Name AGE SEX DIAGNOSIS SOFA SCORE ON
ADMISSION
SOFA SCORE AT 48 HOURS
SOFA SCORE
AT 96 HOURS OUTCOME
VENTILATOR
SUPPORT OPERATED
1 MURUGESAN 45 M PERFORATED PERITONITIS WITH
SEPTICAEMIA 9 11 15 B YES YES
2 VIJAYA 39 F PERFORATED PERITONITIS WITH
SEPTICAEMIA 6 6 4 A NO YES
3 LAKSHMI 40 F ELEPHANT ATTACK 8 10 13 B YES NO
4 HAESHAN 35 M PERFORATIVE PERITONITIS 10 12 10 A NO YES
5 KUMAR 65 M ILEAL PERFORATION 12 16 18 B NO YES
6 YANISHA 19 F INTRACRANIAL SOLITARY LESION 10 12 12 B YES NO
7 RAMAKRISHNAN 42 M DUODENAL PERFORATION 8 14 14 B YES YES
8 BALAMANI 60 F SIGMOID VOLVULUS 12 10 10 A YES YES
9 MANIKKAM 70 M CARCINOMA STOMACH 13 15 15 B YES YES
10 SUMATHI 40 F 60% THERMAL BURNS 16 20 20 B NO NO
11 SELVAM 57 M POSTAPPENDICECTOMY SEPTICEMIA 8 6 6 A NO YES
12 GOVINDARAJ 71 M GASTRIC PERFORATION 8 4 4 A NO YES
13 AMUDHA 40 F 30% BURNS WITH SEPTICEMIA 6 6 6 A YES NO
14 JENCY 52 F CELLULITIS LT LOWER LIMB 8 10 10 A NO YES
15 KANNAN 38 M BLUNT INJURY ABDOMEN 15 18 20 B NO YES
16 SUBRAMANYAN 35 M STAB INJURY WITH LIVER LACERATION 8 6 6 A NO YES
17 DEVRAJ 74 M SMALL BOWEL PERFORATION 15 18 18 B NO YES
18 KARUPPASAMY 50 M RUPTURED LIVER ABSCESS 12 10 10 A NO YES
19 KRISHNAN 63 M ACUTE INTESTINAL OBSTRUCTION 10 6 6 A NO YES
20 VALLIYAMMAL 45 F 85% MIXED DEGREE BURNS 8 10 10 B YES NO
21 SELVAM 70 M CAECAL PERFORATION WITH
92
22 SANGEETHA 17 F 50% BURNS 12 16 16 B YES NO
23 SIVAIKUMAR 28 M PERFORATIVE PERITONITIS 10 8 8 A NO YES
24 MURUGESH 40 M ACUTE MESENTRIC ISCHEMIA 12 10 9 A NO YES
25 KITTUSAMY 50 M SMALL BOWEL GANGRENE 8 6 6 A NO YES
26 RAMASAMY 65 M ILEAL PERFORATION 12 10 10 B NO YES
27 KANNARAJAN 65 M PERFORATIVE PERITONITIS 10 14 16 B NO YES
28 NANJAMMAL 70 F 40% MIXED DEGREE BURNS 8 10 8 A NO NO
29 MARUGATHAM 47 F CELLULITIS WITH GANGRENE LT UPPER
LIMB 11 10 10 A NO NO
30 SUBBATHAL 60 F DIABETIC ULCER FOOT 14 12 12 A NO NO
31 BHUAMAN 59 M CARCINOMA RECTUM WITH
SECONDARIES 16 18 19 B NO NO
32 HYDHARALI 59 M DIABETES WITH MULTIORGAN FAILURE 15 20 20 B YES NO
33 GOWRISANKAR 68 M GANGRENE FOOT 12 16 18 B YES NO
34 CHANDRAN 41 M PERFORATIVE PERITONITIS 13 10 10 A NO YES
35 KRISHNAVENI 50 F DIABETIC ULCER FOOT 15 12 12 A NO NO
36 RANGASAMY 75 M CELLULITIS RT UPPER LIMB 11 10 10 A YES NO
37 JAYARAM 60 M GANGRENE FOOT 11 15 15 B YES NO
38 THNGAVEL 66 M CELLULITIS RT LOWER LIMB 8 8 8 A NO NO
39 GOWRIYAMMAL 52 F CELLULITIS RT LOWER LIMB 8 10 8 A NO NO
40 MOHAMMED 70 M CELLULITIS RT FOREARM 12 10 10 A NO NO
41 IRUDHAYA RAJ 55 M DIABETIC FOOT LT LOWER LIMB 8 6 6 A NO YES
42 BALU 37 M 30%BURNS 12 10 12 A YES NO
43 MICHIYAMMAL 74 F PERFORATIVE PERITONITIS 12 13 13 B YES YES
44 RAJASEKAR 35 M 30% BURNS 13 10 10 A YES NO
45 VINOTH 54 M GANGRENE RT FOOT 10 12 14 B YES NO
46 SARAVANAN 25 M PERFORATIVE PERITONITIS 10 8 8 A NO YES
47 RAMESH 46 M CARCINOMA PANCREAS 15 15 16 B YES NO
93 49 LAKSHMI 50 F OBSTRUCTED INCISIONAL HERNIA WITH
FECAL FISTULA 13 14 16 B YES YES
50 PRADEEP 50 M CELLULITIS RT LOWER LIMB 8 6 6 A NO NO
51 GUNASEKAR 60 M 60% ELECTRICAL BURNS 12 16 16 B YES NO
52 NOORJAHAN 53 F DIABETIC FOOT LT LOWER LIMB 8 7 7 A NO NO
53 NATARAJAN 55 M NECROTIZING FASCITIS RT LOWER LIMB 14 16 17 B YES NO
54 SANGUMUTHU 40 M SMALL BOWEL GANGRENE 10 9 8 A NO YES
55 RAVISANKAR 52 M CELLULITIS LT LOWER LIMB 16 16 18 B YES NO
56 GOVINDAN 66 M GANGRENE RT FOOT 13 12 12 B YES NO
57 MANISHARMA 56 M PERFORATIVE PERITONITIS 14 15 16 B YES YES
58 LAKSHMI 43 F DIABETIC FOOT LT LOWER LIMB 11 10 10 A NO NO
59 SELVARAJ 46 M FOURNIERS GANGRENE 16 19 20 B YES NO
60 BAKKIAMMAL 80 F DIABETIC FOOT WITH COPD 13 10 10 A NO NO
61 INBARAASU 72 M HEPATOCELLULAR CARCINOMA 8 8 9 B NO NO
62 ELANGOVAN 46 M BLUNT INJURY ABDOMEN 8 6 6 A NO YES
63 PALANIYAMMAL 75 F CELLULITIS BOTH LOWER LIMBS 10 8 8 A YES NO
64 ANBUMANI 61 M SNAKE BITE CELLULITIS 8 10 10 A NO YES
65 SIVASENBAGAM 40 F GANGRENE RT FOOT 12 12 10 B NO NO
66 SUNDAR 45 M 80% BURNS 16 12 12 B YES NO
67 HARIHARAN 35 M 30% BURNS 8 7 7 A NO NO
68 BATHRAN 60 M DIABETIC ULCER LT LOWER LIMB 8 6 6 A NO NO
69 PALANISAMY 65 M DIABETIC GANGRENE LT LOWER LIMB 12 16 16 B YES NO
70 MARIYAPPAN 66 M CELLULITIS LT LOWER LIMB 7 10 9 A NO YES
71 LAKSHMI 45 F NECROTIZING FASCITIS RT LOWER LIMB 16 18 18 B YES NO
72 SATHISH 30 M STRANGULATED INGUINAL HERNIA 20 22 22 B YES YES
73 KANDHASAMY 60 M INTESTINAL OBSTRUCTION WTH BOWEL
GANGRENE 10 6 6 A NO YES
74 SULOCHANA 63 F DIABETIC ULCER RT FOOT 16 12 12 A NO NO
94
76 AYYASAMY 49 M SMALL BOWEL GANGRENE 16 18 18 B N0 YES
77 SUSEELA 45 F DIABETIC KETOACIDOSIS WITH
CELLULITIS 6 6 6 A NO NO
78 UMADEVI 60 F CELLULITIS BOTH LOWER LIMBS 12 14 14 A NO NO
79 RAMASAMY 60 M ISCHEMIC BOWEL DISEASE 18 16 16 B YES NO
80 PANDIYAN 40 M PNEUMOTHORAX 10 8 8 A NO YES
81 ABDUL RAHAMAN 53 M CARCINOMA STOMACH 12 14 16 B YES NO
82 ANTONY MURTHY 75 M PERFORATIVE PERITONITIS 13 12 12 A NO YES
83 MANIKANDAN 25 M POLYTRAUMA-POST SPLEENECTOMY 13 16 18 B NO YES
84 MANILLAVARASAN 43 M ILEOCOLIC INTUSUSSEPTION 12 12 8 A YES YES
85 MURUGESAN 45 M GASTROJEJUNOSTOMY WITH STOMAL
PERFORATION 8 8 6 A NO YES
86 SUBRAMANI 65 M CARCINOMA RECTUM 14 14 16 B YES NO
87 RAMACHANDRAN 47 M ILEAL PERFORATION 8 8 8 B YES YES
88 RAJAN 60 M MESENTERIC VASCULAR ISCHAEMIA 13 13 12 B NO YES
89 SELVARAJ 59 M HEPATOCELLULAR CARCINOMA 6 8 9 B YES NO
90 THANGAMMAL 58 F NON-HEALING ULCER LT FOOT 12 12 13 B YES NO
91 THIRUMOORTHY 50 M BOWEL ISCHAEMIA 14 12 12 A NO NO
92 PRIYADHARSHINI 23 F SNAKE BITE CELLULITIS 8 6 6 A NO NO
93 MUNUSAMY 63 M PERFORATIVE PERITONITIS 10 10 9 A NO YES
94 RAMACHANDRAN 35 M RUPTURED LIVER ABSCESS 13 12 13 B YES YES
95 PHILOMINA 65 F DIABETIC FOOT RT 9 10 10 A NO NO
96 SAROJA 70 F DIABETIC FOOT RT 14 13 13 A YES NO
97 ARUNKUMR 20 M PERFORATIVE PERITONITIS 10 12 13 A NO YES
98 GOPAL 63 M CARCINOMA RECTOSIGMOID 16 16 18 B NO YES
99 LAKSHMI 45 F CELLULITIS LT LOWER LIMB 6 7 7 A NO NO
100 KUMAR 38 M ILEAL PERFORATION 8 8 7 A NO YES