Copyright © 2003, American Society for Microbiology. All Rights Reserved.
Cellular Gene Expression Survey of Vaccinia Virus Infection
of Human HeLa Cells
Susana Guerra,
1Luis A. Lo´pez-Ferna´ndez,
2Alberto Pascual-Montano,
3Manuel Mun˜oz,
2Keith Harshman,
2† and Mariano Esteban
1,2,3*
Department of Molecular and Cellular Biology,
1Department of Immunology and Oncology,
2and Biocomputing
Unit,
3Centro Nacional de Biotecnología, Consejo Superior de Investigaciones Científicas,
Campus Universidad Auto´noma, 28049 Madrid, Spain
Received 3 February 2003/Accepted 10 March 2003
Vaccinia virus (VV) is a cytocidal virus that causes major changes in host cell machinery shortly after
infecting cells. To define the consequences of virus infection on host gene expression, we used microarrays of
approximately 15,000 human cDNAs to examine expression levels of mRNAs isolated at 2, 6, and 16 h
post-infection from cultures of infected HeLa cells. The majority of profiling changes during VV post-infection
corre-sponded to downregulation of genes at 16 h postinfection. Differentially expressed genes were clustered into
seven groups to identify common regulatory pathways, with most of them (90%) belonging to clusters 6 and 7,
which represent genes whose expression was repressed after infection. Cluster 1, however, contained 37
transcripts (2.81%) showing a robust pattern of induction that was maintained during the course of infection.
Genes in cluster 1 included those for Wiskott-Aldrich syndrome protein (WASP) family member WASF1,
thymosine, adenosine A2a receptor, glutamate decarboxylase 2, CD-80 antigen, KIAA0888 protein, selenophosphate
synthetase, pericentrin, and attractin as well as several expressed sequence tags. We analyzed in more detail the fate
of WASP protein in VV-infected cells, because a related family member, N-WASP, is involved in viral motility. WASP
protein accumulated in the course of infection; its increase required viral DNA replication and de novo protein
synthesis, and it localized in cytoplasmic structures distinct from uninfected cells. This study is the first quantitative
analysis of host gene expression following VV infection of cultured human cells, demonstrating global changes in the
expression profile, and identifies upregulated genes with potential roles in the virus replication cycle.
Vaccinia virus
(VV) is a member of the
Poxviridae
family, a
group of large, double-stranded DNA viruses that reproduce
exclusively in the cytoplasm of the infected host cell (28). The
VV genome is subdivided into three temporally expressed
classes, termed early, intermediate, and late genes, which
en-code over 200 proteins, including most of the enzymes and
factors required for transcription, genome replication, and
virion assembly (28). Immediately after infection, early VV
genes are transcribed, but the first steps of viral DNA
replica-tion are required to transcribe late and intermediate genes
(44). The genomes of a number of poxviruses have been
se-quenced and found to contain virulence genes (20, 24; www
.poxviruses.org).
Poxvirus infection induces a number of changes in cell
func-tion, metabolism, and cellular morphology (7). The cytopathic
effect observed early after vaccinia virus infection is linked to a
strong rearrangement of the cell cytoskeleton (2, 18, 31).
Moreover, actin fibers are actively mobilized by nascent viral
particles to form tails that are induced by intracellular
enve-lope virus particles (10, 35). In addition, cell motility is also
modified after infection (36).
Vaccinia virus infection also interferes with multiple steps
in host gene expression. First, VV induces an immediate and
rapid inhibition of HeLa RNA synthesis and processing (5, 30).
In addition, virus-induced degradation of actin and tubulin
mRNAs has been well documented in early reports (33).
Con-current with the degradation of cellular mRNA, the virus
pro-ceeds in orderly temporal expression of its own genetic
informa-tion (33). Finally, host translainforma-tion is drastically impaired, while
viral protein synthesis takes place at maximal efficiency (3, 4).
Although many aspects of the biology of this virus have been
described, little is known of its impact on host gene expression.
The recent development of high-density cDNA microarrays
allows simultaneous expression profiling of thousand of genes
and represents a powerful approach with which to study the
impact of viral infections on gene expression (6, 9, 15, 21, 29,
32, 43, 45). To obtain a more comprehensive view of the global
effects of VV infection on human cells at the mRNA level, we
performed cDNA microarray analysis of mRNAs obtained
from VV-infected HeLa cells at various times postinfection
and evaluated about 15,000 human cDNAs. We identified
sev-eral mRNAs from a variety of cellular mechanisms whose
levels were altered by VV infection. Genes involved in known
cellular pathways and expressed sequence tags (ESTs) were
defined as being differentially regulated by VV infection.
(Part of this work was presented at the XIVth International
Poxvirus and Iridovirus Meeting, 20-25 September 2002, Lake
Placid, N.Y.)
MATERIALS AND METHODS
Cells, viruses, and infection conditions.HeLa cells (ATCC) were cultured in Dulbecco’s medium supplemented with 10% newborn bovine serum and antibi-otics. VV wild-type, Western Reserve strain (WR), was grown in spinner HeLa
* Corresponding author. Mailing address: Centro Nacional de
Bio-tecnología, Consejo Superior de Investigaciones Científicas, Campus
Universidad Auto´noma, 28049 Madrid, Spain. Phone: (34)
91/585-4503. Fax: (34) 91/585-4506. E-mail: [email protected].
† Present address: Center for Integrative Genomics, Universite´ de
Lausanne, Lausanne, Switzerland.
6493
on November 8, 2019 by guest
http://jvi.asm.org/
cells and purified by banding on sucrose gradients as described previously (11) and titrated in monkey BSC-40 cells. All infections were performed at a multi-plicity of infection of 5 PFU/cell with VV.
Microarray fabrication.To generate cDNA arrays, we used the Research Genetics 40K clone human cDNA library sequence verified (http://www.resgen .com/products/SVHcDNA.php3). Forty plates containing 15,360 clones (most of known genes) were selected and grown in Luria-Bertani (LB) plus 7.5% glycerol medium (overnight, 37°C). PCRs were performed with 3l of each bacterial culture as the template and 5 U of GibcoTaqpolymerase (Invitrogen) in the following buffer: 20 mM Tris-HCl (pH 9.0), 8.5 mM NaCl, 10 mM KCl, 10 mM (NH4)2SO4, 2 mM MgSO4, 0.4 mM deoxynucleoside triphosphate mix, 0.5M
forward primer (5⬘-CTG CAA GGC GAT TAA GTT GGG TAA C-3⬘), and 0.5
M reverse primer (5⬘-GTG AGC GGA TAA CAA TTT CAC ACA GGA AAC AGC-3⬘). Amplification was performed in the following conditions: 1 min of initial denaturation, 40 cycles of 30 s at 94°C, 45 s at 60°C, and 4 min at 72°C, and a final extension of 10 min at 72°C. cDNAs were confirmed with MultiScreen PCR 96-well (Millipore) and confirmed by agarose gel. Finally, PCR products were reformatted to 384-well plates, dried, and resuspended in 50% dimethyl sulfoxide. Printing was performed on CMT-GAPS II slides (Corning) with a Total Array System (BioRobotics) at 22°C and 40 to 45% relative humidity.
Microarray hybridization.Total RNA from VV-infected (5 PFU/cell) or mock-infected HeLa cells cultured in 10-cm plates was isolated with RNAwiz (Ambion) following the manufacturer’s instructions. Each RNA (40g) was labeled with dUTP-indodicarbocyanine (Cy5) or dUTP-indocarbocyanine (Cy3) (Pharmacia-Biotech) by direct labeling during the reverse transcription. Mock-infected sample was labeled with Cy3, and the Mock-infected sample was labeled with Cy5. This combination was changed in one experiment (mock/Cy5 and VV-infected/Cy3) to abolish differences in labeling and hybridization due to the specific characteristics of each Cy-labeled dUTP. Briefly, a mixture containing 40
g of RNA, 150 pmol of oligo(dT)20,, 0.5 mM each dATP, dGTP, and dCTP, 0.1
mM dTTP, 0.05 mM Cy3/Cy5-dUTP, 1⫻first-strand reaction buffer (Invitrogen), and 10 mM dithiothreitol in a volume of 38l was heated (65°C, 5 min) and preincubated (42°C, 5 min), after which 400 U of SuperScript II (Invitrogen) and 40 U of RNase Inhibitor (Roche) were added and the mixture was incubated (42°C, 2.5 h).
The reaction was terminated with EDTA, and the starting RNA template was
removed by adding 2l of 10 N NaOH, followed by incubation (65°C, 20 min). The reaction was then neutralized by adding 4l of 5 M acetic acid. Cy5 and Cy3 probes were mixed, and unincorporated dye was removed by isopropanol pre-cipitation. Probes were resuspended in deionized water, and blocking reagents were added to increase specificity: poly(A) (20g; Sigma), tRNA (20g; Sigma), and human Cot-1 DNA (20g; Invitrogen). While the probes were drying in a Speed-Vac, microarray slides were prehybridized in 6⫻SSC (1⫻SSC is 0.15 M NaCl plus 0.015 M sodium citrate)–0.5% sodium dodecyl sulfate (SDS)–1% bovine serum albumin (42°C, 1 h). Slides were finally rinsed five times with water and dried by centrifugation (563⫻g, 1 min). Probes were resuspended in 40l of hybridization buffer (50% formamide, 6⫻SSC, 0.5% SDS, 5⫻Denhardt’s solution) and incubated with slides (42°C, 16 h) in hybridization chambers (Ar-ray-It) in a water bath in the dark. After incubation, slides were washed twice in 0.1⫻SSC–0.1% SDS for 5 min each and three times in 0.1⫻SSC for 5 min each. Finally, the slides were dried by centrifugation as before and scanned on a ScanArray 4000 (Packard Biosciences) with ScanArray 3.1 software.
Images from Cy5 and Cy3 were equilibrated, and spots were quantified with QuantArray 3.0 software (Packard Biosciences). Raw data were normalized based on the signal of genes that did not undergo variation after infection, as confirmed by Northern blot (genes APEXL2 and FLJ20643). Data from a single hybridization were viewed as log2-ratio (Cy3/Cy5) in which significant variations from 1 (no change) were indicative of increased (⬎2) or decreased (⬍⫺2) levels of gene expression relative to the mock-infected sample. The data shown were obtained from three independent experiments. Experiments 1 and 2 corre-sponded to mRNA obtained at 2, 6, and 16 h postinfection, and experiment 3 corresponded to mRNA obtained at 6 and 16 h postinfection.
Gene expression analysis.All samples were prepared from HeLa cells grown in monolayers and infected with sucrose-purified VV. Hybridization was per-formed in triplicate, and only those genes whose log2-ratio values were consis-tently repeated in all the replicates were included in the analysis. For this purpose, we removed inconsistent replicates with quite restrictive criteria based on maximum distance to the median value: for each replicated gene, we calcu-lated the log2-ratio median and removed those values that were beyond 1 from the median value. In this way, we assured the consistency of the resulting data set.
A variation filter was then used to eliminate genes that did not change
signif-FIG. 1. Representation of 10 by 5 map obtained by the self-organizing maps algorithm, showing the gene expression clusters for VV-infected
HeLa cells. Experimental points on the
x
axis are indicated as 1 for 2 h, 2 for 6 h, and 3 for 16 h postinfection. The
y
axis shows normalized
expression values. Each cluster depicted was numbered from 1 to 7.
on November 8, 2019 by guest
http://jvi.asm.org/
icantly across samples (flat patterns). In this case, genes that did not show an abundance ratio of 2.0 in at least one experimental condition were eliminated from the data set. The resulting data set after the different preprocessing steps was composed of 1,318 genes. The length of each resulting expression vector was normalized to 1 previous to clustering.
To classify gene expression profiles into groups according to their behavior patterns, cluster analysis was carried out by self-organizing maps (22, 42). Since the experimental data contain only three conditions (2 h, 6 h, and 16 h), a simple three-dimensional scatter plot would be sufficient for visual clustering of the data set. Nonetheless, as visual inspection might fail to detect subtle variation patterns hidden in the data set, a more sophisticated technique (self-organizing maps) was used in this study for clustering purposes. Self-organizing maps is a powerful technique that allows nonlinear projection of the original data onto a two-dimensional grid so that the resulting map is ordered according to certain data features, allowing a simple, intuitive visualization of the clustering structure. To calculate the self-organizing maps, we used the Engene software package (www .engene.cnb.uam.es) (14).
The expression patterns were projected onto a 10 by 5 hexagonal grid with the self-organizing maps algorithm. Each node in the map is an expression profile representing a subset of the expression patterns under analysis. The self-orga-nizing maps algorithm was trained in two phases, a global ordering and a fine adjustment (22). In the first stage, the algorithm was iterated 100,000 times, linearly decreasing the learning rate from 0.3 to 0. The neighborhood radius was also linearly decreased from 5 to 1. In the second fine-adjustment phase, the algorithm was iterated 500,000 times, varying the learning rate linearly from 0.1 to 0 and decreasing the neighborhood radius linearly from 2 to 1 (22).
Northern blot.Total RNA (20g) was fractionated by electrophoresis through 1% agarose gels containing formaldehyde and blotted in 20⫻SSC onto Nytran nylon membranes (Schleicher and Schuell). cDNA fragments were labeled with [32P]dCTP with the ReadyPrime system (Amersham). Hybridization was
per-formed in Church buffer (0.2 M sodium phosphate [pH 7], 1 mM EDTA, 1% bovine serum albumin, 10% SDS) at 68°C overnight. Membranes were washed twice in 2⫻SSC–0.1⫻SDS (65°C, 1 h) and twice in 0.1⫻SSC–0.1⫻SDS (65°C, 1 h) and exposed for 12 h to a Storm phosphorimager (Molecular Dynamics, Sunnyvale, Calif.).
Quantitative real-time RT-PCR.One microgram of RNA was reverse tran-scribed according to the Superscript first-strand synthesis system for reverse transcription-PCR (RT-PCR) protocol (Invitrogen). A 1:40 dilution of the RT reaction mixture was used in the quantitative PCR. Primers, probe set, and protocols used for the amplification of PCNT2, WASF1, and IL-6ST were per-formed with the instructions of the manufacturer (Assay-on-Demand of Applied Biosystems). Gene expression quantification with Assay-on-Demand is opti-mized to work with TaqMan Universal PCR MasterMix, No AmpErase UNG. We used the human housekeeping gene hypoxanthine ribosyltransferase (HPRT) for internal calibration. The thermal cycler conditions were 2 min at 50°C, 10 min at 95°C, and then 40 cycles of 15 s at 95°C followed by 1 min at 60°C. The amplification of cDNA was carried out in a 96-well reaction plate. All the samples were assayed in duplicate. The threshold cycle (Ct) values were used to plot a standard curve in whichCtdecreased in linear proportion of the log of the template copy number. The correlation values of standard curves were always more than 99%.
FIG. 2. Characteristic expression patterns represented in each cluster. Mean values (left) and standard deviations (right) of the expression
profiles of genes assigned to each cluster. Experimental points on the
x
axis are as in Fig. 1. The
y
axis shows normalized expression values. Cluster
4 was not included because it contains only one transcript (0.08%).
on November 8, 2019 by guest
http://jvi.asm.org/
Western blot.HeLa cells were infected at a multiplicity of infection of 5 PFU/ cell with VV, collected, and lysed at 2, 6, and 16 h postinfection in lysis buffer (50 mM Tris-HCl [pH 8.0], 0.5 M NaCl, 10% NP-40, 1% SDS) maintained on ice for 5 min. Equal amounts of protein lysates were separated by SDS-polyacryl-amide gel electrophoresis on 14% or 8% gels, transferred to nitrocellulose membranes, and reacted with primary antiactin (Sigma), antitubulin (Sigma), and anti-Wiskott-Aldrich syndrome (WAS) family member antibodies (kindly provided by Antonio Bernad) and with secondary antibodies (mouse and rabbit immunoglobulin-peroxidase conjugates). Protein expression was detected with ECL Western blotting reagents (Amersham).
Immunofluorescence.HeLa cells cultured on coverslips were infected at 5 PFU/cell with VV. At 2, 6, and 16 h postinfection, cells were washed with phosphate-buffered saline, fixed with 4% paraformaldehyde, and permeabilized with 0.1% Triton X-100 in phosphate-buffered saline (room temperature, 10
min). Cells were incubated with antibodies to the A27L viral protein (monoclo-nal antibody C3␣14k) together with anti-WAS family member antibody and the DNA-staining reagent ToPro (Molecular Probes). Images were obtained with a Bio-Rad Radiance 2100 confocal laser microscope.
RESULTS
Analysis of clusters.
We used human cDNA microarrays to
study the global transcriptional response of HeLa cells infected
with VV (WR strain). We chose HeLa cells because they are
highly susceptible to VV infection and many fundamental
stud-ies of VV biology have been performed with this cell line. To
study the cellular transcriptional response during VV
infec-tion, we compared the relative abundance of a specific mRNA
in infected cells with the same specific mRNA from
mock-infected cells in cDNA microarrays. The gene expression
clus-ters of the resulting 1,318 genes that passed the filtering
con-ditions are depicted in Fig. 1. In global terms, expression of
most of these genes (90%) was downregulated at 6 to 16 h after
VV infection. However, a more detailed analysis of profiles led
us to group the genes into seven main clusters according to
their behavior over the three time points of VV infection.
These clusters seem to represent specific regulation patterns,
and the average profiles for each of the clusters depicted are
shown in Fig. 2.
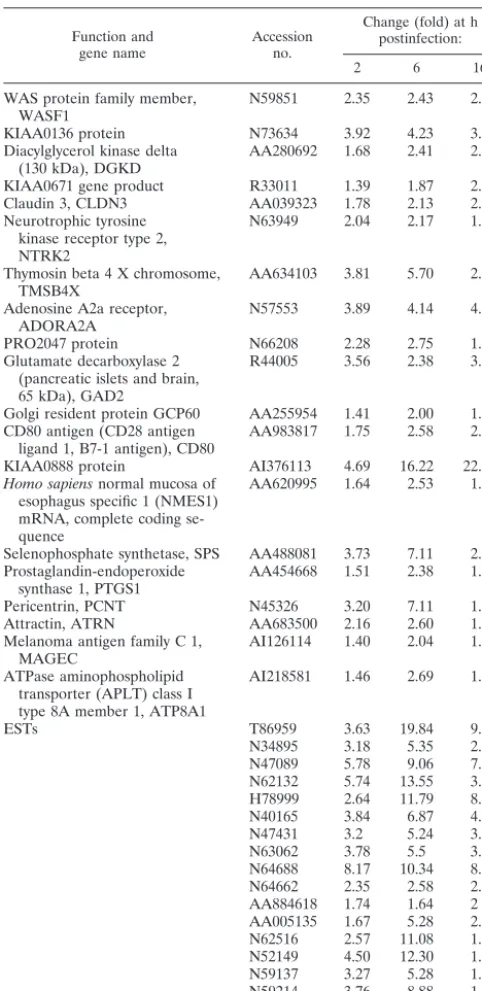
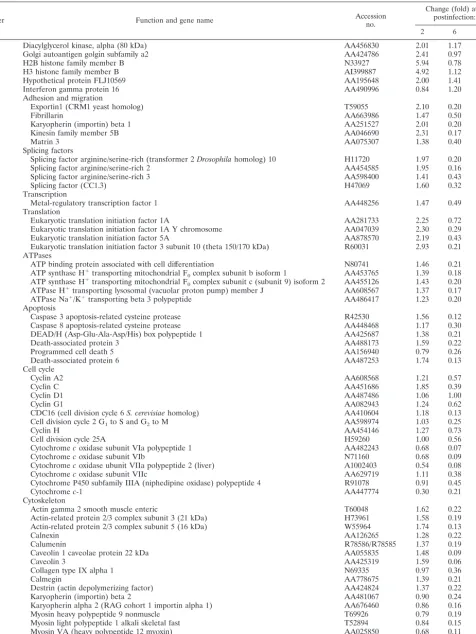
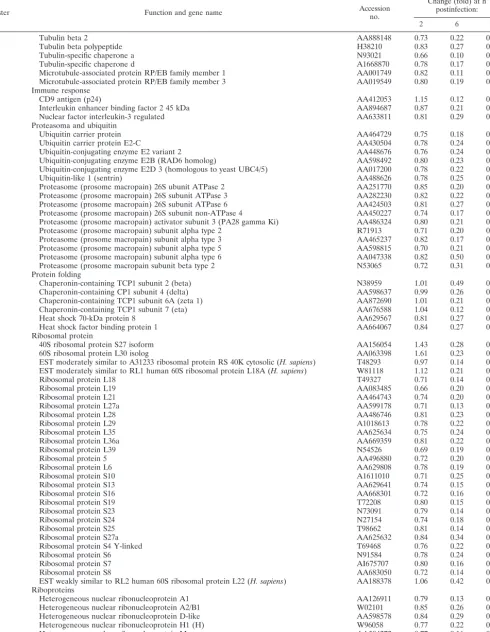
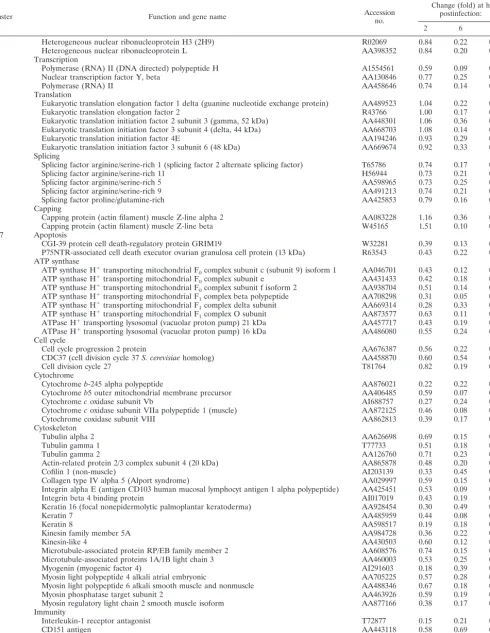
[image:4.603.43.284.80.576.2]Clusters 1 to 3 correspond roughly to three different kinetics
of gene activation, whereas clusters 4 to 7 show different
re-pression kinetics. Cluster 1 contained 37 transcripts (2.81%)
that were upregulated during the infection; it is the only cluster
TABLE 1. Genes in cluster 1
Function and
gene name Accessionno.
Change (fold) at h postinfection:
2 6 16
WAS protein family member,
WASF1 N59851 2.35 2.43 2.99
KIAA0136 protein N73634 3.92 4.23 3.81
Diacylglycerol kinase delta
(130 kDa), DGKD AA280692 1.68 2.41 2.55 KIAA0671 gene product R33011 1.39 1.87 2.20 Claudin 3, CLDN3 AA039323 1.78 2.13 2.30 Neurotrophic tyrosine
kinase receptor type 2, NTRK2
N63949 2.04 2.17 1.83
Thymosin beta 4 X chromosome,
TMSB4X AA634103 3.81 5.70 2.91
Adenosine A2a receptor,
ADORA2A N57553 3.89 4.14 4.11
PRO2047 protein N66208 2.28 2.75 1.77
Glutamate decarboxylase 2 (pancreatic islets and brain, 65 kDa), GAD2
R44005 3.56 2.38 3.14
Golgi resident protein GCP60 AA255954 1.41 2.00 1.79 CD80 antigen (CD28 antigen
ligand 1, B7-1 antigen), CD80 AA983817 1.75 2.58 2.06 KIAA0888 protein AI376113 4.69 16.22 22.78
Homo sapiensnormal mucosa of esophagus specific 1 (NMES1) mRNA, complete coding se-quence
AA620995 1.64 2.53 1.28
Selenophosphate synthetase, SPS AA488081 3.73 7.11 2.17 Prostaglandin-endoperoxide
synthase 1, PTGS1 AA454668 1.51 2.38 1.21
Pericentrin, PCNT N45326 3.20 7.11 1.58
Attractin, ATRN AA683500 2.16 2.60 1.41
Melanoma antigen family C 1,
MAGEC AI126114 1.40 2.04 1.26
ATPase aminophospholipid transporter (APLT) class I type 8A member 1, ATP8A1
AI218581 1.46 2.69 1.57
ESTs T86959 3.63 19.84 9.45
[image:4.603.301.541.416.726.2]N34895 3.18 5.35 2.85 N47089 5.78 9.06 7.16 N62132 5.74 13.55 3.71 H78999 2.64 11.79 8.28 N40165 3.84 6.87 4.63 N47431 3.2 5.24 3.18 N63062 3.78 5.5 3.05 N64688 8.17 10.34 8.69 N64662 2.35 2.58 2.16 AA884618 1.74 1.64 2 AA005135 1.67 5.28 2.23 N62516 2.57 11.08 1.72 N52149 4.50 12.30 1.46 N59137 3.27 5.28 1.73 N59214 3.76 8.88 1.80 N51223 2.81 4.92 1.83
TABLE 2. Genes in cluster 2
Function and
gene name Accessionno.
Change (fold) at h postinfection:
2 6 16
Suppression of tumorigenicity 14,
ST14 AA489246 1.8 4.56 0.93
Solute carrier family 4 anion
exchanger member 3, SLC4A3 AA609880 1.58 2.10 0.95 Postmeiotic segregation increased
(Saccharomyces cerevisiae) 1, PMS
AA504838 1.49 3.14 0.81
KIAA1288 protein AA621202 1.43 2.36 0.87 KIAA0082 protein AA504460 1.39 2.33 0.89 Hypothetical protein FLJ23018 T83664 1.43 2.43 0.85 Hypothetical protein FLJ10748 AA398335 1.07 2.08 0.93
Homo sapiensmRNA from
chro-mosome 5q21-22, clone:357Ex AA481425 1.44 2.81 1.08
Homo sapienscDNA FLJ13569
fis, clone PLACE1008369 AA478962 1.15 2.01 0.79 GT198 complete ORF
HUMGT198A AA134555 1.62 2.25 0.79
ESTs N48707 2.35 11.79 1.58
AA461091 1.41 2.03 0.75 AA101833 1.55 2.17 0.88 AA446019 1.57 2.93 0.87 AA399260 1.45 2.51 0.84 AA905171 1.49 2.27 0.92 N51444 3.16 8.40 1.36 N63609 2.79 7.94 1.37 AA621192 1.57 3.20 0.74 AA620632 2.64 3.61 1.06 AA620746 1.32 3.01 0.84 DKFZP434D193 protein N63452 2.25 6.87 0.81 Chromosome 16 open reading
frame 5 AA401341 1.40 3.12 1.11
on November 8, 2019 by guest
http://jvi.asm.org/
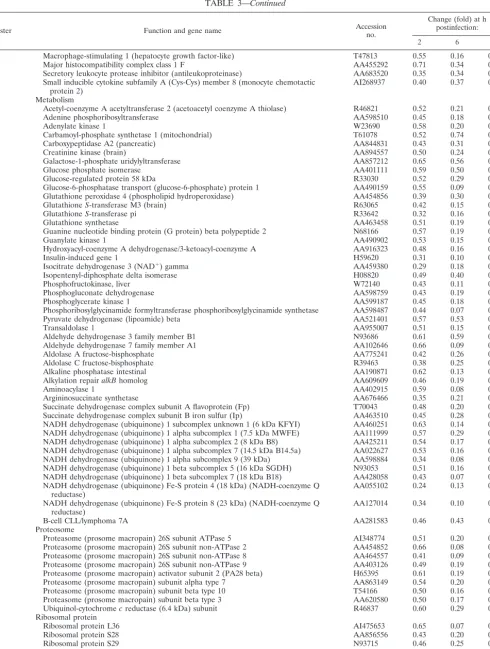
TABLE 3. Genes in clusters 3 to 7
Cluster Function and gene name Accessionno.
Change (fold) at h postinfection:
2 6 16
3 Diacylglycerol kinase, alpha (80 kDa) AA456830 2.01 1.17 0.90
Golgi autoantigen golgin subfamily a2 AA424786 2.41 0.97 1.01
H2B histone family member B N33927 5.94 0.78 0.61
H3 histone family member B AI399887 4.92 1.12 1.11
Hypothetical protein FLJ10569 AA195648 2.00 1.41 0.85
4 Interferon gamma protein 16 AA490996 0.84 1.20 0.33
5 Adhesion and migration
Exportin1 (CRM1 yeast homolog) T59055 2.10 0.20 0.15
Fibrillarin AA663986 1.47 0.50 0.49
Karyopherin (importin) beta 1 AA251527 2.01 0.20 0.18
Kinesin family member 5B AA046690 2.31 0.17 0.17
Matrin 3 AA075307 1.38 0.40 0.48
Splicing factors
Splicing factor arginine/serine-rich (transformer 2Drosophilahomolog) 10 H11720 1.97 0.20 0.15
Splicing factor arginine/serine-rich 2 AA454585 1.95 0.16 0.12
Splicing factor arginine/serine-rich 3 AA598400 1.41 0.43 0.31
Splicing factor (CC1.3) H47069 1.60 0.32 0.20
Transcription
Metal-regulatory transcription factor 1 AA448256 1.47 0.49 0.50 Translation
Eukaryotic translation initiation factor 1A AA281733 2.25 0.72 0.50 Eukaryotic translation initiation factor 1A Y chromosome AA047039 2.30 0.29 0.29 Eukaryotic translation initiation factor 5A AA878570 2.19 0.43 0.35 Eukaryotic translation initiation factor 3 subunit 10 (theta 150/170 kDa) R60031 2.93 0.21 0.14 6 ATPases
ATP binding protein associated with cell differentiation N80741 1.46 0.21 0.11 ATP synthase H⫹transporting mitochondrial F
0complex subunit b isoform 1 AA453765 1.39 0.18 0.12
ATP synthase H⫹transporting mitochondrial F
0complex subunit c (subunit 9) isoform 2 AA455126 1.43 0.20 0.09
ATPase H⫹transporting lysosomal (vacuolar proton pump) member J AA608567 1.37 0.17 0.11
ATPase Na⫹/K⫹transporting beta 3 polypeptide AA486417 1.23 0.20 0.13
Apoptosis
Caspase 3 apoptosis-related cysteine protease R42530 1.56 0.12 0.04 Caspase 8 apoptosis-related cysteine protease AA448468 1.17 0.30 0.21 DEAD/H (Asp-Glu-Ala-Asp/His) box polypeptide 1 AA425687 1.38 0.21 0.20
Death-associated protein 3 AA488173 1.59 0.22 0.21
Programmed cell death 5 AA156940 0.79 0.26 0.23
Death-associated protein 6 AA487253 1.74 0.13 0.12
Cell cycle
Cyclin A2 AA608568 1.21 0.57 0.39
Cyclin C AA451686 1.85 0.39 0.14
Cyclin D1 AA487486 1.06 1.00 0.35
Cyclin G1 AA082943 1.24 0.62 0.40
CDC16 (cell division cycle 6S. cerevisiaehomolog) AA410604 1.18 0.13 0.08 Cell division cycle 2 G1to S and G2to M AA598974 1.03 0.25 0.18
Cyclin H AA454146 1.27 0.73 0.45
Cell division cycle 25A H59260 1.00 0.56 0.47
Cytochromecoxidase subunit VIa polypeptide 1 AA482243 0.68 0.07 0.38
Cytochromecoxidase subunit VIb N71160 0.68 0.09 0.10
Cytochromecoxidase ubunit VIIa polypeptide 2 (liver) A1002403 0.54 0.08 0.06
Cytochromecoxidase subunit VIIc AA629719 1.11 0.38 0.36
Cytochrome P450 subfamily IIIA (niphedipine oxidase) polypeptide 4 R91078 0.91 0.45 0.41
Cytochromec-1 AA447774 0.30 0.21 0.04
Cytoskeleton
Actin gamma 2 smooth muscle enteric T60048 1.62 0.22 0.13
Actin-related protein 2/3 complex subunit 3 (21 kDa) H73961 1.58 0.19 0.12 Actin-related protein 2/3 complex subunit 5 (16 kDa) W55964 1.74 0.13 0.09
Calnexin AA126265 1.28 0.22 0.15
Calumenin R78586/R78585 1.37 0.19 0.11
Caveolin 1 caveolae protein 22 kDa AA055835 1.48 0.09 0.03
Caveolin 3 AA425319 1.59 0.06 0.03
Collagen type IX alpha 1 N69335 0.97 0.36 0.19
Calmegin AA778675 1.39 0.21 0.11
Destrin (actin depolymerizing factor) AA424824 1.37 0.22 0.21
Karyopherin (importin) beta 2 AA481067 0.90 0.24 0.33
Karyopherin alpha 2 (RAG cohort 1 importin alpha 1) AA676460 0.86 0.16 0.17
Myosin heavy polypeptide 9 nonmuscle T69926 0.79 0.19 0.20
Myosin light polypeptide 1 alkali skeletal fast T52894 0.84 0.15 0.15 Myosin VA (heavy polypeptide 12 myoxin) AA025850 0.68 0.11 0.11 Procollagen-proline 2-oxoglutarate 4-dioxygenase (proline 4-hydroxylase) beta AA426212 0.79 0.28 0.26
Tubulin alpha brain-specific AA865469 0.71 0.20 0.24
Continued on following page
on November 8, 2019 by guest
http://jvi.asm.org/
TABLE 3—
Continued
Cluster Function and gene name Accessionno.
Change (fold) at h postinfection:
2 6 16
Tubulin beta 2 AA888148 0.73 0.22 0.26
Tubulin beta polypeptide H38210 0.83 0.27 0.31
Tubulin-specific chaperone a N93021 0.66 0.10 0.14
Tubulin-specific chaperone d A1668870 0.78 0.17 0.22
Microtubule-associated protein RP/EB family member 1 AA001749 0.82 0.11 0.11 Microtubule-associated protein RP/EB family member 3 AA019549 0.80 0.19 0.18 Immune response
CD9 antigen (p24) AA412053 1.15 0.12 0.06
Interleukin enhancer binding factor 2 45 kDa AA894687 0.87 0.21 0.26 Nuclear factor interleukin-3 regulated AA633811 0.81 0.29 0.27 Proteasoma and ubiquitin
Ubiquitin carrier protein AA464729 0.75 0.18 0.19
Ubiquitin carrier protein E2-C AA430504 0.78 0.24 0.26
Ubiquitin-conjugating enzyme E2 variant 2 AA448676 0.76 0.24 0.27 Ubiquitin-conjugating enzyme E2B (RAD6 homolog) AA598492 0.80 0.23 0.26 Ubiquitin-conjugating enzyme E2D 3 (homologous to yeast UBC4/5) AA017200 0.78 0.22 0.25
Ubiquitin-like 1 (sentrin) AA488626 0.78 0.25 0.26
Proteasome (prosome macropain) 26S ubunit ATPase 2 AA251770 0.85 0.20 0.31 Proteasome (prosome macropain) 26S subunit ATPase 3 AA282230 0.82 0.22 0.33 Proteasome (prosome macropain) 26S subunit ATPase 6 AA424503 0.81 0.27 0.42 Proteasome (prosome macropain) 26S subunit non-ATPase 4 AA450227 0.74 0.17 0.30 Proteasome (prosome macropain) activator subunit 3 (PA28 gamma Ki) AA486324 0.80 0.21 0.37 Proteasome (prosome macropain) subunit alpha type 2 R71913 0.71 0.20 0.32 Proteasome (prosome macropain) subunit alpha type 3 AA465237 0.82 0.17 0.29 Proteasome (prosome macropain) subunit alpha type 5 AA598815 0.70 0.21 0.32 Proteasome (prosome macropain) subunit alpha type 6 AA047338 0.82 0.50 0.66 Proteasome (prosome macropain subunit beta type 2 N53065 0.72 0.31 0.47 Protein folding
Chaperonin-containing TCP1 subunit 2 (beta) N38959 1.01 0.49 0.37 Chaperonin-containing CP1 subunit 4 (delta) AA598637 0.99 0.26 0.17 Chaperonin-containing TCP1 subunit 6A (zeta 1) AA872690 1.01 0.21 0.13 Chaperonin-containing TCP1 subunit 7 (eta) AA676588 1.04 0.12 0.07
Heat shock 70-kDa protein 8 AA629567 0.81 0.27 0.22
Heat shock factor binding protein 1 AA664067 0.84 0.27 0.22
Ribosomal protein
40S ribosomal protein S27 isoform AA156054 1.43 0.28 0.23
60S ribosomal protein L30 isolog AA063398 1.61 0.23 0.17
EST moderately similar to A31233 ribosomal protein RS 40K cytosolic (H. sapiens) T48293 0.97 0.14 0.14 EST moderately similar to RL1 human 60S ribosomal protein L18A (H. sapiens) W81118 1.12 0.21 0.15
Ribosomal protein L18 T49327 0.71 0.14 0.21
Ribosomal protein L19 AA083485 0.66 0.20 0.28
Ribosomal protein L21 AA464743 0.74 0.20 0.27
Ribosomal protein L27a AA599178 0.71 0.13 0.20
Ribosomal protein L28 AA486746 0.81 0.23 0.31
Ribosomal protein L29 A1018613 0.78 0.22 0.31
Ribosomal protein L35 AA625634 0.75 0.24 0.33
Ribosomal protein L36a AA669359 0.81 0.22 0.31
Ribosomal protein L39 N54526 0.69 0.19 0.27
Ribosomal protein 5 AA496880 0.72 0.20 0.29
Ribosomal protein L6 AA629808 0.78 0.19 0.28
Ribosomal protein S10 A1611010 0.71 0.25 0.34
Ribosomal protein S13 AA629641 0.74 0.15 0.23
Ribosomal protein S16 AA668301 0.72 0.16 0.23
Ribosomal protein S19 T72208 0.80 0.15 0.23
Ribosomal protein S23 N73091 0.79 0.14 0.23
Ribosomal protein S24 N27154 0.74 0.18 0.27
Ribosomal protein S25 T98662 0.81 0.14 0.22
Ribosomal protein S27a AA625632 0.84 0.34 0.43
Ribosomal protein S4 Y-linked T69468 0.76 0.22 0.29
Ribosomal protein S6 N91584 0.78 0.24 0.33
Ribosomal protein S7 AI675707 0.80 0.16 0.24
Ribosomal protein S8 AA683050 0.72 0.14 0.22
EST weakly similar to RL2 human 60S ribosomal protein L22 (H. sapiens) AA188378 1.06 0.42 0.40 Riboproteins
Heterogeneous nuclear ribonucleoprotein A1 AA126911 0.79 0.13 0.11 Heterogeneous nuclear ribonucleoprotein A2/B1 W02101 0.85 0.26 0.21 Heterogeneous nuclear ribonucleoprotein D-like AA598578 0.84 0.29 0.22 Heterogeneous nuclear ribonucleoprotein H1 (H) W96058 0.77 0.22 0.18 Heterogeneous nuclear ribonucleoprotein M AA504272 0.77 0.16 0.13 Heterogeneous nuclear ribonucleoprotein H2 (H⬘) AA679345 0.77 0.20 0.17
Continued on facing page
on November 8, 2019 by guest
http://jvi.asm.org/
TABLE 3—
Continued
Cluster Function and gene name Accessionno.
Change (fold) at h postinfection:
2 6 16
Heterogeneous nuclear ribonucleoprotein H3 (2H9) R02069 0.84 0.22 0.17 Heterogeneous nuclear ribonucleoprotein L AA398352 0.84 0.20 0.16 Transcription
Polymerase (RNA) II (DNA directed) polypeptide H A1554561 0.59 0.09 0.07
Nuclear transcription factor Y, beta AA130846 0.77 0.25 0.25
Polymerase (RNA) II AA458646 0.74 0.14 0.12
Translation
Eukaryotic translation elongation factor 1 delta (guanine nucleotide exchange protein) AA489523 1.04 0.22 0.26 Eukaryotic translation elongation factor 2 R43766 1.00 0.17 0.20 Eukaryotic translation initiation factor 2 subunit 3 (gamma, 52 kDa) AA448301 1.06 0.36 0.35 Eukaryotic translation initiation factor 3 subunit 4 (delta, 44 kDa) AA668703 1.08 0.14 0.14 Eukaryotic translation initiation factor 4E AA194246 0.93 0.29 0.28 Eukaryotic translation initiation factor 3 subunit 6 (48 kDa) AA669674 0.92 0.33 0.30 Splicing
Splicing factor arginine/serine-rich 1 (splicing factor 2 alternate splicing factor) T65786 0.74 0.17 0.21
Splicing factor arginine/serine-rich 11 H56944 0.73 0.21 0.27
Splicing factor arginine/serine-rich 5 AA598965 0.73 0.25 0.32 Splicing factor arginine/serine-rich 9 AA491213 0.74 0.21 0.25 Splicing factor proline/glutamine-rich AA425853 0.79 0.16 0.22 Capping
Capping protein (actin filament) muscle Z-line alpha 2 AA083228 1.16 0.36 0.27 Capping protein (actin filament) muscle Z-line beta W45165 1.51 0.10 0.04 7 Apoptosis
CGI-39 protein cell death-regulatory protein GRIM19 W32281 0.39 0.13 0.15 P75NTR-associated cell death executor ovarian granulosa cell protein (13 kDa) R63543 0.43 0.22 0.05 ATP synthase
ATP synthase H⫹transporting mitochondrial F
0complex subunit c (subunit 9) isoform 1 AA046701 0.43 0.12 0.05
ATP synthase H⫹transporting mitochondrial F
0complex subunit e AA431433 0.42 0.18 0.08
ATP synthase H⫹transporting mitochondrial F
0complex subunit f isoform 2 AA938704 0.51 0.14 0.14
ATP synthase H⫹transporting mitochondrial F
1complex beta polypeptide AA708298 0.31 0.05 0.08
ATP synthase H⫹transporting mitochondrial F
1complex delta subunit AA669314 0.28 0.33 0.04
ATP synthase H⫹transporting mitochondrial F
1complex O subunit AA873577 0.63 0.11 0.43
ATPase H⫹transporting lysosomal (vacuolar proton pump) 21 kDa AA457717 0.43 0.19 0.31
ATPase H⫹transporting lysosomal (vacuolar proton pump) 16 kDa AA486080 0.55 0.24 0.14
Cell cycle
Cell cycle progression 2 protein AA676387 0.56 0.22 0.13
CDC37 (cell division cycle 37S. cerevisiaehomolog) AA458870 0.60 0.54 0.17
Cell division cycle 27 T81764 0.82 0.19 0.45
Cytochrome
Cytochromeb-245 alpha polypeptide AA876021 0.22 0.22 0.14
Cytochromeb5 outer mitochondrial membrane precursor AA406485 0.59 0.07 0.18
Cytochromecoxidase subunit Vb AI688757 0.27 0.24 0.09
Cytochromecoxidase subunit VIIa polypeptide 1 (muscle) AA872125 0.46 0.08 0.28
Cytochrome coxidase subunit VIII AA862813 0.39 0.17 0.24
Cytoskeleton
Tubulin alpha 2 AA626698 0.69 0.15 0.16
Tubulin gamma 1 T77733 0.51 0.18 0.13
Tubulin gamma 2 AA126760 0.71 0.23 0.15
Actin-related protein 2/3 complex subunit 4 (20 kDa) AA865878 0.48 0.20 0.17
Cofilin 1 (non-muscle) AI203139 0.33 0.45 0.16
Collagen type IV alpha 5 (Alport syndrome) AA029997 0.59 0.15 0.18 Integrin alpha E (antigen CD103 human mucosal lymphocyt antigen 1 alpha polypeptide) AA425451 0.53 0.09 0.19
Integrin beta 4 binding protein AI017019 0.43 0.19 0.10
Keratin 16 (focal nonepidermolytic palmoplantar keratoderma) AA928454 0.30 0.49 0.18
Keratin 7 AA485959 0.44 0.08 0.06
Keratin 8 AA598517 0.19 0.18 0.04
Kinesin family member 5A AA984728 0.36 0.22 0.38
Kinesin-like 4 AA430503 0.60 0.12 0.16
Microtubule-associated protein RP/EB family member 2 AA608576 0.74 0.15 0.33 Microtubule-associated proteins 1A/1B light chain 3 AA460003 0.53 0.25 0.13
Myogenin (myogenic factor 4) AI291603 0.18 0.39 0.35
Myosin light polypeptide 4 alkali atrial embryonic AA705225 0.57 0.28 0.21 Myosin light polypeptide 6 alkali smooth muscle and nonmuscle AA488346 0.67 0.18 0.29
Myosin phosphatase target subunit 2 AA463926 0.59 0.19 0.10
Myosin regulatory light chain 2 smooth muscle isoform AA877166 0.38 0.17 0.18 Immunity
Interleukin-1 receptor antagonist T72877 0.15 0.21 0.18
CD151 antigen AA443118 0.58 0.69 0.30
CD84 antigen (leukocyte antigen) H65107 0.76 0.19 0.30
Delta sleep-inducing peptide immunoreactor AA775091 0.50 0.18 0.23
Continued on following page
on November 8, 2019 by guest
http://jvi.asm.org/
TABLE 3—
Continued
Cluster Function and gene name Accessionno.
Change (fold) at h postinfection:
2 6 16
Macrophage-stimulating 1 (hepatocyte growth factor-like) T47813 0.55 0.16 0.11 Major histocompatibility complex class 1 F AA455292 0.71 0.34 0.20 Secretory leukocyte protease inhibitor (antileukoproteinase) AA683520 0.35 0.34 0.10 Small inducible cytokine subfamily A (Cys-Cys) member 8 (monocyte chemotactic
protein 2) AI268937 0.40 0.37 0.32
Metabolism
Acetyl-coenzyme A acetyltransferase 2 (acetoacetyl coenzyme A thiolase) R46821 0.52 0.21 0.16
Adenine phosphoribosyltransferase AA598510 0.45 0.18 0.08
Adenylate kinase 1 W23690 0.58 0.20 0.19
Carbamoyl-phosphate synthetase 1 (mitochondrial) T61078 0.52 0.74 0.17
Carboxypeptidase A2 (pancreatic) AA844831 0.43 0.31 0.44
Creatinine kinase (brain) AA894557 0.50 0.24 0.37
Galactose-1-phosphate uridylyltransferase AA857212 0.65 0.56 0.27
Glucose phosphate isomerase AA401111 0.59 0.50 0.47
Glucose-regulated protein 58 kDa R33030 0.52 0.29 0.69
Glucose-6-phosphatase transport (glucose-6-phosphate) protein 1 AA490159 0.55 0.09 0.23 Glutathione peroxidase 4 (phospholipid hydroperoxidase) AA454856 0.39 0.30 0.06
GlutathioneS-transferase M3 (brain) R63065 0.42 0.15 0.19
GlutathioneS-transferase pi R33642 0.32 0.16 0.11
Glutathione synthetase AA463458 0.51 0.19 0.15
Guanine nucleotide binding protein (G protein) beta polypeptide 2 N68166 0.57 0.19 0.13
Guanylate kinase 1 AA490902 0.53 0.15 0.10
Hydroxyacyl-coenzyme A dehydrogenase/3-ketoacyl-coenzyme A AA916323 0.48 0.16 0.16
Insulin-induced gene 1 H59620 0.31 0.10 0.22
Isocitrate dehydrogenase 3 (NAD⫹) gamma AA459380 0.29 0.18 0.17
Isopentenyl-diphosphate delta isomerase H08820 0.49 0.40 0.17
Phosphofructokinase, liver W72140 0.43 0.11 0.16
Phosphogluconate dehydrogenase AA598759 0.43 0.19 0.09
Phosphoglycerate kinase 1 AA599187 0.45 0.18 0.15
Phosphoribosylglycinamide formyltransferase phosphoribosylglycinamide synthetase AA598487 0.44 0.07 0.13 Pyruvate dehydrogenase (lipoamide) beta AA521401 0.57 0.53 0.18
Transaldolase 1 AA955007 0.51 0.15 0.30
Aldehyde dehydrogenase 3 family member B1 N93686 0.61 0.59 0.25 Aldehyde dehydrogenase 7 family member A1 AA102646 0.66 0.09 0.47
Aldolase A fructose-bisphosphate AA775241 0.42 0.26 0.06
Aldolase C fructose-bisphosphate R39463 0.38 0.25 0.18
Alkaline phosphatase intestinal AA190871 0.62 0.13 0.24
Alkylation repairalkBhomolog AA609609 0.46 0.19 0.10
Aminoacylase 1 AA402915 0.59 0.08 0.26
Argininosuccinate synthetase AA676466 0.35 0.21 0.04
Succinate dehydrogenase complex subunit A flavoprotein (Fp) T70043 0.48 0.20 0.10 Succinate dehydrogenase complex subunit B iron sulfur (Ip) AA463510 0.45 0.28 0.18 NADH dehydrogenase (ubiquinone) 1 subcomplex unknown 1 (6 kDa KFYI) AA460251 0.63 0.14 0.10 NADH dehydrogenase (ubiquinone) 1 alpha subcomplex 1 (7.5 kDa MWFE) AA111999 0.57 0.29 0.10 NADH dehydrogenase (ubiquinone) 1 alpha subcomplex 2 (8 kDa B8) AA425211 0.54 0.17 0.16 NADH dehydrogenase (ubiquinone) 1 alpha subcomplex 7 (14.5 kDa B14.5a) AA022627 0.53 0.16 0.15 NADH dehydrogenase (ubiquinone) 1 alpha subcomplex 9 (39 kDa) AA598884 0.34 0.08 0.12 NADH dehydrogenase (ubiquinone) 1 beta subcomplex 5 (16 kDa SGDH) N93053 0.51 0.16 0.08 NADH dehydrogenase (ubiquinone) 1 beta subcomplex 7 (18 kDa B18) AA428058 0.43 0.07 0.19 NADH dehydrogenase (ubiquinone) Fe-S protein 4 (18 kDa) (NADH-coenzyme Q
reductase) AA055102 0.24 0.13 0.08
NADH dehydrogenase (ubiquinone) Fe-S protein 8 (23 kDa) (NADH-coenzyme Q
reductase) AA127014 0.34 0.10 0.15
B-cell CLL/lymphoma 7A AA281583 0.46 0.43 0.11
Proteosome
Proteasome (prosome macropain) 26S subunit ATPase 5 AI348774 0.51 0.20 0.08 Proteasome (prosome macropain) 26S subunit non-ATPase 2 AA454852 0.66 0.08 0.17 Proteasome (prosome macropain) 26S subunit non-ATPase 8 AA464557 0.41 0.09 0.07 Proteasome (prosome macropain) 26S subunit non-ATPase 9 AA403126 0.49 0.19 0.10 Proteasome (prosome macropain) activator subunit 2 (PA28 beta) H65395 0.61 0.19 0.22 Proteasome (prosome macropain) subunit alpha type 7 AA863149 0.54 0.20 0.19 Proteasome (prosome macropain) subunit beta type 10 T54166 0.50 0.16 0.19 Proteasome (prosome macropain) subunit beta type 3 AA620580 0.50 0.17 0.17 Ubiquinol-cytochromecreductase (6.4 kDa) subunit R46837 0.60 0.29 0.14 Ribosomal protein
Ribosomal protein L36 AI475653 0.65 0.07 0.29
Ribosomal protein S28 AA856556 0.43 0.20 0.09
Ribosomal protein S29 N93715 0.46 0.25 0.26
Ribosomal protein S5 AA456616 0.39 0.26 0.32
Ubiquitin-conjugating enzyme E2M (homologous to yeast UBC12) AA449119 0.62 0.19 0.36
Continued on facing page
on November 8, 2019 by guest
http://jvi.asm.org/
that showed a generalized induction pattern maintained from
2 to 16 h postinfection. The members of cluster 1 are detailed
in Table 1. Cluster 2 contained 24 transcripts (1.82%),
includ-ing genes whose induction was maintained from 2 to 6 h
postin-fection and returned to basal levels at 16 h postinpostin-fection;
cluster 2 members are represented in Table 2. Cluster 3
con-tained five transcripts (0.36%) with an upregulation pattern at
2 h postinfection that returned to basal levels at 6 h
postinfec-tion. Cluster 4 contained one transcript, gamma
interferon-inducible protein 16, which was slightly upregulated at 6 h
postinfection. Cluster 5 contained 71 transcripts (5.39%) that
were upregulated at 2 h postinfection and downregulated at 6
and 16 h postinfection. Cluster 6 was the largest group,
con-taining 828 transcripts (62.82%), which were completely
re-pressed at 6 and 16 h postinfection. This cluster included genes
involved in transcription, translation, subcellular trafficking,
apoptosis, metabolic pathways, and other vital cell processes.
Cluster 7 contained 352 transcripts (26.71%), with a pattern of
decreasing repression at 2, 6, and 16 h postinfection (Table 3).
Target verification by Northern blot analysis and real-time
RT-PCR of representative genes.
Selected genes with different
post-VV infection expression patterns, as derived from
mi-croarray results, were chosen for target verification by
North-ern blot analysis. Total RNA was purified from uninfected or
VV-infected cells at 2, 6, and 16 h postinfection, fractionated
by gel electrophoresis, blotted, and probed with
32P-labeled
[image:9.603.64.541.81.226.2]PCR products that were spotted on the microarray. The RNA
preparation used for this analysis was the same as that used in
the microarray. The amount of RNA spotted on the blot was
normalized based on rRNA content. In all cases, the Northern
blot confirmed the microarray results (Fig. 3). Whereas the
expression pattern of the elongation factor gene (EF) was still
detected at 2 h postinfection, strong inhibition was observed at
6 and 16 h postinfection compared to the control sample. A
peak of histone L gene H2AFL mRNA expression was reached
at 2 h postinfection; a similar expression pattern was shown by
the histone H2FB gene. A constitutive expression pattern of
the apurinic/apyridiminic endonuclease gene (APEXL2) and
the EST FLJ20643 was observed in the presence and absence
TABLE 3—
Continued
Cluster Function and gene name Accessionno.
Change (fold) at h postinfection:
2 6 16
Transcription
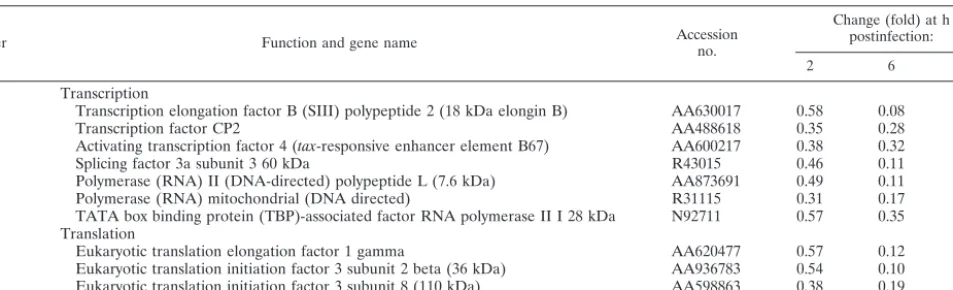
Transcription elongation factor B (SIII) polypeptide 2 (18 kDa elongin B) AA630017 0.58 0.08 0.14
Transcription factor CP2 AA488618 0.35 0.28 0.09
Activating transcription factor 4 (tax-responsive enhancer element B67) AA600217 0.38 0.32 0.24
Splicing factor 3a subunit 3 60 kDa R43015 0.46 0.11 0.18
Polymerase (RNA) II (DNA-directed) polypeptide L (7.6 kDa) AA873691 0.49 0.11 0.20 Polymerase (RNA) mitochondrial (DNA directed) R31115 0.31 0.17 0.13 TATA box binding protein (TBP)-associated factor RNA polymerase II I 28 kDa N92711 0.57 0.35 0.15 Translation
Eukaryotic translation elongation factor 1 gamma AA620477 0.57 0.12 0.06 Eukaryotic translation initiation factor 3 subunit 2 beta (36 kDa) AA936783 0.54 0.10 0.15 Eukaryotic translation initiation factor 3 subunit 8 (110 kDa) AA598863 0.38 0.19 0.14
FIG. 3. Validation of microarray data by Northern blot. Total RNA
(20
g) purified from uninfected and VV-infected cells at 2, 6, and 16 h
postinfection was hybridized with probes derived from PCR products
that were spotted on the microarray. The genes included in the
auto-radiogram are N34895 (EST), WASP (Wiskott-Aldrich syndrome
pro-tein), H2AFL (histone L), H2FB (histone B), EF (elongation factor),
APEXL2 (apurinic/apyridiminic endonuclease), FLJ20643 (EST), and
E3L (VV protein).
on November 8, 2019 by guest
http://jvi.asm.org/
of VV. EST N34895 expression was detected only following
infection. Strong upregulation of WASP expression was also
observed during VV infection. The expression of the VV E3L
early gene was analyzed as a control for virus infection.
As an alternative to the Northern blot data, real-time
RT-PCR was used to verify the transcriptional change in selected
genes, as detected by microarray. Three genes were chosen for
analysis: two were upregulated (PCNT2 and WASP) and one
was not altered (IL-6ST). HPRT was used as an internal
con-trol. As shown in Table 4, the RT-PCR data confirmed the
microarray results, showing the same relative regulation of
transcription of the selected genes and hence validating the
Northern and the microarray findings. The absolute values are
not identical between the microarray and RT-PCR data, but
this is probably due to the intrinsic differences between the
techniques.
Target verification by Western blot and
immunofluores-cence of representative cellular proteins.
To correlate changes
in transcription with protein levels, we studied the effect of
infection on some cytoskeletal components by analyzing actin
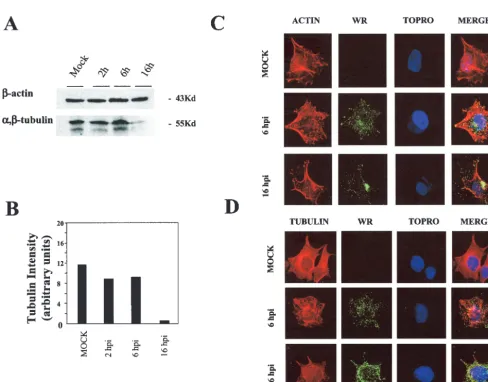
and tubulin expression levels by immunoblot. Although actin
gene expression was downregulated at 6 h postinfection in
microarray analysis (see Table 3), the protein was present in
equal amounts in mock- and VV-infected cells at 2, 6, and 16 h
postinfection (Fig. 4A). This is probably due to the high
[image:10.603.48.537.287.669.2]sta-FIG. 4. Changes in cytoskeletal components after VV infection. (A) Western blot comparison of actin and tubulin protein levels in lysates of
mock- and VV-infected cells. Total proteins (100
g) were separated by SDS-PAGE, transferred to nitrocellulose, and immunoblotted with
anti-

-actin and anti-

-tubulin antibodies. (B) Densitometric quantification of tubulin protein. (C) Immunofluorescence analysis of the effect of
VV infection on actin fibers in HeLa cells. Mock- and VV-infected cells at 6 and 16 h postinfection (hpi) were labeled with monoclonal antibody
C3
␣
14k to detect the A27L viral p14 protein, followed by the appropriate phalloidin-conjugated secondary antibody and ToPro reagent. The
samples were analyzed by confocal immunofluorescence microscopy. (D) Immunofluorescence analysis of the effect of VV infection on tubulin.
TABLE 4. Confirmation of microarray data by real-time RT-PCR
Gene product
Changea(fold)
Microarray RT-PCR
2 hpi 6 hpi 16 hpi 2 hpi 6 hpi 16 hpi
PCNT2
3.20
7.11
1.56
3.82
8.54
2.21
WASF1
2.35
2.43
3.81
2.05
3.30
4.27
IL-6ST
1.02
1.35
0.98
1.08
1.53
1.07
ahpi, hour postinfection.
on November 8, 2019 by guest
http://jvi.asm.org/
bility of actin. After virus infection, the microarray data
indi-cated that tubulin expression was downregulated (Table 3),
and this was confirmed by Western blot analysis of tubulin
protein levels (Fig. 4A). Tubulin degradation was quantified by
densitometry, which showed that tubulin expression decreased
10-fold at 16 h postinfection compared to mock-infected cells
(Fig. 4B). These data were confirmed by immunofluorescence
staining with fluorescein-labeled phalloidin and antitubulin
an-tibodies (Fig. 4C and D). These findings show that the
corre-lation between levels of mRNAs and protein depends on the
stability of a given protein.
Since N-WASP has been shown to play an important role in
the actin-mediated motility of VV as a mechanism to viral
spread between cells (12–13, 19, 34), we next focused our work
on the WASP protein family member WASF1, which was
up-regulated more than twofold in VV-infected cells compared to
uninfected control cells (Table 1). In agreement with the
Northern, microarray, and real-time RT-PCR data, a clear
increase in WASP protein levels was evident in VV-infected
cells by Western blot analysis (Fig. 5). The WASP protein
signal increased early in infection and reached a maximal level
at 16 h postinfection. At this time, the amount of WASP in
VV-infected cells was threefold higher than in control cells.
The increase in WASP protein required viral DNA replication,
as observed by infecting cells in the presence of adenosine
arabinosidede, an inhibitor of VV DNA synthesis. Moreover,
the increase in the WASP protein level required de novo
pro-tein synthesis, because its accumulation was prevented by
cy-cloheximide treatment. This result discards the possibility that
VV infection might be increasing the WASP protein level by
enhancing protein stability.
Given the known involvement of N-WASP in VV-mediated
cytoskeletal changes (19, 34), we next analyzed the subcellular
localization of WASP. To this end, we performed comparative
immunofluorescence analysis of intracellular WASP
distribu-tion between VV-infected cells at 6 and 16 h postinfecdistribu-tion and
uninfected cells. While in uninfected cells WASP appeared in
defined regions of the cytoplasm, with time of VV infection,
there was a clear increase in WASP protein intensity, with a
subcellular distribution distinct from that of uninfected cells
(Fig. 6). The subcellular distribution of WASP was compared
with that of the VV membrane protein p14 (A27L gene). At
late times postinfection, p14 localized as a soluble component
but mostly as part of intracellular mature virus, giving a
single-dot appearance. Image merging indicated some colocalization
of WASP with p14 (Fig. 6).
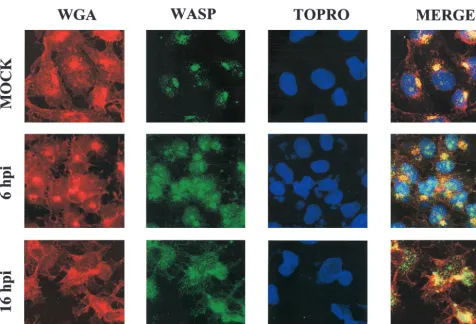
To analyze further the intracellular localization of WASP in
infected cells, we used antibodies to the wheat germ antigen, a
specific marker for Golgi structures. In uninfected cells, WASP
protein was present mainly in the Golgi region, whereas in
infected cells, WASP protein localized in cytoplasmic
struc-tures that lacked Golgi organization (Fig. 7). Since a significant
fraction of mature virions colocalized with WASP protein
(compare the dots in Fig. 6 and 7, merge panel), these
obser-vations suggest a possible functional and/or biochemical
inter-action between VV proteins and WASP.
DISCUSSION
With cDNA microarrays, we analyzed the expression of
ap-proximately 15,000 human cDNAs during VV infection of
HeLa cells and identified genes that are differentially
ex-pressed and belong to a variety of cellular pathways. This work
describes for the first time the global change in the cellular
mRNA content in response to a poxvirus infection. Our results
show that VV infection has a major impact on the expression
pattern of specific cellular genes. We performed our analysis at
2, 6, and 16 h postinfection and observed drastic changes in the
amount of mRNA in VV-infected compared to uninfected
cells. This led us to analyze the temporal behavior of host
genes over infection that could bring new clues on the role that
these genes play in the context of the VV-infected cell.
The majority (90%) of the differentially expressed genes
showed expression patterns characterized by diminished levels
compared to mock-infected controls. Expression of host genes
that govern vital cell processes such as replication,
transcrip-tion, and translation was downregulated during the course of
infection. The expression of other genes involved in apoptosis
or the proteasome-ubiquitin degradation pathway was also
re-pressed. These findings support the notion that cytocidal
vi-ruses often lead to profound changes in host gene expression
(6, 30). Notably, our results indicate that VV infection
upregu-lates expression of a discrete number of genes with known
functions and several ESTs with unknown functions, not
de-scribed previously as being upregulated by other viruses (9, 15,
29).
The global reduction in mRNA content observed in
VV-in-fected cells might be due to a general repression of host
tran-FIG. 5. Upregulation of WASP protein after VV infection. (A)
Comparison of WASP protein levels by Western blot from lysates of
mock- and VV-infected cells at 2, 6, and 16 h postinfection (hpi) and
from cells treated at infection with cycloheximide (CHX; 100
g/ml)
and adenosine arabinoside (ARAC; 50
g/ml) for 16 h. Total proteins
(100
g) were separated by SDS-PAGE, transferred to nitrocellulose,
and immunoblotted with anti-WASP and anti-

-actin antibodies.
(B) Densitometric quantification of WASP protein.
on November 8, 2019 by guest
http://jvi.asm.org/
[image:11.603.68.256.75.318.2]scription or increased degradation rates of cellular mRNAs. At
this time we cannot distinguish between these two possibilities.
However, since VV infection affects both the synthesis and the
stability of cellular mRNAs, the data obtained here probably
reflect the interference of VV with multiple steps in host gene
expression (5, 30, 33).
More interesting is the fact that VV infection increased the
level of some specific host mRNAs. This could be due to a
general response of the cell to stress situations or may be a
more specific response of the cell to poxvirus infection.
Nota-bly, some of these genes encode structural components of the
cell, such as Golgi resident protein 60 (GCP-60), claudin 3, and
pericentrin. Although the roles that these proteins play in the
cell are well established (1, 38–39) the biological meaning of
their upregulation by VV is not immediately clear. VV could
benefit from increased expression of host genes encoding
structural components of the cell, since production of progeny
virus requires the integrity of some cellular structures. For
instance, formation of extracellular envelope virus requires the
Golgi apparatus for intracellular mature virus acquisition of an
extra double membrane (17).
Another gene that underwent upregulation after VV
infec-tion was EST N34895, a homolog of coxsackievirus and
ade-novirus receptors. One can speculate that N34895 might be
involved in some step of VV entry, although further
experi-ments will be necessary to test this possibility.
Among the genes upregulated by VV infection, perhaps the
function of WASP has the most obvious biological meaning
in VV-infected cells. VV infection triggers transduction
pathways, and WASP is an effector molecule involved in
signal transmission from tyrosine kinase receptors and small
GTPases to the actin cytoskeleton (8, 26, 40–41). N-WASP, a
related member of the WASP family, is implicated in the
actin-mediated motility of VV as a mechanism to spread virus
between cells (12–13, 19, 34). The molecular mechanism of this
process involves the Src family kinase-dependent tyrosine
phosphorylation of tyrosine residues 112 and 132 of viral
trans-membrane protein A36R, the tail nucleator (19, 27, 37). These
posttranslational modifications regulate a direct recruitment of
Nck, Grb2, WAS-interacting protein, and N-WASP to the virus
particle and actin polymerization via the Arp2/3 complex (16,
23, 25).
We observed a clear upregulation of WASP expression
dur-ing VV infection, with a correlation between WASP mRNA
and protein levels. The increase in WASP protein required
viral DNA replication, shown by infecting cells in the presence
of adenosine arabinoside, an inhibitor of VV DNA synthesis.
Moreover, the increase in WASP protein level required de
novo protein synthesis because it was prevented by
cyclohexi-mide treatment. Although the biological relevance of this
up-regulation remains to be established, it can be speculated in
view of the functions assigned to N-WASP that WASP protein
FIG. 6. Immunofluorescence analysis showing WASP redistribution in VV-infected HeLa cells. Mock- and VV-infected cells at 6 and 16 h
postinfection (hpi) were double-labeled with monoclonal antibody C3
␣
14k to detect the A27L viral p14 protein and anti-WASP antibody, followed
by the appropriate fluorescent secondary antibody and ToPro reagent. Cells were visualized by confocal immunofluorescence microscopy.
on November 8, 2019 by guest
http://jvi.asm.org/
might be involved in some step of virus budding or maturation
by regulating the organization of actin-containing
cytoskele-ton, thus facilitating the spread of the virus. Our preliminary
observations in tissue-specific knockouts of WAS in mice
sug-gest a role for WAS family members in the release of VV from
infected cells (unpublished data).
In conclusion, this study is the first quantitative analysis of
host cell gene expression following VV infection in cultured
human cells. The results identify a number of cellular genes
whose expression levels are markedly modified by VV
infec-tion and suggest potential roles as regulators of viral infecinfec-tion.
We demonstrate the usefulness of microarray technology in
the study of poxvirus-host interactions. Additional studies with
a variety of virus strains, mutants, cell lines, and in vivo animal
model systems will be required to obtain a comprehensive
pattern of host cell gene expression and biological effects
fol-lowing poxvirus infection. The impact of VV on host gene
expression is important considering the potential application
of VV as a recombinant vaccine and the threat of bioterrorism
with variola virus and related poxviruses.
ACKNOWLEDGMENTS
We are indebted to to R. Conde for helpful quantitative PCR
as-sistance, to A. Bernad for kindly providing the WASP antibody, to
J. M. Ferna´ndez and J. C. Oliveros for bioinformatic assistance, to I.
Ventoso, S. Masciotra, and C. Mark for critical review of the
manu-script, and to V. Jime´nez for expert technical assistance.
This work was supported by the Spanish Ministry of Science and
Technology BIO2000-0340P4 and BIO2001-2269 (to M.E.). The
De-partment of Immunology and Oncology was founded and is supported
by the Spanish Council (CSIC) and Pharmacia.
REFERENCES
1. Adams, C., P. Diadori, L. Schoenroth, and M. Fritzler.2000. Autoantibodies in childhood post-varicella acute cerebellar ataxia. Can. J. Neurol. Sci.4:316– 320.
2. Bablanian, R., B. Baxt, J. A. Sonnabend, and M. Esteban.1978. Studies on the mechanism of vaccinia virus cytopathic effects. II. Early cell rounding is associated with virus polypeptide synthesis. J. Gen. Virol.39:403–413. 3. Bablanian, R., G. Coppola, S. Scribani, and M. Esteban.1981. Inhibition of
protein synthesis by vaccinia virus. IV. The role of low-molecular-weight viral RNA in the inhibition of protein synthesis. Virology112:13–24.
4. Bablanian, R., M. Esteban, B. Bax, and J. A. Sonnabend.1978. Studies on the mechanisms of vaccinia virus cytopathic effects. I. Inhibition of protein synthesis in infected cells is associated with virus-induced RNA synthesis. J. Gen. Virol.39:391–402.
5. Becker, Y., and W. K. Joklik.1964. Messenger RNA in cells infected with vaccinia virus. Proc. Natl. Acad. Sci. USA51:577–584.
6. Bolt, G., K. Berg, and M. Blixenkrone-Moller.2002. Measles virus-induced modulation of host-cell gene expression. J. Gen. Virol.83:1157–1165. 7. Buller, R. M. L., and G. J. Palumbo.1991. Poxvirus pathogenesis. Microbiol.
Rev.55:80–122.
8. Caron, E.2002. Regulation of Wiskott-Aldrich syndrome protein and related molecules. Curr. Opin. Cell Biol.14:82–87.
9. Chang, Y. E., and L. A. Laimins.2000. Microarray analysis identifies inter-feron-inducible genes and Stat-1 as major transcriptional target of human papillomavirus type 31. J. Virol.74:4174–4182.
[image:13.603.59.535.66.390.2]10. Cudmore, S., P. Cossart, G. Griffiths, and M. Way.1995. Actin-based mo-tility of vaccinia virus. Nature378:636–638.
FIG. 7. VV infection changes the subcellular localization of WASP from the Golgi complex. HeLa cells cultured on coverslips were infected
with VV for 6 and 16 h. Cells were treated with anti-WASP antibody, followed by an appropriate fluorescent secondary antibody, ToPro, and
fluorescent anti-wheat germ antigen (WGA).
on November 8, 2019 by guest
http://jvi.asm.org/
11. Esteban, M.1984. Defective vaccinia virus particles in interferon-treated infected cells. Virologyl33:220–227.
12. Frischknecht, F., S. Cudmore, V. Moreau, I. Reckmann, S. Rottger, and M. Way.2001. Tyrosine phosphorylation is required for actin based motility of vaccinia virus but not for Listeria or Shigella. Curr. Biol.9:89–92. 13. Frischknecht, F., V. Moreau, S. Rottger, I. Reckmann, C. Superti-Furga, and
M. Way.1999. Actin based motility of vaccinia virus mimics receptor tyrosine kinase signalling. Nature404:1007–1011.
14. García de la Nava, J., Franco D. Santaella, Cuenca J. Alba, J. M. Carazo, O. Trelles, and A. Pascual-Montano.2002. Engene: the processing and explor-atory analysis of gene expression. Bioinformatics19:657–658.
15. Geiss, G. K., R. E. Bumgarner, M. C. An, A. B. Agy, A. B. van’t Wout, E. Hammersmark, V. S. Carter, D. Upchurch, J. I. Mullins, and M. G. Katze.
2001. Large-scale monitoring of host gene expression during HIV-1 infection with cDNA microarrays. Virology266:8–16.
16. Higgs, H. N., and T. D. Pollard.2001. Regulation of actin filament network formation through ARP2/3 complex: activation by a diverse array of pro-teins. Annu. Rev. Biochem.70:649–676.
17. Hiller, G., and K. Weber.1982. Golgi-derived membranes that contain an acylated viral polypeptide are used for vaccinia virus envelopment. J. Virol.
55:651–659.
18. Hiller, G., K. Weber, L. Schneider, C. Parajsz, and C. Jungwirth.1979. Interaction of assembled progeny pox viruses with the cellular cytoskeleton. Virology98:142–153.
19. Hollinshead, M., G. Rodger, H. Van Eijl, M. Law, R. Hollinshead, D. J. Vaux, and G. L. Smith.2001. Vaccinia virus utilizes microtubules for move-ment to the cell surface. J. Cell Biol.154:389–402.
20. Johnson, G. P., S. J. Goebel, and E. Paoletti.1993. An update on the vaccinia virus genome. Virology196:196., 381–401.
21. Jones, J., and A. M. Arvin.2003. Microarray analysis of host cell gene transcription in response to varicella-zoster virus infection of human T cells and fibroblasts in vitro and SCIDhu skin xenografts in vivo. J. Virol.77:
1268–1280.
22. Kohonen, T.1997. Self-organizing maps, 2nd ed. Springer-Verlag, Berlin, Germany.
23. Martinez-Quiles, N., R. I. M. Rohatgi, M. Medina, S. P. Saville, H. Miki, H. Yamaguchi, T. Takenawa, J. H. Hartwig, R. S. Geha, and N. Ramesh.2001. WIP regulates N-WASP-mediated actin polymerization and filopodium for-mation. Nat. Cell Biol.3:484–491.
24. Massung, R. F., J. J. Esposito, L. Liu, J. Qi, T. R. Utterback, J. C. Knight, L. Aubin, L., T. E. Yuran, J. M. Parson, V. N. Loparev, et al.1993. Potential virulence determinants in terminal regions of variola smallpox virus genome. Nature224:1280–1284.
25. McKarty, J. H.1998. The Nck SH2/SH3 adaptador protein: a regulator of multiple intracellular signal transduction events. Bioassays20:913–921. 26. Miki, H., K. Minura, and T. Takenawa.1996. N-WASP, a novel
actin-depolymerizing protein, regulates the cortical cytoskeletal rearrangement in a PIP2-dependent manner downstream or tyrosine kinases. EMBO J.15:
5326–5335.
27. Moreau, V., F. Frischknecht, I. Reckmann, G. Superti-Furga, and M. Way.
2000. A complex of N-WASP and WIP integrates signalling cascades that lead to actin polymerization. Nat. Cell Biol.2:441–448.
28. Moss, B.2001.Poxviridae: the viruses and their replication, p. 2649–2885.In
B. N. Fields, D. M. Knipe, and P. M. Howley (ed.), Fields virology, 4th ed., vol. 2. Lippincott-Raven Press, New York, N.Y.
29. Nees, N., J. M. Geoghegan, T. Hyman, S. Frank, L. Miller, and C. I. Wood-worth.2001. Papillomavirus type 16 oncogenes downregulate expression interferon-responsive genes and upregulate proliferation-associated and NFB-responsive genes in cervical keratinocytes. J. Virol.75:4283–4296. 30. Pedley, S., and R. J. Cooper.1984. The inhibition of HeLa cell RNA
syn-thesis following infection with vaccinia virus. J. Gen. Virol.65:1687–1697. 31. Ploubidou, A., V. Moreau, K. Ashman, I. Reckmann, C. Gonza´lez, and M.
Way.2000. Vaccinia virus infection disrupts microtubule organization and centrosome function. EMBO J.19:3932–3944.
32. Portis, T., and R. Longnecker.2003. Epstein-Barr virus LMP2A interferes with global transcription factor regulation when expressed during B-lympho-cyte development. J. Virol.77:105–114.
33. Rice, A. P., and B. E. Roberts.1983. Vaccinia virus induces cellular mRNA degradation. J. Virol.47:529–539.
34. Rietdorf, J., A. Ploubidou, I. Reckmann, A. Holmstrom, F. Frischknecht, M. Zettl, T. Zimmermann, and M. Way.2001. Kinesin-dependent movement on microtubules precedes actin-based motility of vaccinia virus. Nat. Cell Biol.
3:992–1000.
35. Rottger, S., F. Frischknecht, I. Reckmann, G. L. Smith, and M. Way.1999. Interactions between vaccinia virus intracellular envelope virus membrane proteins and their roles in intracellular envelope virus assembly and actin tail formation. J. Virol.73:2863–2875.
36. Sanderson, C. M., M. Way, and G. L. Smith.1998. Virus-induced cell motility. J. Virol.72:1235–1243.
37. Scaplehorn, N., A. Holmstrom, V. Moreau, F. Frischknecht, I. Reckmann, and M. Way.2002. Grb2 and Nck act cooperatively to promote actin-based motility of vaccinia virus. Curr. Biol.12:740–745.
38. Sharon, H., A. Purohit, J. Doxey, and R. B. Vallee.2000. Light intermediate chain 1 defines a functional subfraction of cytoplasmic dynein which binds to pericentrin. J. Biol. Chem.42:32763–32768.
39. Sohda, M., Y. Misumi, A. Yamamoto, A. Yano, N. Nakamura, and Y. Ike-hara.2001. Identification and characterization of a novel Golgi protein, GC60, that interacts with the integral membrane protein giantin. J. Biol. Chem.48:45298–45306.
40. Symons, M., J. M. Derry, B. Karlak, S. Jiang, V. Lemahieu, F. McCormick, U. Francke, and A. Abo.1996. Wiskott-Aldrich syndrome protein, a novel effector for the GTPase Cdc42Hs, is implicated in actin polymerization. Cell
84:723–734.
41. Takenawa, T., and H. Miki.2001. WASP and WAVE family proteins: key molecules for rapid rearrangement of cortical actin filaments and cell move-ment. J. Cell Sci.114:1801–1809.
42. Tamayo, P., D. Slonim, J. Mesirov, Q. Zhu, E. Dmitrovsky, E. S. Lander, and T. R. Golub.1999. Interpreting patterns of gene expression with self-orga-nizing maps: methods and application to hematopoietic differentiation. Proc. Natl. Acad. Sci. USA96:2907–2912.
43. Van’t Wout, A. B., G. K. Lehrman, S. A. Mikheeva, G. O’Keeffe, M. G. Katze, R. E. Bumgarner, G. K. Geiss, and J. I. Mullins.2003. Cellular gene expres-sion upon human immunodeficiency virus type 1 infection of CD4⫹T-cell lines. J. Virol.77:1392–1402.
44. Vos, J. C., and H. G. Stunnenberg.1988. Derepression of a novel class of vaccinia virus genes upon DNA replication. EMBO J.7:3487–3492. 45. Zhu, H., J. P. Cong, G. Mantora, T. Gineras, and T. Shenk.1998. Cellular
gene expression altered by human cytomegalovirus: global monitoring with oligonucleotide arrays. Proc. Natl. Acad. Sci. USA95:14470–14475.
on November 8, 2019 by guest
http://jvi.asm.org/