University of Southern Queensland Faculty of Engineering and Surveying
The NOW Map: Consistent, Dynamic and
Contemporary Geospatial Information
A dissertation submitted by Mr Anthony John Baker
AssocDip(Cart) TAFENSW, BAppSc(EnvTech) CSturt
In fulfilment of the requirements of Master of GEOMATICS
Some see things that are and ask “why?”;
Others dream things that never were and ask “why not?”
Candidates Certification
I certify that the ideas, designs and experimental work, results, analysis, software and conclusions set out in this dissertation are entirely my own efforts, except where otherwise indicated and acknowledged.
I further certify that the work is original and has not been previously submitted for assessment in any other course or institution, except where specifically stated.
Anthony John Baker
Student Number: 0031111263
____________________ ________________ Signature of Candidate Date
Endorsement
Supervisor: Associate Professor Frank Young
Abstract
Mapping agencies, national and regional, are finding it increasingly difficult to maintain the currency of their suite of map related products and services. These products include topographic maps and the provision of up to date topographic data. The maintenance of this socially important spatial information is at issue through the duplication of effort that presently exists within government agencies at all levels. A dedicated data sharing and topographic maintenance program has the potential to solve all of these issues.
The “NOW Map” gives the “map hungry” public the ability to obtain spatially located data and products in time frames and formats of their choosing. This system is capable of delivering consistent, dynamic and contemporary geospatial information. It will be flexible, in response to a modern ever-changing society, and capable of providing up to date topographic maps and data that not only meets current standards, but also continually exceeds them.
After the development of initial procedures, a pilot study was conducted to expand and further refine data collection and analysis procedures. This was followed by a final data-gathering research phase. The research used relevant local, interstate and international examples in all areas of the study.
Acknowledgements
This research was carried out under the principal supervision of Associate Professor Frank Young.
Appreciation is also due to those who have assisted firstly with the supply of spatial data and / or industry information.
o Peri Cooper, Gunnedah Council; Francis Dorman, NSW
Fisheries; Ron Maher, Forests NSW; Campbell Peterson, Kempsey Council; Ron Graham, Coffs Harbour Council; Terry Slattery, DNR Qld; Owen Moss and Martin Rutherford, Defence Imagery and Geospatial Organisation; Rick McRae, ACT Emergency Services Bureau; and Alan Swift, Geoscience Australia.
Secondly, to the NSW Department of Lands for allowing the occasional use of geospatial data sets, facilities and infrastructure, as well as those from NSW Lands who provided technical assistance and the occasional words of encouragement:
o David Abernethy, Mick Dare, Peter Drinkall, Stuart Ellis,
Brenda Fahey, Paul Field, Hugh Gould, Doug Herrick, Jeff Larsen, Joanna MacLachlan, Ralph Mallard, Col Mitford, Brian Rattray, Alan Small, David Taylor and Graeme Thompson.
It would be amiss not to thank those friends and work colleagues who also contributed with proof reading.
Table of Contents
Chapter / Section Page
CANDIDATES CERTIFICATION ………. i
ABSTRACT ………. ii
ACKNOWLEDGEMENTS ……….. iii
LIST OF FIGURES ……… vi
LIST OF TABLES ……….. ix
LIST OF APPENDICES ……….. xi
NOMENCLATURE, ACRONYMS AND ABBREVIATIONS ……….. xii
GLOSSARY ………. xv CHAPTER 1 – INTRODUCTION
1.1 Outline of the Study ………. 1.2 Background ………. 1.3 The Problem ………. 1.4 Research Objectives ………. 1.5 Conclusions: Chapter 1 ………..
1 3 5 7 8 CHAPTER 2 – LITERATURE REVIEW
2.1 Introduction: What is a map ………. 2.2 Maps, Maintenance and Production ………. 2.3 Map Related Data: Uses and Benefits ……….………. 2.4 Maintaining Spatial Relationships ……….……
Chapter / Section Page
2.5 Production System Shortcomings …….……… 2.6 Summary: Chapter 2 ………..
68 81 CHAPTER 3 – RESEARCH DESIGN AND METHODOLOGY
3.1 Design Outcomes .………. 3.2 Pilot Study – NSW Government Gazette……..….…. 3.3 Major Study Data Collection ………. 3.4 Summary: Chapter 3 ………..
85 86 87 101 121 CHAPTER 4 –RESULTS AND DATA ANALYSIS
4.1 NSW Government Gazette …….………. 4.2 Data Sharing Results………. 4.3 Data Accuracy………. 4.4 Data Summary……… 4.5 Summary: Chapter 4 ………..
123 138 152 159 162 CHAPTER 5 – DISCUSSIONS, CONCLUSIONS, AND
IMPLICATIONS
5.1 Introduction ………. 5.2 Discussion ………. 5.3 Summary: Chapter 5 ……….. 5.4 Future Research Opportunities ………
LIST OF FIGURES
Number Title Page
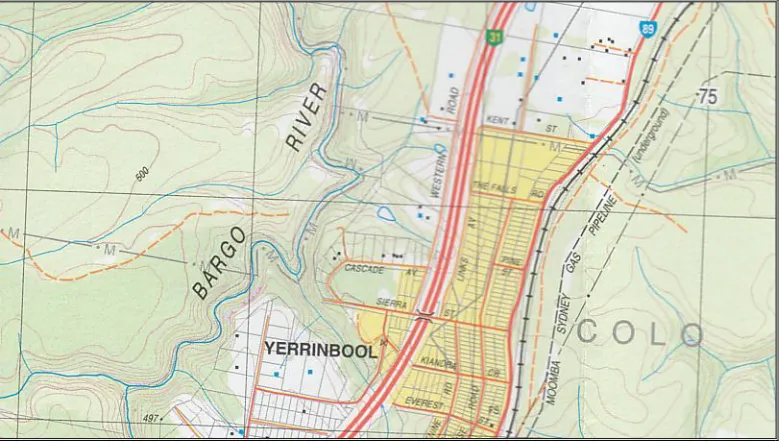
2.1 Bargo 1:25000 Topographic Map 13
2.2 Scribe sheets and masks for map related
feature themes 15
2.3 Photo Flight Path 17
2.4 Photo Coverage Without Navigation Support 18
2.5 Topographic Update Process 20
2.6 Bathurst 1:25000 Topographic Map 21
2.7 Hyperspectral Data Collection 28
2.8 GPS Controlled Photography 32
2.9 North Haven Comparison 1979 and 1997 36 2.10 Age of Current Topographic Map Stock 72 3.1 Breakdown of Organisations by Tier 90 3.2 Number of Amendments by Government Tier 90
3.3 Entries and Amendments by Date 92
3.4 Entries / Amendments by Organisation (Local
Government) 93
3.5 Entries / Amendments by Organisation (State
Government) 94
3.6 Referencing of Amendments 96
3.7 Amendment Actions 99
3.8 Geographic Names Notification 102
Number Title Page
3.10 Road Names Notification 105
3.11 Aquaculture Lease Notification (Grant) 107 3.12 Aquaculture Lease Notification (Renewal) 107
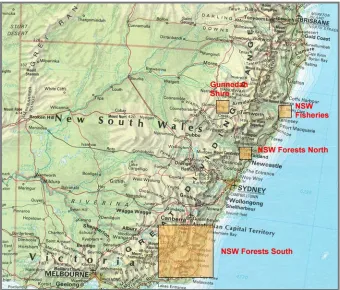
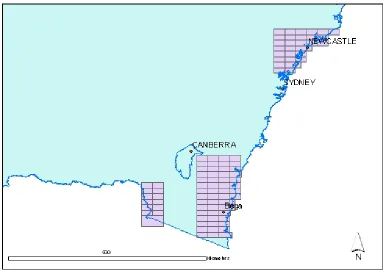
3.13 Data Sharing Locations 109
3.14 Gunnedah Region 110
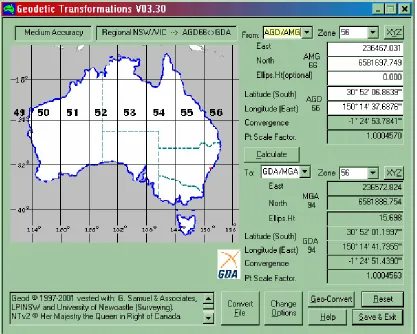
3.15 Geod Geodetic Transformations Program 111 3.16 TFW File Editing (before and after) 112
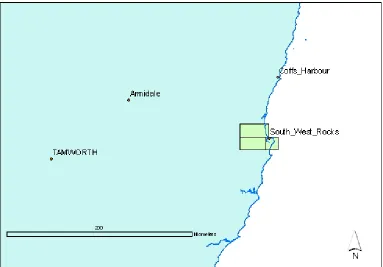
3.17 Macleay River Study Area 117
3.18 Forests NSW Study Area Locations 119
4.1 Aquaculture Lease Transactions 126
4.2 Map Sheet Locations - Aquaculture Leases 128
4.3 Geographic Names 131
4.4 Unspecified Amendments 132
4.5 Total Geographic Names 133
4.6 Road Name Transaction Summary 136
4.7 Aquaculture Lease Breakdown 139
4.8 Data Distribution within the Eastern Portion
of Gunnedah Shire 141
4.9 Map Sheet Comparisons 142
4.10 Net Change by Map Sheet 144
4.11 Forests NSW Study Area Location - South 145 4.12 Forests NSW Study Area Location - North 146
Number Title Page
4.14 Data Used 147
4.15 Net Gain 148
4.16 Net Gain Summary 149
4.17 NSW Forests Point Data Locations 150
4.18 Lease Overlaps 153
4.19 Gunnedah Road Names - Kelvin 155
4.20 Gunnedah Road Names - Gulligal 155
4.21 Road Name Continuity – 87241n 156
4.22 Road Name Continuity - 87242s 157
4.23 Total Study – Map Maintenance 161
5.1 Map Production Relationships 166
5.2 Topographic Data Integration Framework 183 5.3 Topographic Data Integration Framework –
LIST OF TABLES
Number Title Page
2.1 Classification of Spatial Resolutions 24
2.2 Radar Capable Satellites 24
2.3 Selected Radiometric Instruments in Orbit 25 2.4 Launch schedule for high-resolution remote
sensing satellites suitable for topographic mapping
27
2.5 A broad overview of the responsibilities of the
various levels of government in Australia 48 2.6 Potential Data Sources within NSW 49 2.7 Level of Government Representation 50 2.8 NSW Map Production Statistics 1949 to
October 2002 - Edition / Scale Combinations 69 2.9 NSW Map Production Statistics 1949 to
October 2002 - Edition / Scale Combinations 70 2.10 NSW Map Production Statistics 1949 to
October 2002 - Edition / Scale Combinations 71 3.1 Comparison of Tiers of Government 89
3.2 Gazette Amendments by Date 91
3.3 Spatial Referencing 96
3.4 Gazette Actions 98
4.1 NSW Fisheries Aquaculture Lease Transaction
Summary 125
4.2 Topographic Map Sheet Identification 127
Number Title Page
4.4 Further Investigation Required 129
4.5 Scale Summary 130
4.6 Unspecified Amendments 132
4.7 Road Names Result Summary 135
4.8 Map Sheet Modifications (Road Names) 137 4.9 NSW Fisheries Data Result Summary 138
4.10 Unique Records 139
4.11 Gunnedah Shire Council Data Result
Summary 140
4.12 Net Change by Map Name 143
4.13 Point Feature Summary 151
4.14 Homestead Name Variations 154
4.15 Map Maintenance Summary 159
4.16 Map Sheet Listing – Gazette and Data
LIST OF APPENDICES
Number Title Page
A Glossary 215
B NSW Government Ministerial Portfolios 221 C NSW Topographic Map Production Statistics:
1949 to October 2002 223
D Gazette Amendments by Organisation 225
E Geographical Names Summary 229
F Road Name Summary 231
G Aquaculture Lease Summary 233
H Data Sharing Example 1: NSW Fisheries -
Macleay Estuary Oyster Leases 239 I Data Sharing Example 2: Gunnedah Shire
Council - Property Access Information 245 J NSW Forests Data Result Summary 255 K Data Sharing Example 3: NSW Forests –
NOMENCLATURE, ACRONYMS AND ABBREVIATIONS
The following acronyms and abbreviations have been used throughout the text and references:-
Acronym Proper Name
AGD Australian Geodetic Datum (is shown as AGD66 to represent the 1966 definition of the datum)
AIRSAR Airborne Synthetic Aperture Radar ALS Airborne Laser Scanning
ANZLIC Australia New Zealand Land Information Council ASDD Australian Spatial Data Directory
ASDI Australian Spatial Data Infrastructure
AURISA Australasian Urban and Regional Information Systems Association
AUSLIG Australian Land Information Group
AVHRR Advanced Very High Resolution Radiometer
AVIRIS Airborne Visible / Infrared Imaging Spectrometer CASI Compact Airborne Spectrographic Imager
CERCO Comite Europeen des Responsables de la Cartographie Officelle
CTP Computer To Plate
DAIS Digital Airborne Imaging Spectrometer DCDB Digital Cadastral Data Base
DEM Digital Elevation Model
DTDB Digital Topographic Data Base DTM Digital Terrain Model
ENC Electronic Navigation Chart
Acronym Proper Name
FME Feature Manipulation Engine
GDA Geocentric Datum Australia (is shown as GDA2000 to represent the 2000 definition of the datum) GIM Geomatics International Magazine
GIS Geographical Information System
GITA Geospatial Information and Technology Association GNB NSW Geographical Names Board
GNR Geographical Names Register
GPS Global Positioning System HRSC-A High Resolution Stereo Camera – Airborne ICA International Cartographic Association
ICSM Intergovernmental Committee on Surveying and Mapping
IMTA International Map Traders Association ISO International Standards Organisation
ISPRS International Society for Photogrammetry and Remote Sensing
JERS Japanese Earth Resource Satellite
LGA Local Government Authority
LIDAR Light Detection and Ranging LINZ Land Information New Zealand LIST Land Information System Tasmania
LPI (NSW) Land and Property Information (New South Wales) MEGRIN Commercial Arm of CERCO
MGA Map Grid of Australia (is shown as MGA56 to represent the grid in zone 56)
NASA National Aeronautical and Space Administration NGDI National Geospatial Data Infrastructure
Acronym Proper Name
PCGIAP Permanent Committee for GIS Infrastructure for Asia and the Pacific
PDF Portable Document Format
PE&RS Photogrammetric Engineering and Remote Sensing RTA NSW Roads and Traffic Authority
SABE Seamless Administrative Boundaries of Europe
SAR Synthetic Aperture Radar
SES NSW State Emergency Service
SPOT Systeme Probatoire d' Observation de la Terre (Satellite System operated by French National Space Agency)
SQL Structured Query Language
SRTM Shuttle Radar Topography Mission TFW Tiff World File
TIFF Tag Image File Format
UAV Un-manned Airborne Vehicle
URISA Urban and Regional Information Systems Association
USGS United States Geological Survey
GLOSSARY
The value and social utility of geographic information comes from its use. Sharing of geographic information is important because the more it is shared, the more it is used, and the greater becomes society’s ability to evaluate and address the wide range of pressing problems to which such information may be applied. Failure to share geographic information is also economically inefficient and wasteful. The expertise and time it takes to collect and maintain information about the land creates a need to share that information
CHAPTER 1 - INTRODUCTION
There are few results of man’s activities that so closely parallel man’s interests and intellectual capabilities as the map
(Arthur H. Robinson 1965 in Clancy 1995, p.vi)
1.1 - Outline of the study
With the introduction of Geographic Information Systems (GIS) in the 1970’s also came an explosion of spatial information that has steadily progressed over the past 30 years. This has enabled not only the mapmakers but also the map users to progressively alter the focus of map making, thus providing products with the needs of the individual client in mind. This focus however needs to continue to respond to an ever-changing world, where users are requesting accurate up to date information on a daily basis. These requests can only be accommodated with the development of a coordinated change detection system that is suitable for output on demand topographic mapping. This system will ultimately improve spatial position, aspatial attribution and temporal accuracy, using cost effective methodology that makes it possible and sustainable for the broad cross-section of users.
area of interest. The map sales staff would in turn be able to output the customer’s map on a medium of their choosing, showing what the situation is “now”, that is, what the real world looks like as of today. Due to the temporal nature of this data, it would be possible to supply the customer with previous time variant data as well; but the ultimate is to provide today’s information today.
The purpose of this study was to substantiate the hypothesis that:
“Topographic maps can be maintained more efficiently by utilising accurate up to date information provided incrementally by organisations that maintain data as part of their own core business.”
1.2 - Background
The Land and Property Information (LPI) Division of the New South Wales (NSW) Department of Lands, the mapping arm of the NSW Government, is responsible for the production and maintenance of both cadastral and topographic maps within NSW. This responsibility includes both the traditional hardcopy map form as well as the digital spatial databases that exist as part of the NSW Government’s Geospatial Information System (GIS).
LPI undertook a major data collection project in 1988 with the aim of transferring the NSW cadastral fabric from hardcopy to electronic form. This task was undertaken by approximately 50 staff and was completed in 1994 with the transfer of about four million cadastral parcels. Currently the maintenance (update) of the cadastral fabric is jointly administered by both the Bathurst and Sydney offices of the LPI. The Bathurst office is responsible for mapping with the Sydney office controlling title information and plan registration.
Topographic maps (1114) cover NSW at a range of scales from 1:25000 to 1:100000. The state is divided into three divisions with each of these generally equating to the three different scales used. Initially (pre 1991) each scale area was treated with a separate photographic based revision timetable, due to each division experiencing geographic developments at different rates.
o Eastern division - 1:25000 – revised every 3 to 5 years, o Central division - 1:50000 – revised every 5 to 10 years, and o Western division - 1:100000 – revised every 10 to 15 years.
Topographic map production ceased temporarily in 1990 with staff being re-deployed for cadastral data collection. With the collection of cadastral data finalised, the staff commenced data collection for the topographic fabric and, after the production of several trial products in 1996, hardcopy map revision and production recommenced in 1998. This traditional mapping process and re-allocation of resources has resulted in information becoming “out of date”, increasing the information currency concern defined by users (refer sections 1.3 and 2.5).
1.3 - The Problem
Maps become out of date due to the natural and built environments changing faster than maps are being revised. Whilst there is a steady demand for up to date natural resource information by government and the private sector (refer chapter 2), there are not enough (coordinated) resources available to enable the mapmakers to keep abreast of the changes. This point is further highlighted with McRae and Walker (2000, p. 22) stating that whilst topographic maps were “an invaluable planning and operational support tool” they had some serious shortcomings relating to currency and relevance. These shortcomings include the temporal accuracy of the information and the level of usability that the user wanted.
LPI’s current production process in the eastern and central divisions uses a ‘heads up’ digitising approach with ortho-rectified imagery rather than the traditional photogrammetric model approach used in the original production process. The organisation has taken the opportunity to enhance the previous map product through the addition of an orthorectified image to the reverse side of the map sheet. These images are, however, only likely to be produced with each full-scale map revision. This means that while the map side is capable of being updated and spatially upgraded without the acquisition of additional imagery, the image side cannot.
Therefore, to maintain data currency, a method of data acquisition is required that is not image based.
Users not only request up to date data but also the ability to have this data integrated and displayed in traditional map format. For example, the user:
o Identifies an update,
o Comes to the map sales office with their ‘mistake’, and a
request for a change in the map detail,
o Requests a new ‘corrected’ map or plot, and
o Will question why it can’t be done while they wait.
The National Geographic Society (2001a) offers output on demand services in the United States on their web site. They also openly advertise that ‘patches’ are available in electronic form for the previous edition’s atlas that may have become ‘out of date’. Users merely download the file and output these on a colour printer of their choice at the scale appropriate for the patch. To accommodate this style of request, a new output procedure would be required, which would not only be transferable, but would also be capable of accommodating the various systems used in map production within LPI (NSW). All new update mechanisms would also need to take these functions into account.
1.4 - Research Objectives
The aim of the research project was to:
o Identify up to date topographic map production problems and
trends,
o Formulate hypothesis based on identification outcomes,
o Develop appropriate methodology and recording mechanisms
applicable to changes in geospatial data,
o Test the hypothesis, and
o Provide a mapping process and implications applicable to
industry and scientific community needs.
The research was conducted in six stages specifically designed to realise these aims.
Stage One. Identify the problem and its extent. Stage Two. Review existing industry literature.
Stage Three. Conduct a pilot study and establish appropriate research methodology. This stage included associated investigations to establish:
o Which data is topographically significant; which organisations
/ groups hold such data, and who should be responsible for maintaining it?
o Appropriate methodology to facilitate timely incremental
updating for all data regardless of type, theme or production scale.
Stage Four. Undertake a full data gathering process. This included the collection of sufficient evidence to substantiate the proposition.
Stage Six. Develop conclusions and recommendations including the presentation of a working model that can be incorporated into existing production environments.
1.5 - Conclusions: Chapter 1
The current topographic mapping procedures do not address clients needs or expectations with respect to data currency or content. This situation can be improved by avoiding duplication of effort within the revision and updating processes. The flow on effect will be a more efficient use of time and money that will, in turn, produce savings in turnaround time and increases in production. The end result will be a process capable of producing a quality product that exceeds client expectation. These expectations include the maintenance of currency, which contains data relevant to their needs, and through the adoption of an accurate spatial position.
CHAPTER 2 - LITERATURE REVIEW
Every novel idea in science passes through three stages. First people say it isn’t true. Then they say it’s true but not important. And finally, they say it’s true and important, but not new.
(Anonymous in Harold 1986, p. 57)
The production of up to date topographic maps relies on the ability to record, within the accuracies of the map, the position of all significant features and, where appropriate, associated attribution. Leading producers of topographic maps store these details in large databases that must be capable of accommodating many millions of records. Continual maintenance of these data is required to maintain database currency.
Hence, this chapter will review existing literature to establish:
o The need for a coordinated approach to data collection,
maintenance and revision for the purpose of maintaining digital topographic data, and
o The need for a systematic approach to updating and output
to ensure accurate display of spatial information.
This chapter will also outline previously used, present and emerging spatial related technology and methodology. Each point is discussed using relevant industry references and case studies, and provides an accurate representation of the current industry situation.
2.1 - What is a Map?
The hypothesis (refer section 1.1) is dependent on the definition, structure and content of a map, in addition to the processes to maintain its relevance. Several definitions exist for the question of “what is a map?”, one of which is:
A graphic depiction of all or part of a geographic realm in which the real world features have been replaced by symbols in their correct spatial location at a reduced scale.
(What is a map? 1999)
Different varieties of maps have been produced, each with a specific use and purpose in mind (refer section 2.3). These may all be categorised as being either:
o A topographic map, or o A thematic map.
A topographic map is defined as “a map whose principal purpose is to portray and identify features of the earth’s surface as faithfully as possible within the limitations imposed by scale” (Multilingual Dictionary of Cartography, 1973 in Bohme 1988, p. 1). Priority is given to those features that are topographically significant. A feature is topographically significant if, at a particular display scale, it is unique by location, attribution and association (author’s observations).
Both of these definitions include scale, which is a major criteria that separate maps from sketches and diagrams. Others include generalisation, symbolisation, and the use of a mathematical projection (Meine 1984, p. 17). The generalisation and use of symbology can be seen (refer figure 2.1) with the map containing symbols to represent the features on the earth’s surface. Text or annotation can also be seen for the town, pipeline and river name.
[image:33.595.125.515.465.688.2]The basic construction of topographic maps has evolved over the years with a gradual transformation from the sketches and diagrams of the past to the scale drawings of today. Improvements over this time have seen the inclusion of various elements that may now be found on maps and charts. These include, title, orientation (north point), date, author, legend, scale, index, grid, and source. Even though each of these aids the overall usability of the final product, the essential items are generally scale, grid and orientation.
2.2 – Maps, Maintenance and Production
This section outlines the history of topographic map production as well as summarising presently used techniques. Specific reference is made to the methods used in recording the position and attribution of map related information and in providing data currency through continual revision and database maintenance. The continual production of topographic maps demonstrates the on-going usefulness that the products provide to society.
2.2.1 - History of Topographic Map Production
of techniques. These included surveyors traversing with theodolite and chain, and through the use of plane tables. Prior to the introduction of modern computers, the map production process can be summarised as described in the following paragraphs.
Map related features can be classified into the general themes of hydrography, land cover, cultural, and transport. Aerial imagery was used to collect these features photogrammetrically from stereoscopic pairs of aerial photographs. The information collected was then checked by surveyors / field staff, with particular attention paid to verifying the features spatial position, attribution and authenticity. The accuracy of all nomenclature and map annotation was also confirmed, in addition to the use of particular geographic names, often through liaison with major landholders (Paxton 1999). Associated scribe sheets, names overlays, and peel coat masks (refer figure 2.2) were created or updated from the particular photogrammetric line data.
The various map themes were developed into printing plates in preparation for printing, after a thorough check for completeness and quality.
The areas of data collection, data manipulation, and output are explained in more detail in the following sections.
2.2.1.1 - Data Collection
The image based data collection phase included several individual stages.
o Image Generation,
o Photogrammetric Collection, and o Field Verification.
Despite two alternative platforms being available for imagery from the late 1970’s, only the airborne platform offered imagery in the scale ranges suitable for large to medium scale topographic mapping. Imagery obtained from satellites offered users additional capability in the areas of vegetation and land cover analysis (Campbell 1987, p. 366).
Individual processes conducted whilst undertaking aerial photography include:
o Coverage Determination and Flight Planning, o Establishing photogrammetric control, and o Flying the mission.
used to orientate the photography to the ground, was placed on the ground. Each photographic run is flown in turn with the photographs taken to maximise the coverage for the photographs flown.
Without navigational support, there is the possibility of gaps and unnecessary overlaps occurring between the runs of photography (refer figure 2.4). The result adds to the acquisition time and money, as additional photographs are required to either fill the holes or repeat a complete run.
The photogrammetric collection consists of two phases. The first being aerial triangulation, and the second, line map collection. The triangulation phase sees the control points for each photograph transferred from each stereographic model to the next as each additional photograph is viewed in turn. This process assists with the absolute orientation phase and through the removal of parallax for accurate 3D positional mapping of photographic detail.
Figure 2.4: Photo Coverage Without Navigation Support (Leica, 1994)
photogrammetric instruments. These features included for example roads, rivers, cliffs, contours, and buildings. The photogrammetrist also noted when features needed to be checked in the field. These may have been obscured from view due to cloud or shadow, and included those that were significant but were too small to be adequately identified with existing instruments.
During the field verification stage, surveyors and field staff checked and verified the spatial position of the features already collected while gathering a variety of additional associated attribute information. They also liaised with local landholders to confirm the present-day and historical use of any geographic names and features.
2.2.1.2 - Data Manipulation
The data manipulation phase consisted of the three stages: data transfer, annotation, and generalisation. During the transfer stage, the photogrammetric information was transferred from the photogrammetric line sheets to the associated scribe sheets and peel coat masks (refer Christer 1984). For the first edition maps, this was a photographic process with each subsequent edition having the change only or revision information transferred manually.
This is demonstrated in figure 2.5 where the information from the previous edition (left) is updated using a recently flown aerial photograph (center). These changes, once detected, are used to modify the original information, which is used to produce the updated edition of the topographic map (right).
choice of “letraset” or rub down lettering, and “photon” where greater variety was available with respect to fonts and styles. Where there were issues regarding a clash in either annotation or symbology, modifications were made to the mask or sheet concerned with the information being generalised during this stage.
Figure 2.5: Topographic Update Process (Meine 1984, p. 23)
Due to the labour intensive nature of the manual data manipulation process, change detection and revision was a time consuming process as well, and did not adequately enable modern change on demand concepts to occur.
2.2.1.3 - Output
The scribe sheets, peel coat masks and text overlays were used to create photographic negatives for each printing plate. This means that if a four-colour process was being used, then four negatives would be created. These negatives were used to create a photographic proof on film, which resembled the printed map. These were used in the quality assurance process to check the relationship between the scribe sheets, masks and names overlays. Corrections were made where mismatches were found.
The final negatives were then used to create printing plates, which are in turn used to print the new map sheet. The four-colour printing process uses cyan, magenta, yellow and black coloured inks to produce the printed product (refer figure 2.6).
Other colours are created by printing the process inks in specific ratios through the use of photographic screens. Until the introduction of four-colour printing, registration problems existed through the printing of colours with individual inks.
Woodward (1975) provides details of the history of map printing and highlights the evolution of this resource intensive approach which had until recently remained largely unchanged.
2.2.2 - Modern Production Techniques
Analysing modern mapping production techniques is best done within the topics of, data collection, data manipulation, and output. While advances have been made on immediate past methods (refer section 2.2.1) they remain extremely resource intensive with respect to time and money.
2.2.2.1 - Data Collection
Collection is cheaper when costs and effort are shared
(Bashfield 1997).
a. Acquisition
The various platforms used for the acquisition of spatial data can be categorised as either:
o Extra terrestrial / Satellite, o Airborne, or
o Terrestrial.
Each of these utilise updated techniques of previous methodology and are discussed in the following sections.
(i) Extra Terrestrial / Satellite Systems
Since Landsat 1 was launched in 1972 there have been over 130 satellites (Satellite Missions: Remote Sensing Satellites 2003) placed in orbit specifically for the purpose of earth observation. These satellites contain instruments designed to collect earth resource information using both active and passive means and provide users with the ability to choose the information most appropriate for the task selected. Imagery from weather satellites presently maintained by National Oceanographic and Atmospheric Administration (NOAA), has been downloaded and with “several minutes” post processing, provides near real time imagery (Jelenak, Shaw & Steyn-Ross 1998).
Table 2.1: Classification of Spatial Resolutions (Fritz 1998, p. 2)
Spatial Resolutions Pixel Size (m)
Very High < 0.5
High 0.5 - 3
Medium 3 - 30
Low 30 - 300
Very Low 300 <
SIR-C radar data from the Shuttle Radar Topography Mission (SRTM) has supplemented that available from radar capable satellites (refer table 2.2) (Salge 2000). It can be seen that except for the Almaz satellite (which ceased service in 1992), the standard resolution is around 25 to 30 metres. It can also be seen that the current revisit time ranges from three to 44 days.
Table 2.2: Radar Capable Satellites (EOS Satellite Handbook 2003; The Satellite Encyclopaedia 2003; Australian Centre for Remote Sensing 2001; Metternicht 1999, pp. 1-17)
Name Launched Std Resolution Revisit Time
Almaz 1A 1991 10 to 15 m 5 – 7 days
ERS 1 1991 26 m 3 + 35 days
JERS 1 1992 25 to 30 m 44 days
ERS 2 1995 26 m 3 + 35 days
Radarsat 1995 24 m 24 days
These characteristics offer excellent opportunities for detecting changes in the built environment and may be used for projects such as coastal zone monitoring (Mahmood & Giguere 1998) and estimating topographic change (Okatani, Watanabe & Koarai 2000; Ticehurst, Dong & Forster 1998). Radarsat’s fine beam offers just under 10-metre resolution and is well suited to that task. Despite radar providing all weather, day / night monitoring capability (Evans n.d.), there are several limitations with several materials being almost transparent to radar, for example, plastic, dry wood and other materials with a low relative dielectric constant (Kruzins, Dong & Forster 1998).
Passive space borne systems may be categorised as either multispectral or hyperspectral. The multispectral systems include the lesser-known film-based system used by the former Soviet Union and high-resolution radiometers that resemble large digital cameras. These electronic multispectral sensors can be found on a number of the remote sensing satellites presently circling the globe. Resolutions and individual revisit times for selected radiometeric instrument carrying satellites are listed in table 2.3.
Table 2.3: Selected Radiometric Instruments in Orbit (EOS Satellite Handbook 2003; The Satellite Encyclopaedia 2003)
Name Launched Max Resolution Revisit Time
Landsat 7 1999 15 m 16 days
Ikonos 2 1999 1 m 3 days
EO 1 2000 10 m 16 days
Eros A1 2000 1.8 m 2 days
Quickbird 2 2001 0.61 m 3 days
Spot 5 2002 2.5 m 26 days
Major corporations previously involved in the collection of high resolution imagery included Space Imaging, Earthwatch, and Orbimage (Jones, A. 1997, p. 15). Presently Spot 5 imagery (2.5m panchromatic) is marketed in NSW by Raytheon Corporation at about A$2.25 per km2 if purchased by the 60km x 60km scene
(Raytheon Corporation 2004). Although a discount would no doubt be given due to the size of the order, a starting price for negotiations would probably be in the vicinity of $A1.8M for the entire state of NSW. Digital Globe imagery, with its increased resolution, retails for at least $US18 per km2 and would be eight times that price, before taking the quantity discount or exchange rate into account (Digital Globe 2004). Imagery obtained from these and similar high-resolution image gathering satellites would be cost prohibitive if regularly collected for large to medium scale topographic mapping.
Experiments on the feature detectability of current satellites have shown them to be suitable for topographic map content at 1:100K– 1:250K using a pixel size of 5–10m (Schiewe, 2001 in Forghani, Reddy & Smith 2003). Selected present and scheduled topographic suitable satellites are listed in table 2.4.
Table 2.4 Launch schedule for high-resolution remote sensing satellites suitable for topographic mapping (Forghani, Reddy & Smith 2003)
Satellite (Operators)
Brief
Description Launch Year More Information
EROS-B1
(ImageSat International)
0.5m PAN &
2m MS 2003 www.imagesatintl.com
Orbview-3
(Orbital Imaging) 1m PAN & 4m MS 2003 www.orbimage.com
Cartosat-1
(ISRO)
2.5m PAN & 0.5m PAN
2003-4 www.isro.org
ALOS-1
(NASDA) 2.5m PAN, 10m MS, & 10- 100m SAR 10
2004 www.nasda.go.jp
KOMPSAT-2
(KARI) 1m PAN & 4m MS 2004 www.kari.re.kr
IKONOS-3
(Space Imaging)
0.50m PAN & 1m MS
2004-5 www.spaceimaging.com
Quickbird-3
(Digital Globe) 0.50m PAN & 1m MS 2004-5 www.digitalglobe.com
RADARSAT-2
(SOAR) 3m PAN SAR 2005 www.space.gc.ca
Hyperspectral systems offer the capability of identifying the material composition for each pixel within the dataset. As each material present exhibits a unique spectral reflectance signature, the materials are identified by comparing the values collected against a library of reference signatures (refer figure 2.7).
Figure 2.7: Hyperspectral Data Collection (Round The World In 80 Clicks)
Research is however making in-roads in this area with the failed Warfighter satellite system, to be operated by the US military offering 8-metre resolution. The nearest civilian equivalent, with 30-metre resolution is the Hyperion instrument on EO-1.
(ii) Airborne Sensors
As with the systems found on satellites, the airborne platform has both active and passive systems. Active systems include LIDAR and Synthetic aperture radar (SAR).
laser scanner. Recent examples of LIDAR include its use by NASA and others in high resolution airborne topographic mapping (NASA 2001; Wright, Swift & Manizade 1997) and by NOAA for coastal monitoring (NOAA Coastal Services Centre 2001). Limitations potentially include data overload, with excessive redundancy due to the number of points collected, and secondly with the data being attribute deficient. With post processing, however, it is possible to create accurate contour information that may be integrated with a variety of other sources.
Current trends within airborne radar systems suggest that this system will be utilised more frequently as capabilities increase. Several airborne systems presently offer swath widths greater than 20 km and better than 10 metre pixel resolution (Metternicht 1999, pp. 1-17). Despite some systems having sub metre pixel resolution, this is currently the exception but may soon become the norm as technologies develop. Revisit times are not only dependent on the aircraft availability but also the methodology used for change detection. The P Band within SAR may also be utilised to offer vegetation and ground penetration capabilities.
Passive airborne systems include electronic sensors, where there are both multispectral and hyperspectral alternatives, and the traditional film capturing approach. Digital camera systems are becoming portable and, if the various systems become interchangeable, will eventually be more economical than ferrying aircraft around. As systems develop, the flexible nature of the digital system will become apparent with terrestrial, close range and aerial applications using the same digital acquisition source (Stojic & Shannon 1998).
The High Resolution Stereo Camera – Airborne (HRSC-A) was originally developed for the Mars96 space mission and combines high resolution and satellite quality imaging with the flexibility of an airborne platform (Lehmann et al. 2000, pp. 12-17). Included in the advantages over conventional film based airborne cameras is the capability for five stereo bands and four multi-spectral bands from blue to near IR. Future developments will also see a 25cm resolution capability from a 6000 metre flying height. Despite this, digital cameras, regardless of platform, will not replace film cameras due to a number of factors which presently include price, resolution, radiometric calibration and quality, and restricted image acquisition (Baltsavias 2000, p. 38).
the ability to recognise features from pixel to multi pixel size in true colour.
Unmanned aircraft are also capable of providing imagery in emergency situations (Fadaie 2001, p. 36). Codarra’s UAVs can be programmed using a laptop computer and offers low cost imagery in real time (Tactical man portable real time aerial surveillance).
The hyperspectral field is also emerging and potentially offers greater identification capability than exists with multispectral devices. Instruments presently include Hymap and the Compact Airborne Spectrographic Imager (CASI) (Rollings, Doblin & Light 1998).
Aerial photography is now GPS controlled with both flight path and shutter control able to be programmed into the onboard computer (refer figure 2.8). Other photogrammetric tasks, such as aerial triangulation and DEM collection, have also been streamlined by the introduction of advanced automated systems (Agouris 2000, p. 81).
Figure 2.8: GPS Controlled Photography (Leica 1994)
(iii) Terrestrial
Traffic Authority for the collection of roadside assets ('Assets to Go' 1996, p. 45). These digital image sequences can be directly georeferenced through the use of navigation and positioning sensors including GPS, inertial navigation sensors and dead reckoning (Tao & El-Sheimy 2000, pp. 84-87).
Terrestrial laser scanning has been used in building definitions and also offers a wide variety of surveying and mapping applications. Different accuracy requirements exist for the individual users within each of these applications (Georgiadou 2000).
b. Attribution
For each feature in the topographic database, attributes are collected that assist in providing the name of the feature, its importance or topographic significance, and the symbology that should be used to represent the feature at a particular scale. These are collected for each feature regardless of type or whether it is present on the map face. They are also collected from a wide variety of sources, which include the white pages (phone directory), the Internet, and published feature directories, especially where the address can be used as the primary locator. Where this is not the case, as with suburbs and localities, further research is required. Additional attribute information, in the case of NSW road names is also sourced from local government.
in size with the Alexandria Digital Library web prototype having over 5 million entries (Goodchild 1996). Jolicoeur (1998, pp. 10-12) discusses this further and provides additional examples of on-line digital names databases, further highlighting the expanding importance of accurate spatial information to society.
c. Change Detection
Detection of change between two remotely sensed images of the same geographic region is not difficult. Finding the significant changes is the challenge. Differences in viewing angle, illumination, seasonal variations in vegetation, cloud cover, and atmospheric conditions for example are real changes that are easily detectable in digital remotely sensed data. In most applications however these are insignificant changes. The imaging process can also introduce spurious differences such as changes in sensor calibration, or mis-registration between the two scenes. Even when all these systematic errors are removed, “significance” remains a subjective attribute. New roads may be significant to one user but of no interest to another.
(Davenport & Sailer 1996)
The accuracy of Government attribute databases can also be maintained using online change of address services ('Changing Address Made Easy' 2002).
(i) Computer Assisted Feature Extraction
Despite being designed to minimise the level of human effort for automatic feature extraction, the sheer volume of collected imagery will quickly overwhelm the image community’s capacity to carry out timely analysis and feature extraction tasks (Doucette et al. 1999; Doucette et al. 2001, pp. 347-358). This is because manual methods for the extraction and determination of features are labour intensive and time consuming (Anderson, Williams & Crowther 1999), further highlighting the need for a less resource intensive system.
Automated systems require a ‘trade-off’ between reliability and precision (Agouris, Mountrakis & Stefanidis 2000), which equates to a compromise between identification and tracking, or the ability to follow a feature. One particular method includes the use of a spatiotemporal gazetteer to assist in detecting real world changes (Agouris et al. 2000, pp. 1241-1250). Other automated methods also exist for road extraction (Trinder & Wang 1998), and automatic feature extraction (Zheng, Coppa & Gang-Jun 1998).
analysing the uncertainty in automated change detection models are presently being developed (Agouris, Gryftakis & Stefanidis 2000).
(ii) Operator Assisted Feature Extraction
Imagery is regularly used for updating maps by detecting the change (refer figure 2.9) between data of differing temporal accuracies (Skender, Lovric & Lampek 1996).
Figure 2.9: North Haven Comparison 1979 and 1997 (Resource Information 1999)
areas, can cause variations in the reflected radiation received by the sensor (Jacobson 1999). These variations can be avoided by adopting a change detection system that is not image based.
(iii) Data Verification
This is a process of data validation and verification, and checks the authenticity of the collected data. Methods include, field checking and ground truthing, and validation against existing internal and external databases.
2.2.2.2 - Data Manipulation
(a) Generalisation
The generalisation process is often non deterministic as the particular methods used by one draftsman may be regarded as being of little use or in the worst case unsafe (Brenn 2001, p. 49). As the process of manual generalisation is largely subjective, any system of automated generalisation would require the acquisition and encoding of ‘expert knowledge’ (Mayer 1998). This is particularly relevant with rasterised vegetation data lacking the smooth generalised outlines present in photogrammetrically collected data. Hart & Gibson (1998) outlines methodology applicable to generalising raster vegetation datasets.
database only effects part of the cartographic database. Large scale “master databases” can be created to feed generalised small scale “product databases” (Carlsson & Johnsson 1997). Kilpelainen (2000, pp. 101-107) expands this concept further with the inclusion of “multiple representation databases”.
Depending on the scale of the map, features often have symbols that are larger than their real world size. Generalisation of the feature’s position is then required especially in situations where the symbology overlaps with other features, annotation or grid lines (Martinec & Faigl 1996). As automated map generalisation systems are created, specific tools will be developed to perform analysis on the data and apply specific generalisation operations (Smith 2000, p. 70). With map publishers inserting copyright traps as a protection measure to detect copyright infringements (Cho & Clark 1998), these operations will, over time, also become automatic.
(b) The Importance of Scale
The resolution of the photograph is dependent on the production scale of the photography and the quality of the photographic film. These both contribute to the final resolution by affecting the size of the photographic grains in ground units. As the photography is being used for data collection, the smallest recognisable feature is determined by pixel size according to scanning resolution, which in turn is also scale dependent.
only that annotation that can be adequately shown on the new map is created.
This is also dependent on the size and location of scale dependent symbology as this determines the quantity of features of particular types that are shown in a particular area.
2.2.2.3 - Output
Output choices may be categorised as either hard or soft copy (refer section 2.3) and includes database driven map automation. This offers users the advantage of a consistent high quality map that can be constructed from a user-friendly interface. This consistency unfortunately eliminates any possible manual intervention that may be required for individual customisation (Maclaren & Hirst 1999).
Traditional hardcopy output is generally regarded as being produced on a media that is non-digital, such as paper or photographic film (refer figure 2.1), despite the initial data used for its compilation being digital. Digital Press Technology offers an emerging cost effective solution for small print runs whilst eliminating the need for proofing, plate creation and calibration (Cliffcolour).
2.3 – Map Related Data: Uses and Benefits
International market studies indicate that global expenditure on spatial information is in the order of $A34 billion a year and growing at a rate of 20%. The Australian spatial information industry has turnover in excess of $1 billion.
(Spatial Information Industry Action Agenda 2001, p. 7)
The effectiveness of maps may be discussed firstly, in terms of their role, secondly whether the map has a particular client or market in mind and finally, in terms of their overall communication and how they are designed (Gerber 1984, pp. 115-121). The relationship between these individual elements and the overall map content is closely related to the function of the map and the reasons behind its production.
Whilst the question of navigation is apparent from both of these suggestions, so is the depiction and location of hazards. Specific examples include hydrographic charts for shipping, air navigation charts for aircraft and specialised large-scale topographic maps for wheelchair users (Beale et al. 2001, pp. 13-18). The defence reason given by McLaughlin & Coleman has also certainly been true over the years. During the Second World War bombing mission maps were made as an oblique view of the target area and were drawn taking flying height and approach bearing into account (Owen & Pilbeam 1992, p. 117). Wildman (2000) and Williams (1999) both outline the defence and military perspective from both Australian and British viewpoints.
2.3.1 - Decision Support Systems
Decision support systems have undertaken a steady evolution from the early days of GIS (Schaefer 2000) and are now actively in use within emergency management organisations. Examples include the Country Fire Authority in Victoria, Australia (Country Fire Authority 1993, pp. 1-8; Garvey, Stephenson & Whelan 1993), the United States of America (Gronlund & Xiang 1993, pp. 102-110), and New Zealand (Majorhazi & Borger 1999).
Within the field of hazard management, GIS is regarded as an important set of tools that can be applied primarily to response planning and operations when required. The requirements, which add to its effectiveness, would include the location of:
o Hazards or agents, o Vulnerable populations, o Vulnerable assets, o Infrastructure,
o Relevant physical features, and
o Resources such as fire stations, dams, and levees.
(Buckle 1993, pp. 12-20)
The information required for these criteria would be collected as part of the topographic map production process and would be further enhanced using additional emergency service specific attribution.
2.3.2 - Softcopy Map Production
No longer restricted to paper, maps are now transmitted almost instantly and delivered to the user in a fraction of the time required to distribute maps on paper
(Peterson 2000)
There has been an expansion of spatial data deployment mechanisms to the web (Christie & Hill 1999) with early examples including web interfaces for internet mapping (Buckley & Sayers 1996, pp. 17-19). Later examples have included the use of the internet and intranet by local government authorities for searching, viewing, and printing of maps (Alakus 1999).
Online atlases are being created and are available in various forms. An early example was the Environmental Resources Information System (ERIS) which was operated by the Australian National Parks and Wildlife Service (Environmental Resources Information System 1993). The Electronic Cultural Atlas Initiative offers a modern example of where development is heading in this area (Electronic Cultural Atlas Initiative 2003).
A range of software is now available to create web friendly document types. Ghostview and Adobe Distiller are both capable of converting files to Adobe portable document format (PDF). Other alternatives include the creation of images from vector information to formats such as .gif and .jpeg, with GIS software such as Arc Map also offering image creation tools using a variety of screen capture techniques.
2.3.3 - Output On Demand
Using electronic technology, no longer does the map user depend upon what the cartographer decides to put on a map. Today the user is a cartographer.
These on demand outputs may be either hard or soft copy with unfortunately no guarantee that the information is temporally accurate. USGS presently release maps by one or more of three methods. The first method produces printed maps using traditional printing presses, the second provides files in .pdf format whilst the third uses the maps on demand system (Hoffman 2000). This last alternative is unfortunately not “live” and may result in a plotted version of a scanned map which may not have been updated since it was originally compiled.
National Geographic Society offer updates for their world atlas, which may be downloaded from their web site, in the form of .pdf files (National Geographic Society 2001a). Print on demand methodology is used by Ordnance Survey (refer section 2.4.2.o) (Stokes 2002) and has also been used in the customisation of hydrographic charts and products for particular segments of the maritime market (Enabnit & Silcox 2001, pp. 41-43). Illinois State Geological Survey have also identified the need for cost effective production of on demand maps within the production fields of review and presentation, as well as for public distribution (Stiff, Beaverson & Krumm 1998).
2.3.4 - Visualisations
discussing this further with the use of 3D GIS to accurately “model our world” through the use of animations in both time and space. Digital terrain models combined with imagery can also be used to aid in land assessment and design development (Bennett 2000, pp. 55-57).
Environmental applications are also relying on the integration of remote sensing, GIS and traditional methods (Stone & Goldney 1998). Vehicle navigation systems rely on several basic topographic features relating to not only where the vehicle can be driven but also road attributes such as road pavement type and the number of lanes (Dmitriev, Stepanov & Koshaev 2000, pp. 69-71). Recent archaeological examples have seen the use of both passive and active remotely sensed data (Sever 1998) with several also being integrated with magnetometry (Ronaldson & Thomas 1999).
2.3.5 – Additional Uses
Further examples of the uses of spatial data may be found in the NSW Government Gazette. The following are selected examples, all of which highlight the benefits of utilising accurate spatial information within the workings of government.
o NSW Fisheries: The receipt of applications, granting, renewal,
and cancellation of Aquaculture leases.
o Department of Land and Water Conservation: The creation,
o Department of Mineral Resources: Exploration licenses,
Mining leases, Opal prospecting areas, and license cancellations.
o Department of Urban Affairs and Planning: State significant
development, Nominated determining authorities, and Local environment plans.
o Roads and Traffic Authority: Land acquisition (for future
roads), Dedication of land as public road, and B Double routes (determines additional attribution).
o Sydney Water Corporation: Sewer and water main
notifications.
o Other Notices: Aboriginal land - Aboriginal Land Rights Act;
Land Acquisition for Easements - Electricity Supply Act; New State forests and Amendments - Forestry Act; Propositions, Amendments to suburb boundaries, New assigned names - Geographical Names Act; Historical significance - Heritage Act; Vesting of land and easements in councils for sewerage - Local Government Act; and Land Acquisition – Public Works Act for example Fish River water supply tunnel
o Private advertisements: Local Government - Acquisition and
2.4 – Maintaining Spatial Relationships
Australia stands out within the global community because of the quality of its government spatial databases. Some land information is collected and stored at the national level, but in the main Australia’s core information resource lies within the various state government departments.
(Mayr 1999)
However Nairn & Holland (2000) also point out that,
Experience is showing us that it is no longer the technology that is the impediment for GIS industry growth but the availability of standards compliant, accurate data that meets user requirements. In Australia, where there are a large number of government agencies across the different jurisdictions controlling much of the geographic information, the issue of access arrangements, including pricing and licensing to this data is currently an obstacle.
2.4.1 - The ever-changing world
This section discusses the maintenance of data by organisations as part of their own core business using both national and international examples and references.
implementation has resulted in a high degree of cooperation between the various sectors. This is especially relevant as “Government is typically the ultimate source of most core or commonly used spatial data” (Rhind 1995). In many countries however, topographic mapping is carried out under military mapping agency control and due to their present political climate is considered “sensitive”. As detailed and accurate data becomes increasingly available over their individual regions, some countries have amended their national policies as the benefits of civilian and social uses are being recognised (Sorensen 2000).
These benefits, which have long been recognised, have led to the introduction of a series of agreed responsibilities for the various levels of government in Australia (refer table 2.5). It can be seen that there is a spatial nature to all of the themes represented.
Table 2.5: A broad overview of the responsibilities of the various levels of government in Australia (Nairn & Holland 2000)
Federal State Local
Taxation Law Enforcement Town Planning
Defence Education Local Roads
Trade and Foreign Affairs
Transport Rates
Social Security Health Services Local Environment Astronomical
Observations and Navigation
Land Management Essential Local Infrastructure
Based on these various levels of responsibilities, several potential data sources immediately emerge within NSW (refer table 2.6 and appendix B).
Table 2.6: Potential Data Sources within NSW
Theme Potential Source
Framework
(Sub theme - Rectified Imagery)
RTA, LPI (NSW), Department of Agriculture, Department of Land and Water Conservation
Vegetation Department of Land and Water Conservation, National Parks and Wildlife Service, Forests NSW, Department of Lands, Department of Defence (Commonwealth)
Cultural 170+ councils and other planning authorities including utilities, NSW Fisheries (Aquaculture Leases) Planning NSW (Developments on line), Acquisition and Disposal of Government Land. Transport Local council / RTA (roads), Rail Estate (rail),
Federal Dept of Transport (air), Waterways Authority (water)
Relief Local council / RTA (cuttings and embankments associated with roads), Local council (development that alters contours / DEM / DTM)
Hydrography Department of Land and Water Conservation Annotation NSW Government Gazette (Geographical Names
Board, councils / or government agencies, Road Names)
Table 2.7: Level of Government Representation (National Guide to Government 1999)
Fed
e
ra
l
NSW Vic WA Qld SA Tas
m
ani
a
NT ACT Tot
a
l
Local Government 0 172 79 142 125 50 29 65 0 662
Lower House 148 93 88 57 89 47 25 25 17 589
Upper House 76 42 44 34 0 22 15 0 0 233
Listings 427 271 244 148 129 133 97 78 71 1598
3082
When isolating the changes, it must be realised that maps make the world seem simpler, due to their generalised nature, than it really is. The National Geographic Society has adopted a change policy that reinforces this: De facto rather than de jure.
It is simplest and best to show the world as it is – de facto – rather than as we or anyone else wishes it to be
(National Geographic Society 2001b)
Existing approaches to updating topographic databases include supplying change only information, or a total resupply of existing data. Beyen & Henrion (1998, p. 59) suggest that there is a growing need to preserve the historical perspective of the data. This is further supported by Brand (1998) who suggests that little consideration has been given during database design to maintenance in terms of currency, presentation and archiving. Beyen & Henrion (1998) also suggest that the change only alternative has the potential to suffer from both human errors and software problems.
Dangermond (1999) offers a different and very interesting view with “The Geography Channel” monitoring the daily change in the world. This would operate similar to the nightly news that exists currently. This supports the views of the Open Space Forum at AURISA 1996 that discussed what customers want in data with respect to the four C's (Veenendaal, Taylor & Gahegan 1997). These being consistent, complete, current, and correct.
software to be capable of supporting a spatial / temporal data model. Bathurst City Council in the financial year 2002-03 received a record 1004 development applications with an estimated value of $84.5 million (Bathurst City Council 2004). This example highlights the dynamic nature of developmental change. Further examples of this change may be found in the NSW Government Gazette (refer section 2.3.5).
A variety of other sources are available and contain information that can also be used to maintain a database’s temporal accuracy. Specific examples include notification type articles ('Removal of Barriers to Fish Passage' 1999, p. 2), which outline industry specific topographical changes. These are often available electronically similar to the “notice to mariners” from the Hydrographic Office and “notice to airmen” from Airservices Australia.
2.4.2 – National and International Mapping Programs
The following case studies and country reports highlight those organisations that are actively involved in conventional revision programs, incremental update and output on demand services.
a. National Geographic Society (World Wide Interest)
program, a scale of their choosing. These maps may be customised, and then printed or saved to disk.
National Geographic also offer output of seamless topographic maps (produced by USGS) through their map kiosks. The user can customise the output through paper rotation, the display of shaded relief and through the choice of map centre. The maps print in less than four minutes on waterproof, tear resistant paper (National Geographic Society 2003) and are available in a range of scales.
The standard output uses 13 x 18 inch paper with the scale of the standard USGS quadrangle altered to fit (USGS 2001b).
b. Geoscience Australia (National Mapping Organisation) Geosciences Australia has produced topographic maps for more than 40 years with the current standard series covering the entire country at a scale of 1:250000 with 513 map tiles. The current program is scheduled for completion in 2004 and is being produced with the aid of the latest satellite imagery, information sourced from local and state authorities, as well as other informed sources. The topographic data is also used to produce a range of hardcopy products at a variety of other scales including 1:100000, 1:1 million, 1:2.5 million, 1:5 million, and 1:10 million and smaller.