University of Southern Queensland
Faculty of Engineering and Surveying
Variable Rate Bitumen Spraying
in Road Construction
and Resurfacing
A dissertation submitted by
Mr Blaise N. Shann
in fulfilment of the requirements of
ENG4111 and 4112 Research Project
Towards the degree of
Bachelor of Engineering (Civil)
ABSTRACT
Over the last decade, traffic volumes, tyre pressures, wheel loads and the percentage of heavy vehicles using the Australian road network has increased significantly. This has led to increased challenges for road designers to provide economical and durable pavement surfaces with adequate surface texture.
A particular solution for improving surface texture on spray sealed surfaces is transverse variable spray rates (TVSR). In this technique bitumen spray-rates are varied across the lane width to account for the impact of traffic in the wheel-paths. This leads to designs where higher binder application rates are used on the shoulders and between the wheel-paths and lower rates in the wheel-paths.
An extensive literature review has revealed very little quantitative data has been analysed to verify the technique is beneficial in providing roads with improved and more uniform surface texture. Undesirable surface texture issues generally consist of flushing or bleeding of bitumen in the wheel-paths, and stripping of aggregate between the wheel-paths and on the shoulders.
The Queensland Department of Main Roads collects annual survey data of their road network, including surface macro-texture data. This project aims to retrieve and compare survey data over a number of years, and collate it with other relevant data to verify if TVSR technology has provided an improvement in surface texture characteristics.
CERTIFICATION
I certify that the ideas, designs and experimental work, results, analyses and conclusions set out in this dissertation are entirely my own effort, except where otherwise indicated and acknowledged.
I further certify that the work is original and has not been previously submitted for assessment in any other course or institution, except where specifically stated.
Name: Blaise Napier Shann
Student No: 0050006129
________________________________
Signature ________________________________
ACKNOWLEDGEMENTS
I would like to take this opportunity to acknowledge the assistance of the following people and thank them for their professional advice, guidance, and continued support throughout this project.
Supervisors:
Associate Professor Ron Ayers
University of Southern Queensland, Toowoomba
Mr. David Seefeld
Queensland Department of Main Roads, Toowoomba District
ARMIS Data retrieval:
Mr. John Devlin
Queensland Department of Main Roads, Toowoomba District
Mr. Selwyn Leslie
Queensland Department of Main Roads, Toowoomba District
I would also like to acknowledge all the Queensland Department of Main Roads staff in the Toowoomba and Warwick offices for their assistance and support during the completion of this project.
Personal:
TABLE OF CONTENTS
ABSTRACT...i
LIMITATIONS OF USE ... ii
CERTIFICATION ... iii
ACKNOWLEDGEMENTS ...iv
TABLE OF CONTENTS...1
LIST OF FIGURES ...5
LIST OF TABLES ...9
ACRONYMS ...10
Chapter 1 INTRODUCTION...11
1.1 Case Study Background ... 11
1.2 Significance of the Study ... 12
1.3 Aims and Objectives ... 14
1.4 Study Area... 14
Chapter 2 LITERATURE REVIEW...17
2.1 History of Bitumen in Road Construction ... 17
2.2 Available Sprayed Bituminous Surfacing Treatments... 18
2.3 Factors Influencing Selection of Surfacing Treatments... 20
2.5 Construction Techniques for Sprayed Surfacings... 30
2.6 Types of Surfacing Failures ... 33
2.7 Conclusion ... 37
Chapter 3 DATA ACQUISITION ...38
3.1 Sand Patch Testing... 38
3.2 ARMIS Data ... 39
3.3 ARMIS Data Retrieval... 41
Chapter 4 METHODOLOGY ...43
4.1 Introduction... 43
4.2 Gore Highway Trial Analysis ... 46
4.2.1 Outcomes from the Gore Highway trial analysis...49
4.3 Identifying Ideal Analysis Locations ... 50
4.4 ARMIS Database Limits and Comparison Criteria ... 51
4.5 Investigation Methodology ... 51
Chapter 5 COMPARISON SECTIONS & DISCUSSION ...63
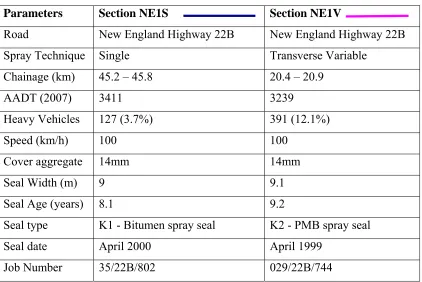
5.1 New England Highway (22B) Comparison Sections... 63
5.1.1 Comparison Section NE1...66
5.1.2 Comparison Section NE2...69
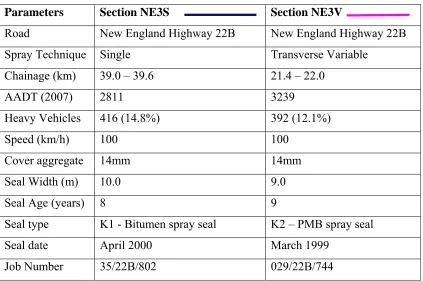
5.1.3 Comparison Section NE3...72
5.1.5 Comparison Section NE5...78
5.2 Discussion of Results for New England Hwy 22B Analysis. ... 81
5.3 South Burnett Highways Comparison Sections ... 83
5.3.1 Comparison Section SB1 ...86
5.3.2 Comparison Section SB2 ...89
5.3.3 Comparison Section SB3 ...92
5.3.4 Comparison Section SB4 ...95
5.3.5 Comparison Section SB5 ...98
5.4 Discussion of Results for South Burnett Highways Analysis... 101
5.5 General Discussion of Results ... 103
5.6 Austroads Sprayed Seal Design Method... 105
5.7 Discussion of Costs related to treatment options ... 106
5.8 Critical Appraisal ... 108
5.9 Further Work... 110
Chapter 6 CONCLUSIONS ...111
REFERENCES...114
Appendix A Project Specification...120
Appendix B ARMIS Chartview Output...122
Appendix C Asset & Layer Information master sheets ...129
Appendix E Sample ARMIS Surface Texture Data (Unsorted) ...143
Appendix F Sample ARMIS Surface Texture Data (Sorted)...145
Appendix G Sample ARMIS Layer Data (Sorted) ...147
LIST OF FIGURES
Figure 1.4.1 Regional Boundaries of Queensland Department of Main Roads.15 Figure 3.2.1 Guide to the Selection of Sprayed Seals………...…….….21 Figure 3.2.2 Sealing Aggregate and Binder Selection Guide……….….23 Figure 2.4.1(a) Relationship between macro-texture, micro-texture, skid resistance
and speed……….………....27 Figure 2.4.1(b) Relationship between macro-texture, micro-texture, skid resistance
and speed……….………...27 Figure 2.5.1 Fulton Hogan Multisprayer with telescopic spray-bars fully
extended to five meters width at Gatton Field Day, February
2008………32 Figure 2.6.1 Adjacent hungry & flushed areas in a failed chip-sealed pavement
Figure 4.2.2 Surface texture comparison for BWP and OWP before and after resealing………..48 Figure 4.2.3 Average surface texture ratio vs. chainage before and after 2007 reseal………...49 Figure 4.5.1 Surface texture ratio analysis for all New England Highway (22B)………56 Figure 4.5.2 Chartview and DVR harnessed to create a powerful analysis tool.57 Figure 4.5.3 The DVR application showing the New England Highway (22B) near the junction with Drayton Connection Road at Hodgsonvale.58 Figure 4.5.4 Excel Spreadsheet with unsuitable chainages highlighted so as to exclude them from the pool of potential comparison sections……59 Figure 4.5.5 An unsuitable section of road for data analysis………...60 Figure 4.5.6 A section with suitable characteristics is identified by the red box..60 Figure 4.5.7 Surface Texture Ratio comparison plot 2001 – 2006
(For chainage 39 – 39.6 km of 22B)...…….………....61 Figure 4.5.8 Average Annual Surface Texture Ratio Comparison………..62 Figure 5.1 Map of Darling Downs region showing New England Highway 22B………...63 Figure 5.1(a) Section reference codes for the analysis……….….64 Figure 5.1.1(a) Average annual surface texture ratio for Comparison
Figure 5.1.1(b) Average annual surface texture depth (mm) for Comparison
Section NE1………67 Figure 5.1.2(a) Average annual surface texture ratio for Comparison
Section NE2………70 Figure 5.1.2(b) Average annual surface texture depth (mm) for Comparison
Section NE2……….70 Figure 5.1.3(a) Average annual surface texture ratio for Comparison
Section NE3………73 Figure 5.1.3(b) Average annual surface texture depth (mm) for Comparison
Section NE3………73 Figure 5.1.4(a) Average annual surface texture ratio for Comparison
Section NE4………76 Figure 5.1.4(b) Average annual surface texture depth (mm) for Comparison
Section NE4………76 Figure 5.1.5(a Average annual surface texture ratio for Comparison `
Section NE5………....79 Figure 5.1.5(b) Average annual surface texture depth (mm) for Comparison `
Section NE5………....79 Figure 5.2.1 New England Highway 22B Uniformity Analysis………….……82 Figure 5.2.2 New England Highway 22B Depth Analysis……….………82 Figure 5.3 Analysis area within the South Burnett region………...84 Figure 5.3.1(a) Average annual surface texture ratio for Comparison
Figure 5.3.1(b) Average annual surface texture depth (mm) for Comparison
Section SB1……….87 Figure 5.3.2(a) Average annual surface texture ratio for Comparison
Section SB2……….90 Figure 5.3.2(b) Average annual surface texture depth (mm) for Comparison
Section SB2……….90 Figure 5.3.3(a) Average annual surface texture ratio for Comparison
Section SB3……….93 Figure 5.3.3(b) Average annual surface texture depth (mm) for Comparison
Section SB3……….93 Figure 5.3.4(a) Average annual surface texture ratio for Comparison
Section SB4……….…96 Figure 5.3.4(b) Average annual surface texture depth (mm) for Comparison
Section SB4……….……96 Figure 5.3.5(a) Average annual surface texture ratio for Comparison
Section SB5……….99 Figure 5.3.5(b) Average annual surface texture depth (mm) for Comparison
LIST OF TABLES
Table 4.5.1 Layer type information from the ARMIS database……….54
Table 5.1.1 Comparison Section NE1……….66
Table 5.1.2 Comparison Section NE2……….69
Table 5.1.3 Comparison Section NE3……….72
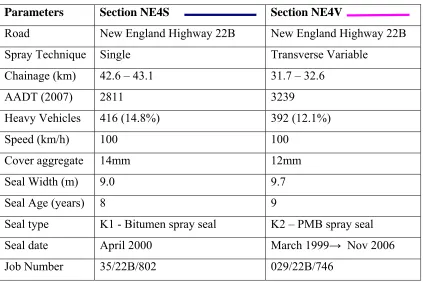
Table 5.1.4 Comparison Section NE4……….75
Table 5.1.5 Comparison Section NE5……….…78
Table 5.3.1 Comparison Section SB1……….86
Table 5.3.2 Comparison Section SB2……….89
Table 5.3.3 Comparison Section SB3……….92
Table 5.3.4 Comparison Section SB4……….95
Table 5.3.5 Comparison Section SB5……….98
ACRONYMS
AADT Average Annual Daily Traffic
ALD Average Least Dimension
ARMIS A Road Management Information System ARRB Australian Road Research Board
BWP Between the Wheel Paths DVR Digital Video Road Viewer ERCP Enhanced Road Condition Project
FRS Fibre Reinforced Seal
GIS Geographical Information System
GPS Global Positioning System GRS Geotextile reinforced Seal HSS High Strength Seal
IWP Inner Wheel Path
MLP Multi Laser Profilers
OECD Organisation of Economic Co-operation and Development
OWP Outer Wheel Path
PAFV Polished Aggregate Friction Value
PAVCON Pavement Condition database PMB Polymer Modified Binder PPE Personal Protective Equipment PSV Polished Stone Value
QDMR Queensland Department of Main Roads SAM Strain Alleviating Membrane
SAMI Strain Alleviating Membrane Interlayer
SCRIM Sideways Force Coefficient Routine Investigation Machine
SMTD Sensor Measured Texture Depth SPTD Sand Patch Texture Depth
STD Standard Deviation
TDIST Through Distance
TNZ Transit New Zealand
Chapter 1
INTRODUCTION
1.1 Case Study Background
Since reliable bitumen spraying technology has been available, Australian road authorities, contractors and the bitumen industry have worked to develop a variety of bitumen surfacing techniques to improve the quality and durability of our road networks. Road Facts, published by Austroads in 2000 states there are approximately 800 000 kilometres of roads in Australia of which about 40% are sealed. The surfacing of this 40% is made up of asphalt, sprayed treatments and a small percentage of concrete pavements. A national survey of the Australian road network (ARRB, 2003) revealed 66% of the Queensland network is sealed with sprayed seal surfacing. A breakdown of our Australian road network by Austroads (2000) shows Rural Arterial and Rural Local roads make up over 85% of the total Australian road network but they receive less than 25% of the annual traffic volume.
These rural and lower-volume roads provide essential links between geographically dispersed communities and are a conduit for the transportation of people, goods and services. Due to the high per capita cost of construction and maintenance of roads in sparsely populated rural areas, there is a crucial need for efficient and cost effective surfacing treatments to enable local councils and state road authorities to extend and maintain their road infrastructure networks within limited budgets.
Many studies have concluded that surface texture is a key parameter in surfacing performance, particularly relating to skid resistance and road safety. Proponents of transverse variable rate bitumen spraying believe that many of the surface texture deficiencies related to traditional sprayed chip-seals can be prevented or remedied by using the transverse variable spray rate technology.
1.2 Significance of the Study
This study focuses on sprayed bituminous surfacings, an area of road construction whose methods has remained largely unchanged since bitumen has found widespread use in road surfacing. Over the last few decades, improved technology has allowed practitioners to trial some innovative new techniques and treatments. One technique in particular, Transverse Variable Spray Rate (TVSR) technology is credited with the ability to compliment and in many cases replace the traditional single spray-rate methods. Single spray-rate sealing methods have provided a relatively effective seal that binds the aggregate into a durable, all-weather surface but as traffic speeds, volumes, loads and tyre pressures have increased, various short comings of single spray-rate bitumen spraying technology have became evident.
A report by John Oliver of the ARRB, titled Thin bituminous surfacings and desirable road user performance (Oliver, 1999) highlighted various engineering properties of the surfacing layers that are essential to road user safety and riding comfort. These properties relate to skid resistance, spray generation, road noise, conspicuous road markings, road glare and reflection, smooth ride and the risk of windscreen breakage. Oliver links surface texture deficiencies to most of the identified problems.
The issue of risk and responsibility in the event of an accident has been recently tested in the 2001 cases of Singleton Shire Council vs. Brodie and Hawkesbury Shire Council vs. Ghantous. The High Court rulings in these cases have opened the way for road authorities to be held responsible for accidents arising from pavements under their jurisdiction that have fallen into disrepair (Oliver, 2001). The outcome of these cases has caused Australian road authorities to seriously consider all safety related issues, including the surface texture and the skid resistance of their road networks in the light of possible future litigation issues.
The accelerated deterioration of pavements due to increased traffic loadings, combined with the threat of possible litigation resulting from accidents where the pavement condition may have been a contributing factor have led road authorities to look for economical solutions to these issues. Many industry practitioners believe that pavement surface texture can be improved in new construction and corrected on existing pavements by variation of the bitumen spray-rates transversely across the road width.
International Road construction company, Fulton Hogan, have undertaken a research project at Tai Tapu in New Zealand where since 2000 they have been measuring texture depths for a variety of spray-rate reductions in the wheel-paths. Their results, (Fulton Hogan, 2007) show that there is a definite positive trend in wheel path texture depth as spray-rates in the wheel-paths are reduced by up to 30%. In Queensland, various Department of Main Roads districts use transverse variable rate bitumen spraying for chip-sealing. Recent presentations given at industry events from districts including Southern, Central and Border Districts show encouraging results.
A comprehensive literature review of Australian and overseas studies show that apart from Fulton Hogan’s New Zealand study, there has been very little quantitative testing done to prove the effectiveness of transverse variable rate spraying. This study aims to provide some quantitative Australian data which can be used to verify the effectiveness of transverse variable spray-rates when compared with single constant spray-rates for sprayed surfacing applications.
1.3 Aims and Objectives
This study will analyse historic and field data to determine any benefits related to utilising transverse variable spray-rate (TVSR) technology in conjunction with chip-sealing as an alternative to other chip-sealing techniques. Key parameters relating the performance of spray-sealed surfacings to important issues such as climate, traffic and cost will be examined. It is also planned to use current available information to identify any areas where the use of TVSRs is beneficial and areas where its use is inappropriate.
During the course of the investigation it is intended to collect published and unpublished knowledge of TVSR technology and present this information in a way that is understandable. By presenting this information in a straightforward way it is more likely to be read and understood by a wider and more diverse audience. An additional aim is to identify the causes of some of the common defects that show up on road surfaces, and some of the available treatments to correct them, and present some solutions that may reduce the incidence of these defects occurring. Available macro-texture data will be used to compare the texture depth on roads treated with single spray-rates and similar roads treated with transverse variable spray-rates to determine if there is a measurable long-term increase in texture depth in the wheel-paths, and an increase in overall surface texture uniformity.
At the conclusion of the study it is anticipated that a model can be derived that presents quantitative evidence to assess the success of transverse variable spray-rate technology in road construction within the study area.
1.4 Study Area
annual survey using Multi Laser Profilers (MLP) mounted on a survey vehicle. This surface texture information related to the Queensland Department of Main Roads (QDMR) network can then be used to analyse the effectiveness of the TVSR technology.
Initially data available from Toowoomba District Office, Darling Downs Region of the Queensland Department of Main Roads was used to develop a model, but then the study could be extended to other areas where relevant surface texture data is available. The Darling Downs Region and Toowoomba District of the Queensland Department of Main Roads are shown in Figure 1.4.1.
Figure 1.4.1 Regional Boundaries for Queensland Department of Main Roads
Chapter 2
LITERATURE REVIEW
2.1 History of Bitumen in Road Construction
Since ancient times, engineers have been considering better ways to create and maintain transport networks. There is evidence King Nebuchadnezzar of Babylon used natural bitumen as a grout for stone roads in about 600 BC (Shell Bitumen, 2003). The Roman engineer and architect Vitruvius left exact instructions on how a road should be constructed, in five layers finished with a durable pavement of stone (Wright, T., 1861).
The art of road building was neglected during the dark ages and travellers were forced to negotiate muddy and rutted roads constructed through the natural subgrade material (Hindle B, 1990). A major transport revolution began in the late 1700’s when Thomas Telford pioneered geometric road design incorporating drainage. John Macadam experimented with various stone sizes to develop a strong bound but unsealed pavement and later incorporated the use of tar as a binder and sealer, to make the surface more durable and hardwearing (Lay, M.,G., 1992).
In Australia during the mid 1800’s the techniques of both Telford and Macadam were utilised to improve the rutted and pot-holed road network that was rapidly expanding throughout the more populated coastal sections of the colony. The technique of Macadam using mud as a binder was found to become very dusty in dry weather and the introduction of the pneumatic tyre and the automobile encouraged the creation of dust free and smooth roads. Early in the 20th Century, a tar truck roll-over accident in Adelaide had the unintentional result of demonstrating the usefulness of tar as an independent surfacing material (Lay, M.G., 1984).
One of the most versatile and valuable by-products is refined bitumen, which due to its excellent binding properties, soon found its way into the manufacture of bituminous surface treatments (Shell Bitumen, 2003). Modern refined bitumen is a sophisticated product available in many forms and grades developed by the bitumen industry for specific uses (Refined Bitumen Association, 2008).
2.2 Available Sprayed Bituminous Surfacing Treatments
The Austroads Sprayed Seal Design Method (2006) gives a comprehensive listing of available bituminous sprayed surfacing treatments. It identifies the most common sprayed seal as a single/single seal consisting of one layer of Class 170 bitumen covered with a single layer of aggregate. The designer can choose from a variety of stone sizes from 7mm to 20mm and also has the option of choosing a different class of binder if the situation requires a binder with different performance characteristics. The ARRB National Survey (2003) revealed the most common aggregate sizes used in Australia are 10 & 14mm, closely followed by 7mm. The survey also shows that half the State Road Authorities do not use aggregate larger than 14mm. Austroads Sprayed Seal Design Method (2006) explains the reasons for this decision being the increased risk of damage to vehicles from flying loose particles, high tyre / road noise, increased binder application rates and increased costs. The Toowoomba District of QDMR utilises a 12mm crushed aggregate for much of their sprayed seal surfacing and have developed their own Supplementary Specification for this aggregate to accommodate district sealing requirements. The Standard Specification used for aggregates by Main Roads is MRS11.22 Supply of Cover Aggregate.
The Austroads Sprayed Seal Design Method (2006) also describes the Cape Seal. A sealing method originally used in Cape Province, South Africa. Generally a 20mm stone is used for an initial sprayed seal, and then either a single or double application of slurry surfacing is applied, which can either partially fill the voids between the bitumen and the top of the aggregate or the aggregate can be fully covered.
Even though most design manuals seem to focus primarily on Class 170, Multigrade binders and polymer modified binders (PMB) used for cutback bitumen, the Austroads Sprayed Seal Design Method (2006), states that bitumen emulsions can be used for almost any purpose for which cutback bitumen is used and are suited to a number of other applications where the use of cutback bitumen is not appropriate. Bitumen emulsions consist of a two phase system containing bitumen and water, where the bitumen particles have been emulsified and are held in suspension within the water. After spraying the emulsion, the water evaporates leaving the bitumen behind. The types and grades of bitumen emulsions are given in AS1160 (Standards Australia, 1996). Drawbacks of sealing with bitumen emulsion include the generally higher cost of the product than cutback bitumen and the higher cost of transportation of the residual bitumen due to the water component. Advantages include safety, due to low temperatures and non-flammability, the ability to seal at lower pavement temperatures and the ability to use with damp aggregates. The lower temperature also delays the degradation of polymer modified binders (Austroads, 2006).
GeoPave Materials Technology (1998) in their technical note HSS, SAM and SAMI Sealing Treatments explains that the membrane eliminates or minimizes the reflection of cracking in a distressed pavement upon the newly laid surface. GeoPave also define a High Strength Seal (HSS) as a sprayed seal surfacing treatment utilizing a polymer modified binder such as crumb rubber and it is used on pavements which are in good condition and will have minimal stress but are subject to high traffic demands. This treatment provides an intermediate solution between a traditional seal using plain cutback bitumen or multigrade bituminous binder, and the premium quality solution of a stress alleviating membrane.
2.3 Factors Influencing Selection of Surfacing Treatments
Guidance is given in this area by the Austroads Sprayed Seal Design Method (2006) which gives a comprehensive list of helpful suggestions to assist in the selection process. This literature review has highlighted that many publications are reluctant to give definite threshold values for where a particular treatment is appropriate. It is common to find reference to vague terms like low, medium and high traffic volumes, rather than definite values. Austroads sums this up by stating ‘There are no quantitative measures available to define where a seal will perform and where it will quickly exhibit distress, and designers must rely on experience and, if necessary, seek expert advice on the practicalities of using a particular surface treatment.’
Having given this caveat to designers, Austroads then provide a very useful guide to the selection of sprayed seals in Table 11.1, on page 50, of Sprayed Seal Design
Method (2006). Table 11.1 has been reproduced in this study as Figure 2.3.1. It
Figure 2.3.1 Guide to the Selection of Sprayed Seals
(Source: Austroads Sprayed Seal Design Method, 2006, p. 50)
The performance of sprayed seals can be enhanced by the use of a multigrade and polymer modified binder (PMB). Further information can be found in Austroads publication, Guide to the selection of roads surfacings (Austroads, 2003). The Australian Asphalt Pavement Association in their Advisory Note 7, Guide to the Selection, Heating and Storage of Binders for Sprayed Sealing and Hot Mixed Asphalt (AAPA, 2003) provide tables showing situations in which each type of binder is best suited and provide an explanation regarding the properties of multigrade and polymer modified binders. The advisory note also explains that multigrade binders work by blending classes of bitumen binder in such a way that the advantageous properties of each can be harnessed to provide a more satisfactory solution than would be achievable by a single class of binder on its own. This particularly relates to binder performance at high and low temperatures.
PMBs are bitumen binders that have had their properties modified by the addition of elastomeric or plastomeric type polymers or the addition of crumb rubber, usually from old car tyres. These specialized binders are used in areas of high stress where there is a high risk traditional bitumen binders would fail prematurely. Austroads (2004) states PMBs provide superior aggregate retention in addition to a more flexible membrane for improved waterproofing and reduction in crack reflection.
The Queensland Department of Main Roads Southern District Sealing Guidelines for new construction (Main Roads, 2004), provide further assistance in seal design by identifying traffic volumes above which transverse variable rate bitumen spraying will be beneficial. Experience in the field in Southern District, now Toowoomba District, has shown that for low traffic volumes, after the application of a well designed seal, excess binder flushing in the wheel paths is not a major issue in new construction. Flushing becomes more prevalent at higher traffic volumes, particularly heavy vehicles, due to the increased compaction in the wheel paths from the higher rate of vehicles using the road.
set at a single, appropriately designed spray-rate across the pavement width. The subsequent second seal is then applied after a period of time. This timeframe is influenced by a variety of factors including adherence to established timeframe principles, the combination of aggregate sizes selected, the performance of the base and the initial seal, the traffic, the geographical location and the weather.
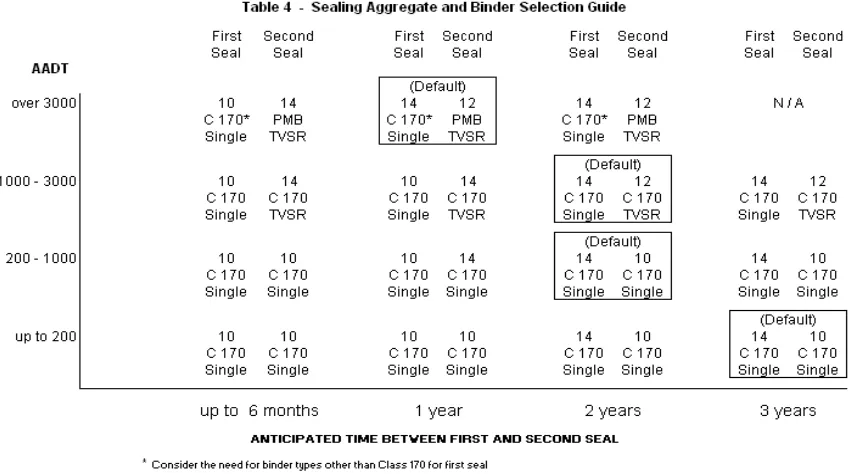
Table 4 of the Southern District Sealing Guidelines for new construction reveals that for subsequent seals on roads with an AADT of less than 200 vehicles, the use of a Class 170 binder and a single, spray-rate across the whole width of the roadway is recommended with a default sealing interval of three years. For AADT between 200 and 1000, the same treatment is recommended but the default sealing interval is reduced to two years. When the AADT reaches 1000 to 3000, Class 170 binder with a transverse variable spray-rate is recommended with a default sealing interval of two years. For AADT above 3000, a polymer modified binder is recommended with transverse variable spray-rates and a default sealing interval of one year. A reproduction of Table 4 is provided in this study as Figure 2.3.2.
Figure 2.3.2 Sealing Aggregate and Binder Selection Guide
The NAASRA Guide to the Selection of Bituminous Surfacing for Pavements (1985) suggest that for an approximate traffic volume of more than 6000 vehicles/lane/day, asphalt surfacing is generally used but double/double seals have been used satisfactorily with a single application seal used as a retreatment.
2.4 Surface Texture
Surface texture is defined by Viner et al (2006) as the macro-texture of the pavement surface. Macro-texture is inturn defined by Visser (1975) as the average depth of the interstitial surface voids, which can be determined by a sand patch test. The procedure for undertaking a sand patch test will be discussed in Chapter 3.1.
Many studies have been undertaken to try and understand the relationship between surface texture and skid resistance and /or stopping distance, including Visser (1975), Vicroads (2002), Viner et al (2006) and Cairney & Germanchev (2006). All studies, except Cairney & Germanchev, emphasise that the relationship that exists is a complex one and skid resistance is related not only to macro-texture but surface micro-texture plays a crucial role as well.
One of the aims of the Vicroads (2002) study in Victoria was to determine a surface texture (macro-texture) limit below which there was a marked increase in the risk of crashes. The study was performed on low-volume rural and urban highways and showed that there was an increased risk of crashes when the macro-texture was low. This result helped determined a desirable, long-term, lower limit on macro-texture on high-speed rural roads of 1.2 millimetres. The study suggested that this performance level could be considered for inclusion into future performance-based contracts. A concurrent sub-study of asphalt, mainly urban roads, revealed there was not a significant relationship between crashes and surface texture for those roads, even though their actual macro-texture was generally limited to 0.4 to 1.1mm. These findings support Vissers’ earlier South African research. Similar work by Viner et al (2006) in the United Kingdom concludes with a confirmation of the importance of maintaining good levels of texture depth particularly on rural roads and particularly where the skid resistance related to micro-texture is also low.
Cairney & Germanchev also refer to similar testing accomplished overseas but reveal there appears to be no published Australian data relating vehicle stopping distance to macro-texture and micro-texture. All past Australian work has related stopping distance to skid resistance as measured by the Sideways Force Coefficient Routine Investigation Machine (SCRIM). They note that recent technical developments in road survey instrumentation, GPS and GIS have made this type of research feasible, assisted by the trend towards annual collection of surface texture data by most road authorities. This type of data is stored in Queensland in the QDMR ARMIS Database.
As far back as 1976, an international study by the Organisation for Economic Co-operation and Development (OECD, 1976) into hazardous road locations determined that substantial reductions in road traffic accidents could be brought about by improvements to surface texture, thereby improving skidding resistance. The study also commented on the contribution adequate macro-texture has to glare reduction when driving at night, and the associated benefits to safety of improved driver visibility. The OECD study also determined a relationship between macro-texture, micro-texture and skid resistance at a variety of speeds. A copy of page 34 of the study is included on the following page.
Figure 2.4.1 illustrates the terms micro-texture and macro-texture, as they relate to
road surface texture and skid resistance. Figure 2.4.2 graphically depicts the results
Figure 2.4.1(a)
The OECD study added that roughness and rutting were also associated with the occurrence of road accidents. These irregularities in the surface profile have an effect on user comfort and when closely spaced, at intervals of one meter or less, it is possible for them to cause loss of control at higher speeds. These larger scale surfacing characteristics are referred to by some practitioners as mega-texture. Phillips & Kinsey (2000) offer the definition that mega-texture refers to surface irregularities with wavelengths between 50 and 500 millimetres.
Phillips & Kinsey went on to warn readers that whilst deeper textured (macro-textured) road surfaces generally provided a greater degree of high-speed skidding resistance, they have been associated with higher vehicle noise levels. Elevated tyre noise levels can be a serious issue particularly in residential and urban areas where the noise can be very disturbing. Phillips & Kinsey, (p. 6) suggested that, ‘two distinct mechanisms were involved in generating tyre noise. The lower frequency elements of the spectra were attributed to noise resulting from tyre vibration, whereas the higher frequencies were related to the compression of air within the region of the tyre / road contact.’
Bitumen flushing in the wheel-paths is not a new phenomenon in New Zealand or Australia but increased traffic volumes and particularly the increase in the size and number of heavy vehicles on the Australian rural road network has exacerbated the problem and the Austroads’ Sprayed Seal Design Manual (2006), (p. 51), states that ‘surface texture has an important influence on the amount of binder required to produce an effective sprayed seal. It may be impossible to design a single binder application rate for flushed wheel path areas and for the highly textured non-trafficked areas across a pavement.’
The inability of a seal designer to select a suitable single spray-rate with the capacity to meet the design requirements of the flushed wheel paths and also the adjacent hungry areas has led to the development of TVSR technology. Oliver (1989) in his presentation, What is happening to our seals? recommended the reduction of bitumen spray-rates in the wheel-paths to reduce the risk of flushing and the associated loss of surface texture. Transverse variable spray-rate technology appears to have been developed relatively independently by various road authorities at about the same time, as a counter measure to the increased stress and flushing exhibited by the seals found in most road authorities networks.
Pidwerbesky & Faulkner, 2006, (p.3), quote Tevlin, as far back as 1988, who comments that ‘a sprayer with two spray-bars, which allowed control of transverse application rate and spraying width while on the move was developed by the Main Roads Department of Western Australia.’ In Queensland, pioneers of transverse variable spray-rate technology were coming up with their own ideas on how successful variable spray-rates could be achieved. The work of these innovators contributed to the development of the Roadtek twin-bar variable rate bitumen sprayer in Southern District. Subsequent presentations about these developments at Main Roads Regional Symposiums (Seefeld, 2000) and in industry publications (Seefeld, 2003) attempted to broadcast the benefits of the technology to the wider transport engineering community.
Hogan had developed a local machine inspired by the European technology and began to use it on New Zealand spray-seal jobs. Once successfully trialed in New Zealand, the ‘Multisprayer’ was brought to Australia in 2007, where Fulton Hogan have been demonstrating its abilities in a variety of situations and seeking bitumen spraying contracts.
2.5 Construction Techniques for Sprayed Surfacings
Regardless of the actual spraying technique employed during the application of a sprayed surfacing, the general plant necessary to successfully complete the job is fairly standard. The sealing operation is a specialised task, and should only be performed by a trained team with a thorough understanding of the process, the requirements and the associated health and safety risks.
The Austroads Sprayed Sealing Guide (2004) describes the system of work used for the application of sprayed bitumen for the construction of a chip-sealed surface. The operation revolves around a truck-mounted bitumen sprayer, equipped with a pump and spray-bar capable of delivering a predetermined quantity of hot bitumen onto the road surface. The bitumen sprayer sets the production rate in sprayed sealing, therefore it is critical there is sufficient equipment available to keep pace with the spray truck (Transport Research Board, 2005).
The ability to store sufficient hot bitumen on-site for refilling the bitumen sprayer is essential. The bitumen is normally stored in road tankers equipped with heating elements to maintain the bitumen temperature. The road tankers bring the bitumen on-site from the refinery or from off-site storage tanks as required. For a successful sealing process, it is crucial that the aggregate is in a suitable condition. It must be sound, dry, dust-free, and coated with a suitable bitumen, oil or water-based pre-coating product, depending on the circumstances.
In addition to the careful treatment and selection of aggregates, only sealing when the weather is warm and dry is essential to minimising the risk of aggregate stripping in the new work. Shading of the job site can lead to the surface being too cool for the bitumen to adequately adhere to the aggregate, and the surface temperature should be monitored. The addition of adequate quantities of cutter oil or adhesion agents is required in many circumstances to minimise the risk of aggregate stripping. The techniques used to apply the bitumen depend on the capability of the spray-truck and the seal design. A single bitumen spray-rate is the simplest design to apply, and once the correct pump speed and ground speed are known for the desired spray-rate, the bitumen is sprayed evenly across the road surface and the aggregate is immediately spread over it.
In the QDMR Central District, a TVSR program has been adopted that consists of consecutive spray-runs by two separate spray-trucks. The first spray-run is applied to the heavy areas (everywhere but the wheel-paths) and the spray-rate is the difference between the heavy and the light spray-rates. The second spray-run delivers a uniform light spray-rate and then the aggregate is applied as usual. This method is only fractionally dearer than single spray-rates, and no special modifications are required (QDMR, 2003).
transverse variable spray-rates and it has been used successfully for a number of years throughout the district (Seefeld, 2003), as well as on contract jobs beyond the boundaries of the district.
These conventional and adapted bitumen sprayers have fixed spray-bars with folding extensions which are quite cumbersome when maneuvering around obstacles and are possibly dangerous to bystanders if unintentionally activated when the extensions are in the folded position due to the orientation of the nozzles (Mott, 2008).
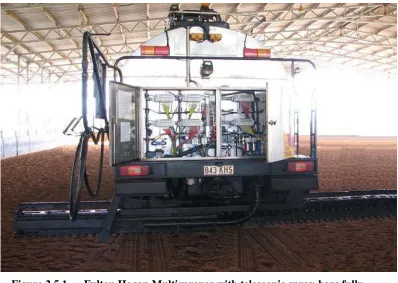
Fulton Hogan developed new technology with telescopic spray-bars that can be extended and retracted as required on the run. See Figure 2.5.1 for a picture of the
extended spray-bars. At the current time this technology appears to be the most advanced in the industry, and Fulton Hogan are looking to increase the capability of the sprayers by integrating electronic surface texture depth capture equipment on the front of the spray-truck, allowing modifications to the spray-rates to be achieved in a real-time environment, to account for existing surface conditions as the sprayer passes over the area of interest (Pidwerbesky & Faulkner, 2006).
Figure 2.5.1 Fulton Hogan Multisprayer with telescopic spray-bars fully
[image:37.595.120.518.428.711.2]The theory involves using digital image processing, incorporating information theory and fast Fourier transform (FFT) analysis to find more accurate methods of measuring surface texture (Pidwerbesky et al, 2006). So far, the research has proved the hypothesis that a physical relationship exists between chip-seal texture and the FFT values of a digital image, but it seems the innovative researchers have quite a way to go before the technique will be available for commercial use.
In the United States, similar problems with bitumen flushing in the wheel paths have been encountered on chip-sealed roads. They have also developed variable application spraying techniques, consisting of a single spray bar equipped with variable nozzles. The variable nozzles are capable of delivering an increased rate of bitumen up to 20% above the design wheel-path rate onto the shoulders and between the wheel paths (Transport Research Board, 2005). This technique was employed by the Queensland Department of Main Roads prior to the development of the twin bar sprayer. It was discontinued due to the difficulties and safety issues involved with adjusting the nozzles to vary the spray rates while hot bitumen is circulating through the bars.
The United States article by the Transport Research Board (2005) goes on to identify industry best practice being achieved by Fulton Hogan of New Zealand, and quotes the results of the variable rate bitumen spraying trials conducted at Tai Tapu in 2000, which show that there is a definite positive trend in wheel path texture depth as spray-rates in the wheel-paths are reduced by up to 30%.
2.6 Types of Surfacing Failures
• gradual hardening of the bitumen binder through oxidisation, resulting in the loss of aggregate (stripping) and the formation of fine cracks – leads to insufficient macro-texture, and the loose stripped aggregate can be dangerous to people and property and often results in windscreen damage and complaints by road users
• aggregate stripping from the seal as a result of aggregate breakdown due to insufficient aggregate strength, or incorrect aggregate application preventing adequate adhesion, including moist aggregate, dusty aggregate, shaded work area or cool or damp pavement
• aggregate embedment from prolonged trafficking and heavy loads
• wear and polishing of aggregates due to heavy traffic volumes – a result of using aggregates with insufficient resistance to polishing for the design application or the use of naturally smooth aggregates, like river gravel – leads to insufficient surface micro-texture
• texture loss through binder flushing or bleeding - often caused by excess binder sprayed in the wheel-paths, but can be caused by sealing too soon after priming or using excess flux/cutter oil – leads to insufficient macro-texture Wear and polishing of aggregates are dealt with in the Australian Standard AS1141 Methods for sampling and testing aggregates under Methods 40, 41 & 42. These tests determine the Polished Aggregate Friction Value (PAFV) or Polished Stone Value (PSV) of a sample. Austroads Sprayed Sealing Guide (2004) suggests that generally hard, fine grained aggregates are more susceptible to polishing than softer course grained aggregates, and PAFV/PSV values in the range of 44 and 48 are generally specified on medium to heavily trafficked roads and values up to 55 may be specified approaching traffic lights, pedestrian crossings and roundabouts.
The unavailability of highly polish resistant aggregates increases the risk of reduced surface micro-texture, as seals age and become worn under traffic stress. The results obtained from the 1976 OECD study confirm that in the absence of significant micro-texture, the contribution of surface macro-texture becomes critical to maintaining even moderate levels of skid resistance.
Loss of surface macro-texture through flushing and bleeding particularly in the wheel-paths, are common causes of premature failure of spray-sealed surfaces. Flushing has already been defined in Chapter 2.4. Bleeding is the next level of
failure, which Austroads, 1992 (p. 34) define as ‘a surface condition in which an excess of free binder completely covers the aggregate. There is no surface texture.’ Bleeding results from a combination of traffic action, warm temperatures and other factors (Austroads, 2004).
Well designed TVSR seal designs have been shown to have the ability to reduce flushing and bleeding in new surfacing work, and the ability to correct or minimise these defects when resealing in areas exhibiting these pre-existing problems (Fulton Hogan, 2007). Due to the inflexibility of single spray-rates, they cannot deliver an effective spray-rate compromise when hungry areas and flushing occur in the same section of road, which is often the case, as shown in Figure 2.6.1.
Figure 2.6.1 Adjacent hungry & flushed areas in a failed chip-sealed pavement
This inflexibility often leads to the flushing problem actually being exacerbated following the reseal if heavier spray rates are used or it leads to stripping of the cover aggregate in the hungry areas if lighter spray rates are utilised. TVSR technology has the advantage of allowing the seal designer to decrease the spray-rates in the flushed areas but still provide a full or increased spray-rate to treat the hungry or stripped areas.
In addition to deterioration of the seal, often issues related to the underlying pavement can cause seal failures. These topics are addressed in AAPA (2004), Main Roads Pavement Design Manual (2005) and again in Austroads (2004). A successful and durable seal must be founded on a stable supportive base. Weak pavement materials, heavy traffic loads and /or the ingress of moisture, either through the seal or from the edges of the road can lead to various forms of pavement failure or deficiency including;
• cracking - including longitudinal, block cracking, slippage cracking or crazing (crocodile cracking)
• deformation - generally associated with heavy traffic, structural inadequacy or independent environment factors
• rutting – vertical deformation of the wheel-paths due to shear failure of one or more pavement layers
• corrugations – leads to pavement disintegration and is thought to be caused by the acceleration or deceleration of slow moving, stop /start traffic.
• shoving – similar causes as for corrugations
2.7 Conclusion
The literature review highlighted that there is very little information available relating to transverse variable rate bitumen spraying and apart from Fulton Hogans’ comprehensive New Zealand research at Tai Tapu, there is very little quantitative data to support TVSR technology, even though it appears to be very effective in improving the application and performance of sprayed surfacings and is recommended by various eminent industry groups.
TVSR technology has the possibility to improve macro-texture in the wheel-paths, while assisting seal designers to deliver higher bitumen application rates on the shoulders and between the wheel-paths to prevent aggregate stripping. The literature review revealed that improved macro-texture is not the only factor involved in increasing skid resistance but surface micro-texture plays a critical role, particularly at lower speeds.
This study deals specifically with surface macro-texture but an overall holistic approach to improved skid resistance must also involve research into adequate micro-texture. Modern technology utilising laser sensor measurement has made cheap and efficient collection of surface macro-texture data a reality but widespread surface micro-texture data is more difficult and expensive to collect once the aggregate is in service. Minimum specifications regarding resistance to aggregate polishing are essential to see a widespread improvement in skid resistance. These minimum specifications are already in place in many areas including Queensland where QDMR have their own specifications relating to aggregate quality.
Chapter 3 DATA ACQUISITION
3.1 Sand Patch Testing
Initially sand patch testing was utilised to develop an understanding of the practical aspects of surface texture (macro-texture) and how the available data relates to the physical road conditions.
The sand patch test involves spreading a defined volume of graded sand level with the top of the aggregate in a circle by revolving a straight edge and measuring the area covered. In Queensland a volume of 50 ml is commonly used for the calculation. The volume equation can then be solved for the average texture depth by dividing the volume of sand by the area of the sand patch (TNZ, 1981) as shown below: ) ( 1000 * 50 4 * 2 mm depth ml = φ π Equation 1 where φ is the sand patch circle diameter in millimetres and 50ml is the defined volume of the sand measuring container.
Rearranging Equation 1 to solve for depth (mm) yields Equation 2:
2 * 4 * 1000 * 50 ) ( φ π ml mm depth texture
Average = Equation 2
A number of sand patch tests were undertaken along the New England Highway to determine the usefulness of this technique for acquiring data for developing the model. Sand circle tests are shown in Figures 3.1.1(a) & 3.1.1(b), including a 50ml sand measuring cylinder to show the scale. Figure 3.1.1(a) shows a 160mm sand
circle giving a 2.49mm texture depth in a hungry or bitumen deficient area between the wheel paths. Figure 3.1.1(b) shows a 311mm sand circle giving a 0.66mm
Figure 3.1.1(a) - 160mm Sand circle Figure 3.1.1(b) - 311mm Sand Circle
After obtaining samples at several locations, it became obvious that there was such longitudinal variability to the surface texture, particularly along the OWP, that to obtain a true representative average sample value for each road section, a large number of tests would need to be undertaken and this would be a very time consuming process. In addition, as the roads of interest have an AADT of greater than 1000, it would be impractical to undertake so many tests while the roads are open to traffic, as the tester must vacate the roadway when traffic approaches for safety reasons. The author then drew the conclusion that for a project requiring such large quantities of surface macro-texture data to obtain realistic results, sand patch testing was not a feasible method for acquiring the necessary data.
3.2 ARMIS Data
Region the only two sprayer operators equipped with transverse variable spray rate technology are Roadtek and Fulton Hogan.
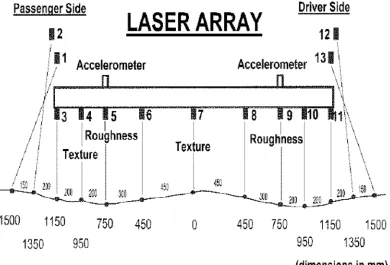
The surface texture data in the ARMIS database relates to surface macro-texture, and this data is captured annually by network survey vehicles equipped with Multi Laser Profilers (MLP). The MLP is an array of laser sensors mounted on the modified front bumper bar of the survey vehicle. The lasers take continuous readings along the road surface related to rutting, roughness and surface texture, while the vehicle attempts to maintain constant speed and position in the traffic lane. A typical network survey vehicle is shown in Figure 3.2.1.
Figure 3.2.1 Network Survey Vehicle fitted with Multi-Laser Profiler
(Source: Courtesy Main Roads)
The configurations and purposes of the lasers of the MLP laser array are shown in
Figure 3.2.2. The sensors for surface texture measurement are set above the outer
wheel path and between the wheel paths.
Figure 3.2.2 Network Survey Vehicle MLP Laser Array (Baran, 2007)
3.3 ARMIS Data Retrieval
The relevant surface macro-texture data is stored in the ARMIS database and limited access to the results is available through the Chartview software application, but more in-depth information is available by request from the district ARMIS operators, who have access to all the District’s ARMIS Data, and limited access to data from other districts. The ARMIS operators can design data browsers to retrieve the exact information requested by the user.
correlate to volumetric sand patch testing, Main Roads has determined that SMTD can be converted to results that are equivalent to sand patch testing by multiplying the SMTD by 2.5 (Clague, 2005). These results are then known as Sand Patch Equivalent Texture Depth (SPTD). The Standard Deviation (STD) of the surface texture data is also available through ARMIS. The STD gives the user a feel for the accuracy of the data.
Chapter 4 METHODOLOGY
4.1 Introduction
Observation of roads shows that the area with the least surface texture is generally found in the outer wheel path as this is the usual location for the most severe bitumen flushing or bleeding. The greatest surface texture is generally found on the shoulders or between the wheel paths. These areas are often deficient of bitumen and appear to be hungry. This is due to a number of issues but one of the most important is lack of compaction by traffic, due to vehicles tracking in the wheel paths. Experience has shown that these hungry areas are likely to show the first signs of bitumen oxidization and potential aggregate stripping.
As the area in the outer wheel path and the area between the wheel paths provide the greatest contrast in surface texture values, it is logical to use these areas for the investigation. For this study the equivalent Sand Patch Texture Depth results from the outer wheel path (SPTD_OWP) and between the wheel paths (SPTD_BWP) were retrieved from the ARMIS database and analysed. The texture depths were compared from roads treated with single spray rates and similar roads treated with TVSR technology to determine if there was a measurable increase in transverse surface macro-texture uniformity and depth across the pavement surface.
A surface texture ratio of the two values was created as shown in Equation 3:
Austroads (2006) suggests transverse variable spray-rates are beneficial for preventing or correcting common surface texture defects like flushing and stripping, and many bitumen spraying practitioners agree, but there is very little available quantitative data to support these commonly held industry assumptions. The literature review revealed an industry desire to achieve more consistent long-term surface texture across the pavement width, and the need to improve skid resistance across the road network. The literature review also revealed that at higher speeds, improved surface texture (macro-texture) has a significant role to play in that improvement to skid resistance.
It is not unreasonable to assume that two roads with similar surfacing characteristics and similar traffic history would have similar long-term surface texture ratios when measured at the same seal age. If the only major variable in the analysis was the bitumen spraying technique utilised, it should be possible to compare the surface texture ratios to obtain some quantitative results regarding the performance of transverse variable spray-rates in achieving a more consistent surface texture across the pavement.
Therefore when similar 1000+ AADT roads are identified and where single spray rates have been utilised, the ratios can be compared, to determine if trends show transverse variable spray-rates provide a long-term ratio closer to unity than single spray rates achieve. Theoretically this should be the case, as the variable spray rates mean the seal designer does not need to compromise as much, and can customise the seal design to accommodate existing variability in surface texture or design the spray-rates to limit the extent of future expected difference in surface texture. It must be remembered that the TVSR technique is only as good as the designer applying it, and an incorrectly designed TVSR job is just as likely to flush or strip as a single spray rate job.
The results of this investigation and information gathered from other sources during the literature review were combined to draw conclusions relating to the performance and suitability of transverse variable spray rate technology in a variety of situations. A flow chart showing an overview of the data analysis process is presented as
4.2 Gore Highway Trial Analysis
Before the actual data analysis was undertaken, a trial sample of data was investigated to gain a better understanding of surface macro-texture behaviour and to identify any trends in the data that may be useful for the study. The surface macro-texture data values from the trial section were analysed to assist in identifying optimal test locations, and the parameters or limits to be used in isolating these optimal test locations for the full scale analysis. The trial data was not used to compare bitumen spraying techniques.
The trial sample of data was taken from the Gore Highway (28A) at Westbrook. The road section had an AADT of 4600, with 28% commercial vehicles and the chainage chosen for the trial was between 9.0 and 12.0 kilometres. In the trial section between the chainages of 10.16 and 10.74 kilometres there is a large-radius horizontal, right-hand curve but the rest of the section consisted of straight level sections of road. In 2005, a slurry surface correction was applied to the outer wheel-path to correct rutting issues related to the heavy commercial vehicles using the route. Apart from this treatment, the road had minimal prior works.
This section of road was particularly attractive to study, due to a Main Roads bitumen binder trial held at the same location during the 2007 reseal (Soward, 2007). This bitumen trial meant that information about the site was readily available and QDMR staff were particularly familiar with the section of road, and could be of assistance, if required, during the initial stages of the investigation.
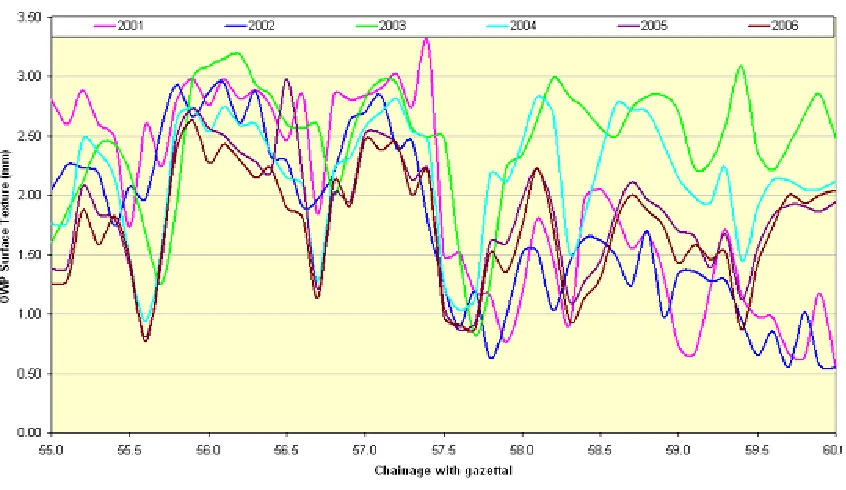
Figure 4.2.1 graphically shows the surface texture history of the outer wheel path
Studies highlighted in the literature review suggest at such a low value of macro-texture, the skid resistance was largely dependent on the micro-texture of the aggregate in the slurry surfacing.
Figure 4.2.1 Progressive loss of surface texture in Outer Wheel Path (OWP)
between 2001 and 2007 reseal
Two orange vertical lines are superimposed onto Figure 4.2.1 at areas where the data
shows consistent abnormalities. At the location of these vertical lines on the plot, there is an increase in macro-texture, which is prominent. These two macro-texture data spikes correspond exactly with the entry and exit to the large-radius, horizontal, right-hand curve. It would be reasonable to assume that as the vehicles enter and exit the curve, there is a slight change in alignment of the wheel-paths, due to curve widening of the pavement, and the tendency of vehicles to wander and occupy a greater width than on a straight section of road (Ayers, 2005).
This would spread the traffic stress on the road over a wider area, and thereby allow a courser surface texture to remain in these areas. As this trend is consistent between 2001 and 2005, this is the likely solution.
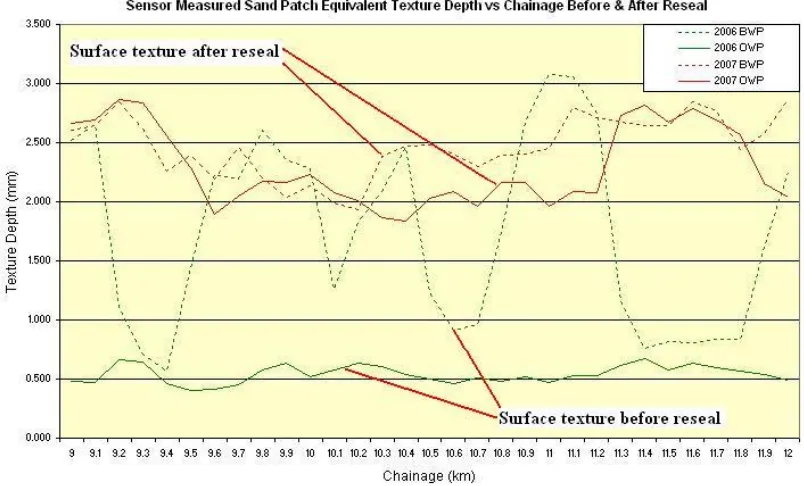
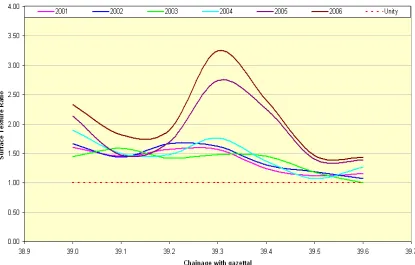
Figure 4.2.2 graphically shows the difference in surface texture between the OWP
and the area between the wheel paths (BWP) prior and following the reseal in 2007. The pre-reseal values are in green and the surface texture between the wheel-paths is shown as a broken line. Prior to the reseal there were large fluctuating differences in surface texture between the two areas. Data collected following the 2007 reseal is shown in red with the same convention as before regarding the broken line representing the BWP texture data. The post-reseal data is much more consistent as expected, with the OWP having an average texture depth of 2.3 millimetres and BWP having an average texture depth of 2.4 millimetres.
Figure 4.2.2 Surface texture comparison for BWP and OWP before and after resealing
The surface texture data used to develop the graphical representation given in
Figure_4.2.2 is then transformed using the ratio technique given in Equation 3, to
[image:53.595.116.518.293.536.2]Figure 4.2.3 Average surface texture ratio vs. chainage before and after 2007 reseal
As expected, the surface texture ratio is relatively high prior to the 2007 reseal, but following the reseal, the ratio is close to one, which is the ideal value. These results demonstrate that the surface texture ratio method provides a simple, uncluttered representation of the data, allowing an instant assessment of the uniformity of the transverse surface texture, and a quick method for comparison against a theoretical ideal value. Due to the fact it is a ratio, differences in surface texture longitudinally do not affect the outcome, as long as the transverse values are consistent, the ratio will be unaffected.
4.2.1 Outcomes from the Gore Highway trial analysis
consistent and will provide more meaningful data, than sections containing curves, even if the curves are of a large radius.
4.3 Identifying Ideal Analysis Locations
As shown in the Southern District Sealing Guidelines (2004), all roads in QDMR Southern District, now Toowoomba District, that have an AADT greater than 1000 and are chip-sealed, receive transverse variable spray rate treatment. Therefore it was essential to obtain sufficient historic information from the ARMIS database regarding AADT, % Commercial Vehicles, binder type, aggregate size and type, speed environment etc to ensure a worthwhile and fair comparison was achieved, with the aim of establishing consistent patterns and trends. The study attempted to restrict its focus area to comparison sections with similar climate and soil types to maximise data consistency for the comparison. The ideal scenario was to use consecutive sections of the same road for the analysis, provided they meet the criteria for a reasonable comparison.
These ideal situations are likely to occur at district boundaries, where one district utilises TVSR technology and the other district still utilises single spray rate. An example of one such situation was the New England Highway (22B) between Toowoomba and Warwick, where the stewardship changes from Toowoomba District to Warwick District. Another situation where suitable comparisons are likely is where a major sealing program has been undertaken using single spray rates and there are areas nearby on the same roads that have been treated with transverse variable spray rates. Such a situation existed in the South Burnett, where the
4.4 ARMIS Database Limits and Comparison Criteria
Following the Gore Highway trial analysis, certain criteria were identified which must be similar to both sites to maximise the reliability of the comparison data. These criteria include binder type, % heavy vehicles, road geometry, climate, soil types, AADT, aggregate size, binder type, speed environment and seal age.
The analysis was limited to pavement sections one kilometre long or less with the following characteristics:
• traffic speed environment of 100 km per hour
• at least 5 years of macro-texture records available in ARMIS database
• at least two years since the last seal was applied, to allow enough time for surface texture issues to become evident
• straight sections of road without significant changes in grade
• road sections without significant turnouts which may affect surface texture
• Average Annual Daily Traffic (AADT) greater than 1000 (where possible)
• minimal prior works to alter surface texture
• no auxiliary lanes in the section, as these would capture some traffic volume
• consistently decreasing trend in the annual surface macro-texture as the seal ages and becomes worn, with no unexpected data anomalies.
• No bridges or obvious changes in underlying material, unless noted
4.5 Investigation Methodology
As discussed previously in Chapter 4.3, The New England Highway (22B) between
The ARMIS Database was queried on my behalf by the district ARMIS Operators using an Oracle data browser customised to extract the records of interest related to the New England Highway (22B). Annual survey data of surface texture was available from September 2001 until December 2006, providing six years of usable records.
The data was extracted from three separate locations within ARMIS and was provided as three separate Microsoft Excel files. For a road of great length with many rows of associated data, careful querying must be used as a maximum of 10000 rows of data can be exported from the ARMIS Database system into an Excel spreadsheet. For roads with more than 10000 rows of data, the system must be queried so as to filter out superfluous records. This is achieved by designing a query to remove attributes that relate to other surface layers like asphalt, so only leaving records relating to spray sealed surfaces. If this still doesn’t reduce the file to less than 10000 rows, it can be sectionalised based on the through distance (TDist), and the sections exported separately.
The ARMIS database system has trouble providing all the information as a single file, as the information relates to different units of measurement. The surface texture data is recorded every 200 millimetres, but to reduce the size of the file and make it more manageable, these surface texture values are averages and entered into the database at 100 metre intervals. The layer information is recorded to the nearest metre, and is entered into the database to align with the chainages of the relevant job numbers. The asset data is recorded every kilometre. Therefore the files were extracted and the data was sorted and manually entered by the author in a master file, which married up the relevant information from the separate Layer, Asset and Surface Texture files.
The first file to be extracted from the ARMIS database related to Asset information, and the following attribute headings were used to obtain the necessary data:
4. TDist* Start 5. TDist* End 6. Seal Width 7. Pavement Width 8. Speed Limit 9. AADT
10. Traffic Percent Heavy Vehicles 11. Traffic Percent Growth
12. Traffic Year (The year the information was gathered) 13. Seal Type
14. Seal Age
* TDist (through distance) refers to the distance with gazettal from a known point at the start of the road, to the point on the section being described. Gazettal refers to the official direction of travel used to describe the road in question.
The file related to Layer information used the following attribute headings to extract the necessary data:
1. District ID 2. Road Section ID 3. TDist Start 4. TDist End
5. Layer Number (ie 1 is the current surface layer)
6. Layer Type# (A code used to identify different road surface types) 7. Layer Type Name (Description of the sealing method ie Bitumen Spray Seal) 8. Layer Depth^ (Refers to the aggregate size in mm for sealed surfaces) 9. Job Number
10. Layer Date (The date the layer was placed)
# All spray sealed surface codes begin with the letter K and are shown in Table 4.5.1
Table 4.5.1 Layer type information from the ARMIS database
Layer Type Code Layer Type Name
K1 Bitumen Spray Seal
K2 Polymer Modified Binder (PMB) Spray Seal K3 Surface Enrichment KU Spray Seal – Quality Unknown
The final file referred to surface texture information and the following attribute headings were used to extract the data:
1. Road Section ID 2. Carriageway Code 3. TDist Start
4. TDist End 5. Lane Code* 6. SMTD_OWP 7. STD_OWP 8. SPTD_OWP 9. SMTD_BWP 10. STD_BWP 11. SPTD_BWP
12. Rating Date (The date the data was collected by the survey vehicle) * Generally surface texture is only recorded in Lane 1, which is the lane running with gazettal. This is due to the prohibitive cost of data acquisition across the whole road network.
When the historical surface texture data for 22B, from September 2001 to December 2006 was extracted, it was sorted for Road Section ID, Rating Date and then TDist. The data was sorted using the Data / Sort command in Microsoft Excel, selected from the menu bar.