The Role of Organizational and Individual Variables in Aircraft Maintenance Performance
Gerard J Fogarty
University of Southern Queensland Toowoomba, Queensland 4350
Australia
Keywords: Safety climate, safety attitudes, aviation maintenance, maintenance errors
Contact details: fogarty@usq.edu.au
Acknowledgements: This research was supported by the Defence Science and Technology Organization (DSTO), part of Australia’s Department of Defence. The author would like to acknowledge the assistance of Lt Col Rob Collyer, Mr Bob Saunders, and the members of 1 and 5 Aviation Regiments, Australian Army, who participated in the research.
Abstract
Aviation maintenance has been identified by the FAA as an area where better efficiency is needed to cope with ever increasing workloads. However, aviation maintenance has also been identified as one of the major causes of accidents. Consequently, if further efficiencies are to be achieved, they cannot come at the cost of reduced safety margins. The present study employed a safety climate approach to assist in the development of a model that can help to explain morale, psychological health, turnover intentions, and error in the aviation maintenance environment. An instrument called the Maintenance Environment Survey was developed and administered to 240 personnel responsible for maintenance of a large military helicopter fleet. Data collected through the survey were used to develop a structural model that predicted 45% of the variance in
The role of Organizational and Individual Variables in Aircraft Maintenance Performance The importance of the maintenance function was captured by Weick and colleagues when they observed that: “Maintenance people come into contact with the largest number of failures, at earlier stages of development, and have an ongoing sense of the vulnerabilities in the
technology, sloppiness in the operations, gaps in the procedures, and sequences by which one error triggers another” (Weick, Sutcliffe, & Obstfeld, 1999, p. 93). A significant proportion of these errors come at the hands of the maintainers themselves as the ever-increasing complexity of aviation places greater demands on those responsible for their maintenance.
Figures emerging from the United Kingdom Civil Aviation Authority (CAA) show a steady rise in the number of maintenance error mandatory occurrence reports over the period 1990 to 2000 (Courteney, 2001). A recent Boeing study of worldwide commercial jet aircraft accidents over that same period shows a significant increase in the rate of accidents where maintenance and inspection were primary factors (cited in ICAO, 2003). The FAA, in its
strategic plan for human factors in aviation maintenance through to 2003, cited statistics from the Air Transport Association of America (ATA) showing that the number of passenger miles flown by the largest US airlines increased 187% from 1983 through to 1995. Over that same period, the number of aircraft operated by those airlines increased 70% but the number of aviation
maintenance technicians increased only 27%. The FAA concluded that the only way the
maintenance program could cope with the increased workload was by increased efficiency at the worker level (cited in McKenna, 2002).
Despite the awareness of the importance of maintenance to the aviation industry and the growing problems confronting maintenance, until recently, empirical research into the nature of maintenance work and related human factors has been negligible. The development of
descriptive models of human error and accident causation (Reason, 1990; Senders & Moray, 1991) and the recent adaptation of Reason’s model to aviation maintenance (Reason & Hobbs, 2003) are major steps in the right direction. Research on error classification schemes (e.g., Patankar, 2002; Shappell & Weigmann, 1997) and, more recently, safety culture (Taylor & Thomas, 2003; Patankar, 2003) represent other bright spots in a surprisingly sparse research literature. However, what are needed in addition to the descriptive accident causation models, classification schemes, and culture surveys are empirically validated models that capture the major influences on maintenance work and provide a means of assessing these influences. Models of this kind can provide the basis for predicting unsafe organizational states and
designing interventions that will lead to reductions in maintenance errors. The present study set out to develop such a model within the context of aviation maintenance using a multivariate methodology that has its roots in what has become known as the safety climate approach. This approach is described in the following paragraphs.
Safety Climate and Safety Culture
that expresses itself through climate (Guldenmund, 2000, p.221). Whereas the assessment of safety culture requires tangible means of measurement such as in-depth interviews and analysis of stated safety goals and polices (Guldenmund, 2000; Mearns & Flin, 1999), safety climate is assessed through self-report questionnaires.
Constructing a Measure of Safety Climate
Attempts have been made to define a core set of constructs for safety climate (see Flin, Mearns, O’Connor, & Bryden, 2000). Although not entirely successful in establishing core dimensions, this research is useful in suggesting constructs that should be considered for inclusion in research on maintenance errors. Recent publications relating to the assessment of safety climate in aviation maintenance also provide guidance. Taylor and Thomas (2003), for example, used a self-report questionnaire called the Maintenance Resource
Management/Technical Operations Questionnaire (MRM/TOQ) to measure what they regarded as two fundamental parameters in aviation maintenance: professionalism and trust. The
dimension of professionalism is defined in their questionnaire in terms of reactions to work stressors and personal assertiveness. Trust is defined in terms of relations with coworkers and supervisors. Questions relating to these areas also appear in the questionnaire to be used in the current research. Patankar (2003) constructed a questionnaire called the Organizational Safety Culture Questionnaire which included questions from the MRM/TOQ along with items from questionnaires developed outside the maintenance environment. Following the application of exploratory factor analytic routines to a dataset generated from respondents that included 124 maintenance engineers, Patankar identified four factors as having particular relevance to the safety goals of aviation organizations: emphasis on compliance with standard operating procedures, collective commitment to safety, individual sense of responsibility toward safety, and a high level of employee-management trust.
Turning to the general safety literature, there are now a host of questionnaires that purport to measure either safety culture or safety climate. Wiegmann and his colleagues (Wiegmann, von Thaden, Mitchell, Sharma, & Zhang, 2003) drew upon 13 such measures to construct their Commercial Aviation Safety Survey (CASS), an instrument designed for use with pilots. Most of these questionnaires are multidimensional, covering a range of factors that the authors consider to be of relevance to safety performance. The availability of so many
questionnaires tapping an array of safety-related constructs presents a challenge to researchers interested in constructing a safety climate survey for use in specific settings such as maintenance.
That challenge was addressed in the present study by using the principle of triangulation to isolate the constructs relevant to a maintenance environment. Drawing upon the distinction between culture and climate made earlier, this methodology entailed a close examination of the safety culture in an organization in order to derive questions for inclusion in a safety climate survey. The first step in the triangulation process involved a search of the safety literature to identify potential constructs for inclusion in the questionnaire. As already mentioned, there is no shortage of surveys in the literature and some researchers have attempted to identify core safety climate constructs (e.g., Flin et al., 2000). The second step involved the analysis of a
incidents. The third method involved a series of focus group interviews with maintenance personnel and their supervisors to ascertain their perceptions of factors that impact on maintenance work. Content analyses of these interviews highlighted organizational concerns such as scheduling and resources.
Information collected in these three phases was then used as the basis for the construction of a questionnaire to measure organizational and individual factors considered likely to impact on maintenance performance. The resulting questionnaire, called the Maintenance Environment Survey (MES), was broader in scope than many of the existing climate or culture surveys. It contained questions intended to define the following constructs: a) safety climate, b) morale, c) psychological health, d) job turnover intentions, and e) maintenance errors.
The construction and validation of the MES was a necessary first step towards the development and validation of a structural model showing how the various factors captured by the survey interact to influence maintenance errors. Despite the proliferation of studies reporting new safety climate questionnaires, there are few studies in the safety literature that have taken the extra step of constructing models to illustrate the interactions among the psychological factors captured by the questionnaires. Using climate surveys in combination with the techniques of multivariate analysis, especially path analysis and structural equation modeling, it is possible to capture elements of the accident causation process and to test different models of how the components of the system work. These models can then be used to direct interventions aimed at improving safety performance in the maintenance environment. The rationale for the model to be tested in the present study is set out in the following paragraphs.
Developing a Model to Predict Maintenance Errors
Regarding the relations between safety climate and maintenance errors, there is now a substantial body of empirical evidence from the general safety literature to support the contention that measures of climate are related to safety outcomes. This relationship has been demonstrated in cross-sectional surveys where scores on safety climate scales have been linked with accidents (Donald & Canter, 1994; Zohar, 1980), in longitudinal studies (Neal & Griffin, 2002), in intervention studies (Donald & Young, 1996), in individual as well as group-level studies (Hofmann & Stetzer, 1996; Zohar, 2000), and across a very wide range of industrial settings. These settings include hospitals (Neal, Griffin, & Hart, 2000), the offshore oil industry (Mearns, Flin, Gordon, & Fleming, 2001), the power industry (Donald & Young, 1996), and chemical processing plants (Hofmann & Stetzer, 1996).
Climate
Training e5 1
Feedback e4 1
Supervision e3 1
Safety Focus e2 1
Recognition
e1 1
Health
Fatigue 1 e9
GHQ 1 e10
Stress 1 e11
z1
1
Morale Orgcomit
e7 1
Jobsatis e6
1
z2 1
Errors
Turnover
z3
z4 1
Responsibility e8
1
[image:6.595.109.539.240.590.2]1 1
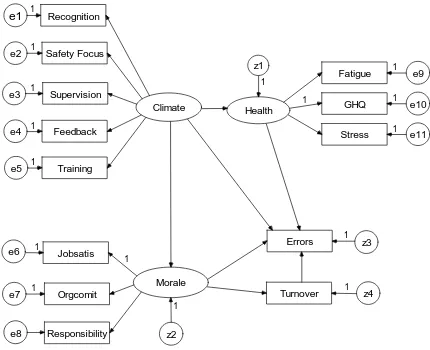
It can be seen that the full model contains both a measurement and a structural
component. Description of the variables that make up the measurement component is deferred until the Method section. A brief description of the structural component is presented here. The first component of the model concerns the safety climate section of the MES. James and James (1989) argued that the various dimensions of climate reflect a higher-order factor (General Psychological Climate, PCg). Safety climate variables are therefore shown as indicators of a latent Safety Climate construct (James & James, 1989). Safety Climate was expected to
influence a second latent construct labeled Morale which was measured by the Commitment, Job Satisfaction, and Responsibility variables. Safety Climate was also expected to influence the psychological health of the individual maintenance workers, a construct that has been labeled simply as Health and that was captured by the measures of stress, fatigue, and the General Health Questionnaire (GHQ: Goldberg and Williams, 1988). Support for these separate pathways to Morale and Health can be found in the work of Hart (1994) showing that morale and
psychological distress are separate outcomes of positive and negative work experiences. Support for the mediating role of psychological health can be found in the work of Oliver et al. (2002) who examined the relationships between individual psychological, work environment, and organizational variables and occupational accidents using SEM. They found that the individual level variables, including safe behaviour and general health, mediated the effects of the
organizational variables on accidents. Stress, in particular, was an important mediator of both organizational and environmental variables.
The pathway from Morale to Turnover was based on well-replicated organizational research demonstrating a strong inverse relationship between commitment and job satisfaction, on the one hand, and turnover intentions on the other (Hulin, 1991). All three latent constructs – Climate, Morale, and Health – were expected to contribute to the variance in self-reported errors. From a theoretical point of view, the role of turnover intentions and its relationship with errors was not all that clear. Reflecting the exploratory nature of some aspects of this study, and bearing in mind its expected relationship with Morale, Turnover is shown as influencing Errors.
Method
Participants
A total of 240 maintenance engineers (232 males) working at the two main helicopter repair bases for the Australian Army responded to the survey, representing a response rate of over 90%. Supervisors, inspectors, and higher level managers were also surveyed but their responses will not be considered here. The survey was targeted primarily at tradespersons (79%) and trainees (21%). The average age of the respondents was 28.5 years and most respondents (84%) had been working as a maintenance engineer or a trainee engineer for at least one year.
Materials
In many instances, scales were already available to measure particular constructs of interest to this study but the approach taken here was that the questionnaire should be tailored to a maintenance context. Accordingly, although individual items may be the same as those used by other researchers, each of the scales was developed for the purpose of this study. The
remaining questions in the survey employed a five-point Likert scale format where 1 indicated strong disagreement and 5 strong agreement. Some items were reverse-scored to encourage respondents to read each question carefully. Scales were formed on the basis of the factor
analysis and average scores obtained by dividing total scores by the number of items in the scale. The scales are described below.
A. Safety Climate
1. Recognition for doing good work (5 items). Sample item: In this job, people are rewarded according to performance.
2. Safety focus of the organization (5 items). Sample item: This unit regards safety as a major factor in achieving its goals.
3. Supervision standards (6 items). Sample item: My immediate supervisor really understands the maintenance task.
4. Feedback on work performance (7 items). Sample item: The quality of our work is rated or evaluated frequently.
5. Training standards and appropriateness (5 items). Sample item: My training and experience have prepared me well for the duties of my current job.
B. Morale
6. Job satisfaction (7 items). Sample item: I like maintenance work.
7. Commitment to the organization (7 items). Sample item: I am proud to tell others that I am part of this unit.
8. Sense of personal responsibility (5 items). Sample item: Whether or not my job gets done is clearly up to me.
C. Psychological Health
9. Exposure to workplace stressors (10 items). Sample item: I get anxious when I work to strict deadlines.
10. Fatigue (5 items). Sample item: My overall sleep quality is extremely poor.
11. Psychological Health. The abbreviated, 12-item form of the General Health Questionnaire (GHQ: Goldberg and Williams, 1988) was used. The GHQ explores four aspects of psychological health: somatic symptoms; anxiety and insomnia; social dysfunction; and severe depression. High scores indicate poor psychological health.
D. Outcome Variables
12. Turnover intentions (1 item). Respondents were required to indicate one of three options: whether they intended to keep working in the maintenance industry (scored 1), whether they were uncertain (2), or whether they were resolved to leave the industry (3). 13. Maintenance errors (5 items). Sample item: I make errors in my job from time to time. E. Affectivity
for PA and NA of .87 and .88 respectively. Eight week test-retest reliabilities were .68 for PA and .71 for NA.
Procedure
The survey was sponsored by Army Aviation Headquarters and survey forms were included in the pay envelopes of all maintenance personnel along with a covering letter explaining the purposes of the survey. To ensure anonymity, self-addressed envelopes were included so that the forms could be returned directly to the investigator. At the completion of the study, feedback sessions on the main findings of the study were conducted by the investigator and a research assistant.
Results
After initial data screening with SPSS (version 11.0.1) to check for accuracy of data entry, the first stage of the analysis involved the reduction of the 112 items comprising MES to a manageable set of underlying factors. The maximum likelihood method of exploratory factor analysis (EFA) with oblique rotation was used for this purpose. Thirty-two of the 112 items came from well-validated scales (e.g., PANAS and GHQ) and a further 12 items were concerned with demographic data, so these were not subjected to factor analysis. The remaining 68 items were developed or adapted for the purposes of the present study and formed too large a block to factor analyze simultaneously. Accordingly, a strategy was adopted wherein groups of items that were intended to measure a particular construct (Climate, Morale, or Health) were factor
analyzed separately. Where there was evidence of unidimensionality and where reliability analysis suggested that a scale formed from the items had good internal consistency (Cronbach’s alpha), the construct was retained for further analysis.
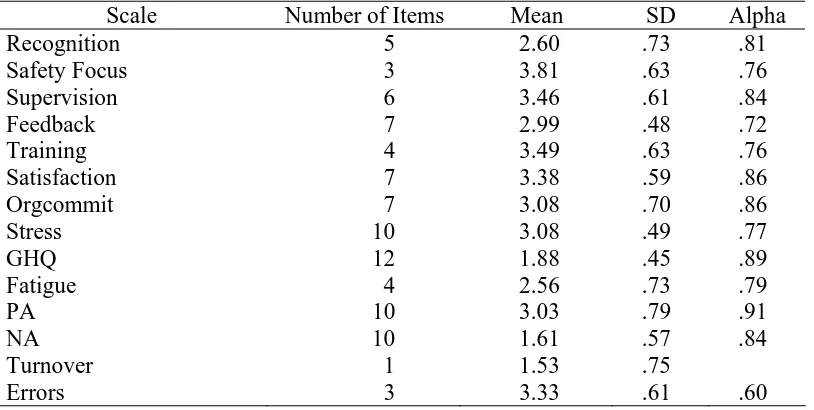
Table 1
Summary Statistics for MES Scales (N = 240)
Scale Number of Items Mean SD Alpha
Recognition 5 2.60 .73 .81
Safety Focus 3 3.81 .63 .76
Supervision 6 3.46 .61 .84
Feedback 7 2.99 .48 .72
Training 4 3.49 .63 .76
Satisfaction 7 3.38 .59 .86
Orgcommit 7 3.08 .70 .86
Stress 10 3.08 .49 .77
GHQ 12 1.88 .45 .89
Fatigue 4 2.56 .73 .79
PA 10 3.03 .79 .91
NA 10 1.61 .57 .84
Turnover 1 1.53 .75
Errors 3 3.33 .61 .60
Note. Reliability could not be estimated for the Turnover scale
The third column in Table 1 shows the average rating of all respondents on a scale ranging from 1 to 5 (except for the GHQ, where scores ranges from 0 to 4). Scores for many scales were reflected so that - with the exception of Stress, Fatigue, GHQ, Turnover, NA, and Errors - a high score is desirable. We can see from these statistics that this sample could be described as having a high concern for safety; as being supported, trained, and well-supervised; as being satisfied with their jobs but desirous of more recognition; as having moderate levels of fatigue, low levels of negative affectivity, and as being prepared to admit to making job-related errors. These statistics are in keeping with a military maintenance
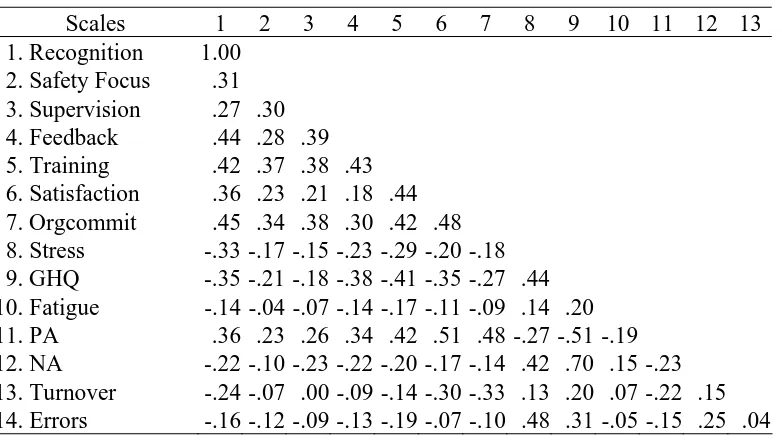
Table 2
Correlations Among Variables (N = 240)
Scales 1 2 3 4 5 6 7 8 9 10 11 12 13
1. Recognition 1.00
2. Safety Focus .31
3. Supervision .27 .30
4. Feedback .44 .28 .39
5. Training .42 .37 .38 .43
6. Satisfaction .36 .23 .21 .18 .44
7. Orgcommit .45 .34 .38 .30 .42 .48
8. Stress -.33 -.17 -.15 -.23 -.29 -.20 -.18 9. GHQ -.35 -.21 -.18 -.38 -.41 -.35 -.27 .44 10. Fatigue -.14 -.04 -.07 -.14 -.17 -.11 -.09 .14 .20 11. PA .36 .23 .26 .34 .42 .51 .48 -.27 -.51 -.19
12. NA -.22 -.10 -.23 -.22 -.20 -.17 -.14 .42 .70 .15 -.23 13. Turnover -.24 -.07 .00 -.09 -.14 -.30 -.33 .13 .20 .07 -.22 .15 14. Errors -.16 -.12 -.09 -.13 -.19 -.07 -.10 .48 .31 -.05 -.15 .25 .04
Note. Correlations above .15 are significant at .01 level
The main dependent variable, Errors, is shown on the bottom line. It can be seen that five of the independent variables were significantly correlated (p < .01) with Errors. The highest correlation was with Stress, which on its own accounted for 23% of the variance in self-reported errors. Other variables with significant (p < .01) associations included GHQ (r = .31), NA (r = .25), Training (r = -.19), and Recognition (r = -.16).
Modelling the Interactions Among Organizational and Individual Variables and Errors
The main aim of the present study was to build a model that captures the major sources of variance in maintenance errors. Before attempting this step, however, it was first necessary to deal with the potential criticism that observed relations among the climate measures in Table 2 could simply be reflecting biases that are inherent in self-report measures (Danna & Griffin, 1999; James & James, 1989). There are many ways to deal with method variance, none of them completely effective. NA and PA are often used as direct measures of a tendency to respond in a positive or a negative way to self-report items. The influence of these variables can then be removed statistically, leaving the partial correlations relatively free of method variance. This technique has its drawbacks (see Podsakoff, Mackenzie, Lee, & Podsakoff, 2003 for a review), the main criticism relating to the fact that NA and PA capture more than method variance and that partialling out their influence may lead to serious underestimations of the strength of
relations among variables. However, objections about method variance can be overcome if it can be shown that substantial variance still remains after NA and PA have been controlled using hierarchical regression analyses. That was the case in the present study: NA and PA accounted for a significant 6% of the variance in errors when they were entered as the first step in a
part of the overall variance captured by the structural model. Furthermore, when all variables were entered in the regression equation, the contribution of PA and NA was not significant, suggesting that method variance was not a problem.
Structural equation modelling (SEM), using Version 4.0 of Arbuckle's (1999) AMOS program, was then employed to test the hypothesized model of the relations among the MES variables. Because of the unfavourable ratio of free parameters to cases, a partially aggregated model (Gribbons & Hocevar, 1998) was used wherein subscales based on the EFA represented the various first-order constructs in the conceptual model. The choice of fit indices in SEM is often a controversial matter. In this study, three indices of model fit were used. The first index was the ratio of χ2 to degrees of freedom where Kline (1998) proposed that a ratio of less than three is acceptable. One incremental fit index was used; the comparative fit index (CFI: Bentler, 1990) which is considered to be reasonably robust against violations of assumptions and where a value above .90 was considered to indicate satisfactory fit. The third index used was the root mean square error of approximation (RMSEA: Steiger, 1990), which indicates the mean discrepancy between the observed covariances and those implied by the model per degree of freedom, and therefore has the advantage of being sensitive to model complexity. A value of .05 or lower indicates a good fit and values up to .08 indicate an acceptable fit (Kline, 1998).
A test of the full structural model shown in Figure 1 (with Responsibility removed) yielded acceptable fit indices (CMIN/DF = 1.85; CFI = .93; RMSEA = .06). The model predicted 47% of the variance in (psychological) Health, 65% of the variance in Morale, 27% of the
variance in Turnover, and 39% of the variance in Errors. However, none of the direct paths from Climate, Turnover, and Morale to Errors were significant. Following a strategy of deleting each of these pathways in turn and using the Chi Square difference test to note the effect on fit
indices, it was found that the only the last of these three pathways (Morale to Errors) was needed to maintain good fit.
Climate .52 Training e5 .35 Feedback e4 .27 Supervision e3 .24 Safety Focus e2 .43 Recognition e1 .65
.44
Health.04
Fatigue .42 GHQ e10 .48 Stress e11 -.67 z1.67
Morale .54 Orgcomit e7 .74 .41 Jobsatis e6 .64 z2.45
Errors.27
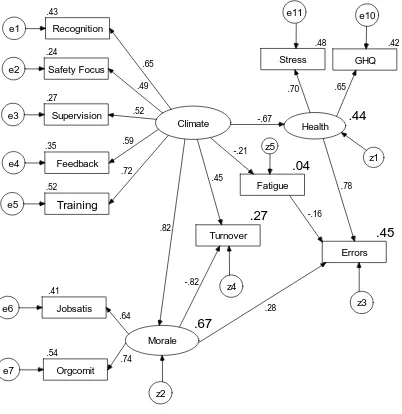
Turnover z3 z4 z5 -.21 .70 .65 .72 .78 -.82 .45 -.16 .28 .82 .52 .59 .49Figure 2 Final model depicting interactions among Climate, Morale, Strain, Fatigue, Turnover, and Errors
To illustrate further, Health is measured by two variables, Stress and GHQ. The pathway from Climate to Health has a coefficient of -.67, indicating that better psychological climate leads to better psychological health (because of the way in which the markers were scored, a low score on Health was desirable). Climate has another pathway leading to Fatigue. The negative coefficient (-.21) indicates that as Climate improves, Fatigue decreases. A third pathway from Climate leads to Turnover. In this case, the positive coefficient (.45) does not make sense from a theoretical viewpoint because there is no reason why a more favorable climate would lead to higher job turnover. A check of the correlations between the individual climate measures and Turnover (Table 2) shows that the true relationship is negative; indicating higher job turnover when the climate is poor. Reversals of sign in path coefficients can occur when predictors of a dependent variable are themselves correlated. In the present case, both Morale and Climate are used to predict Turnover and these two predictors are highly correlated. Delete the pathway from Morale to Turnover and the coefficient for the pathway linking Climate and Turnover switches to a negative sign, as one would expect on a theoretical basis. The final pathway from Climate is that leading to Morale and it can be seen that there is a strong positive association between these variables (β = .82). Morale, in turn, has a strong negative relationship (β = -.82) with Turnover. In other words, the better the morale, the less likelihood there is that workers will think about leaving the organization.
There are three pathways leading to Errors. The first of these is from Morale (β = .28). Again, the direction of the relationship is not in the expected direction because of the presence of correlations among the predictor set. Deleting the pathway from Strain to Errors results in the pathway from Morale to Errors switching to its true negative sign, indicating that high morale is indeed associated with lower error rates, as one would expect on an a priori basis. The major predictor of Errors in this model is Health which, when tested on its own in a reduced model (not shown here), captured 30% of the variance.
The main features of the model are the impressive R2 values for all dependent variables. Safety Climate accounted for 44% of the variance in Health, 67% of the variance in Morale, and a small 4% of the variance in Fatigue. Together with Morale, it also accounted for 27% of the variance in job turnover intentions. Together, these variables accounted for 45% of the variance in self-reported errors. The demonstration that safety climate measures can be modeled using the hierarchical arrangement shown in Figure 1 supports other researchers who have argued for a hierarchical model of climate (e.g., James & James, 1989; Parker et al., 2003).
Discussion
At the survey level, MES captured some of the major factors relating to work performance. The model shown in Figure 2 helps to explain seemingly conflicting findings emerging from the analysis of the incident database and the interview data. As mentioned before, the incident reports tended to put the spotlight on human error as the cause of incidents. This is not a surprising outcome; Shappell and Wiegmann (1997) noted that such reporting systems generally focus on identifying "human failures without regard for why the failures occurred" (p.270). Figure 2 shows that the causal path is as follows: organizational factors influence individuals, who in turn make the errors. The SEM approach has helped to demonstrate the nature of this link. These findings support the claims of other researchers who point to the influence that social and organizational factors have on human error (e.g., Patankar, 2002; Reason, 1990; Sutcliffe & Rugg, 1998). The present study extends these findings by
demonstrating that these linkages are primarily indirect, mediated by individual differences in psychological health and morale.
Implications for Maintenance Work
Reason (1997) likened the practice of surveying the safety climate of organizations as akin to assessing their safety health. This is a very apt description because it is precisely what is implied by the model presented in this paper. Workers’ perceptions of such things as
management’s commitment to safety, appropriateness of training, availability of resources, and possibly many other variables not measured here, do have links with safety outcomes. Whether the perceptions are justified is irrelevant because the effect of the perceptions is felt on morale and psychological health whether there is justification for the perceptions or not. The model also shows that if morale is affected, workers think about leaving the organization, hardly a desirable outcome given the time and money already invested in that worker and the time and money that will be expended in recruitment and further training. The demonstration of indirect links between climate and errors (via psychological health and morale) suggests that the mere presence of unfavourable perceptions of organizational factors is not sufficient in itself to lead to errors. Unfavourable organizational conditions place pressure on the individual and when the individual begins to succumb to these pressures, errors begin to occur.
The implications are that we should measure both psychological climate and individual health and morale variables on a regular basis to ensure that there are no problems of this kind developing. Similar suggestions have already been made in relation to the value of attitudinal surveys in the maintenance environment. Baranzini and colleagues described a new training, evaluation, and research tool called The Aircraft Maintenance Attitude Survey (AMAS). The AMAS can be used to improve training effectiveness by focusing on safety relevant
characteristics of teams and can also help safety goals by monitoring awareness of human factors variables that are related to safety (Baranzini, Bacchi, & Cacciabue, 2001). The UK Civil
Aviation Authority is promoting a similar approach through its Safety Health of Maintenance Engineers (SHoMeO tool; CAA, 2003). A different questionnaire has been used in the present study but the findings provide a strong empirical basis for the use of such surveys. Cox and Cheyne (2000) encouraged the reporting of data gained from such surveys as radar plots. Graphic devices such as star plots can help to monitor the safety climate of the organization and the psychological health of the individuals. They will be especially useful if benchmark
Limitations of Study
In closing, it is important to recognize the methodological shortcomings of the approach followed in this study. The most evident weakness is the use of a cross-sectional methodology, the weaknesses of which in determining causality are well-documented. The use of self-report measures for all variables is also problematic. James and James (1989) raised the possibility that predispositions in affect influence both the general climate factor and the first-order climate factors. In other words, affect could be responsible for the commonality observed among climate measures and also responsible for the correlations between climate and performance. One of the strengths of the present study is that it used PA and NA to capture this type of method variance and, in so doing, demonstrated that substantial correlations exist among all variables even when PA and NA are partialled out.
Another criticism of self-report measures is that they may not correlate with objective measures of performance. In the present context this criticism would translate into the claim that self-reported errors may not correspond with actual errors in the workplace. This criticism can best be addressed by pointing to various studies that have demonstrated a correlation between safety climate measures and objective indicators of safety performance (Donald & Canter, 1994; Hofmann & Stetzer, 1996; Zohar, 1980, 2000). Theoretical accounts of the links between
attitudes, intentions, and behavior, such as that provided by the Theory of Planned Behavior (Ajzen, 1991), also strongly support the use of self-report measures in safety research (e.g., Fogarty & Shaw, 2003).
A further limitation is that the model tested in the current research program has been fitted to data collected in a military environment. Maintenance engineers working in this setting face some challenges (e.g., demands of military duties) that are not faced by those working in commercial settings. The converse also holds true. The model therefore needs to be tested in different organizational settings. Furthermore, as Fahlbruch and Wilpert (1999) pointed out, with the growing trend towards outsourcing of safety units, it may become necessary to extend the safety climate section of the model to include inter-organizational factors. There is no doubt that these factors are becoming important considerations in the aviation industry where key tasks like maintenance are now routinely conducted by third parties. This is true of military as well as civilian aviation organizations.
To conclude, whilst the FAA understands the implications of the tension that exists between increasing demands for air travel and the economic and logistical forces that put pressure on vital functions such as aviation maintenance, increasing the efficiency of
References
Ajzen, I., (1991). The theory of planned behaviour. Organizational Behaviour and Human
Decision Processes, 50, 179-211.
Arbuckle, J. L. (1999). Amos users’ guide: Version 4.0. Chicago: Smallwaters Corporation. Baranzini, D., Bacchi, M., & Cacciabue, P. C. (2001). A tool for evaluation and identification of
training needs in aircraft maintenance teams. Human Factors and Aerospace Safety, 1(2), 167-193.
Bentler, P. M. (1990). Comparative fit indexes in structural models. Psychological Bulletin,
107, 238-246.
Burke, M. J., Borucki, C. C., & Kaufman, J. D. (2002). Contemporary perspectives on the study of psychological climate: A commentary. European Journal of Work and Organizational
Psychology, 11(3), 325-340.
Civil Aviation Authority (CAA). (2003). Introduction to the Safety Health of Maintenance Engineers (SHoMe) tool. www.caa.co.uk/publications.
Courteney, H. (2001). Safety is no accident. Paper presented at the Royal Aeronautical Society Conference, London, United Kingdom, 2 May.
Cox, S. J., & Cheyne, A. J. T. (2000). Assessing safety culture in offshore environments. Safety
Science, 34, 111-129.
Danna, K., & Griffin, R.W. (1999). Health and well-being in the workplace: A review and synthesis of the literature. Journal of Management, 25(3), 357-384.
Donald, I. J., & Canter, D. V. (1994). Employee attitudes and safety in the chemical industry.
Journal of Loss Prevention in the Process Industry, 7, 203-208.
Donald, I., & Young, S. (1996). Managing safety: An attitudinal-based approach to improving safety in organizations. Leadership & Organizational Development Journal, 17(4), 13-20.
Fahlbruch, B., & Wilpert, B. (1999). System safety - an emerging field for I/O psychology. In C. L. Cooper & I. T. Robertson (Eds.), International review of industrial and organizational
psychology (Vol. 14, pp. 55-93). Chichester: Wiley.
Flin, R., Mearns, K., O'Connor, P., & Bryden, R. (2000). Measuring safety climate: Identifying the common features. Safety Science, 34, 177-192.
Fogarty, G., & Shaw, A. (2003). Safety climate and the Theory of Planned Behavior: Towards
the prediction of unsafe behavior. Proceedings of the 5th Australian Industrial & Organizational Psychology Conference, 26-29 June, Melbourne, Australia.
Goldberg, D., & Williams, P. (1988). A User's guide to the General Health Questionnaire. Windsor, Berkshire: NFER-Nelson.
Gribbons, B. G., & Hocevar, D. (1998). Levels of aggregation in higher level confirmatory factor analysis: Application for academic self-concept. Structural Equation Modelling, 5(4), 377-390.
Griffin, M. A., & Neal, A. (2000). Perceptions of safety at work: A framework for linking safety climate to safety behavior, knowledge, and motivation. Journal of Occupational Health
Psychology, 5(3), 347-358.
Guldenmund, F. W. (2000). The nature of safety culture: A review of theory and research. Safety
Hart, P. (1994). Teacher quality of work life: Integrating work experiences, psychological distress and morale. Journal of Occupational and Organizational Psychology, 67, 109-132.
Hofmann, D. A., & Morgeson, F. P. (1999). Safety-related behaviour as a social exchange: The role of perceived organizational support and leader-member exchange. Journal of Applied
Psychology, 84, 286-296.
Hofmann, D., & Stetzer, A. (1996). A cross-level investigation of factors influencing unsafe behaviours and accidents. Personnel Psychology, 49(2), 307-339.
Hulin, C. L. (1991). Adaptation, persistence, and commitment in organizations. In M. D. Dunnette & L. M. Hough (Eds.), Handbook of industrial and organizational psychology (2nd ed., Vol. 2, pp. 445-505). Palo Alto, CA: Consulting Psychologists Press.
ICAO (2003). Human factor guidelines for aircraft maintenance manual.
James, L. A., & James, L. R. (1989). Integrating work environment perceptions: Explorations into the measurement of meaning. Journal of Applied Psychology, 74(5), 739-751. Kline, R.B. (1998). Principles and practice of structural equation modeling. New York:
Guilford.
Mearns, K., Flin, R., Gordon, R., & Fleming, M. (2001). Human and organizational factors in offshore safety. Work & Stress, 15(2), 144-160.
Mearns, K., Whitaker, S. M., & Flin, R. (2001). Benchmarking safety climate in hazardous environments: A longitudinal, interorganizational approach. Risk Analysis, 21(4), 771-786.
Mearns, K. J., & Flin, R. (1999). Assessing the state of organizational safety--Culture or climate?
Current Psychology: Developmental, Learning, Personality, Social, 18(1), 5-17.
McKenna, J. T. (2002). Maintenance resource management programs provide tools for reducing human error. Flight Safety Foundation Flight Safety Digest, 1-15.
Neal, A., & Griffin, M. A. (2002). Safety climate and safety behaviour. Australian journal of
Management, 27(Special Issue), 67-75.
Neal, A., Griffin, M.A., & Hart, P.M. (2000). The impact of organizational climate on safety climate and individual behavior. Safety Science, 34, 99-109.
Nunnally, J. C., & Bernstein, I. H. (1994). Psychometric theory (3rd ed.). New York: McGraw-Hill.
Oliver, A., Cheyne, A., Tomás, J. M., & Cox, S. (2002). The effects of organizational and individual factors on occupational accidents. Journal of Occupational and
Organizational Psychology, 75, 473-488.
Parker, C. P., Baltes, B. B., Young, S. A., Huff, J. W., Altmann, R. A., Lacost, H. A., & Roberts, J. E. (2003). Relationships between psychological climate perceptions and work
outcomes: A meta-analytic review. Journal of Organizational Behavior, 24, 389-416. Patankar, M.S. (2003). A study of safety culture at an aviation organization. International
journal of applied aviation studies, 3(2), 243-258.
Patankar, M.S. (2002). Causal-comparative analysis of self-reported and FAA rule violation datasets among aircraft mechanics. International Journal of Applied Aviation Studies,
5(2), 87-100.
Podsakoff, P. M., MacKenzie, S. B., Lee, J.-Y., & Podsakoff, N. P. (2003). Common method biases in behavioral research: A critical review of the literature and recommended remedies. Journal of Applied Psychology, 88(5), 879-903.
Reason, J., & Hobbs, A. (2003). Managing maintenance error. Brookfield: Ashgate. Senders, J. W., & Moray, N. P. (1991). Human error: Cause, prediction, and reduction.
Hillsdale, NJ: Lawrence Erlbaum.
Shappell, S. A., & Wiegmann, D. A. (1997). A human error approach to accident investigation: the taxonomy of unsafe operations. International Journal of Aviation Psychology, 7 (4), 269-291.
Steiger, J. H. (1990). Structural model evaluation and modification: An interval estimation approach. Multivariate Behavioral Research, 25, 173-180.
Sutcliffe, A., & Rugg, G. (1998). A taxonomy of error types for failure analysis and risk assessment. International Journal of Human-Computer Interaction, 10 (4), 381-405. Taylor, J.C., & Thomas, R.L. (2003). Toward measuring safety culture in aviation maintenance:
The structure of trust and professionalism. The International Journal of Aviation
Psychology, 13(4), 321-343.
Tomás, J. M., Melia, J. L., & Oliver, A. (1999). A cross-validation of a structural equation model of accidents: Organizational and psychological variables as predictors of work safety.
Work and Stress, 13, 49-58.
Watson, D., Clark, L. A., & Tellegen, A. (1988). Development and validation of brief measures of positive and negative affect: The PANAS scales. Journal of Personality and Social
Psychology, 54, 1062-1070.
Weick, K. E., Sutcliffe, K. M., & Obstfeld, D. (1999). Organising for high reliability: Processes of collective mindfulness. Research in Organizational Behavior, 21, 81-123.
Wiegmann, D.A., von Thaden, T.L., Mitchell, A.A., Sharma, G., & Zhang, H. (2003).
Development and initial validation of a safety culture survey for commercial aviation. Technical Report AHFD-03-3/FAA-03-1, Federal Aviation Administration, Atlantic City International Airport, NJ.
Zohar, D. (1980). Safety climate in industrial organizations: theoretical and applied implications.
Journal of Applied Psychology, 65, 96-102.