students’ reported satisfaction levels
Ray Malpress and David Buttsworth
University of Southern Queensland, Toowoomba, Australia [email protected]
Abstract: Data for an undergraduate problem solving course was collected from 92 external students and 73 on campus students. Student satisfaction levels were assessed from feedback submitted with the assessment. An email-based survey was completed on a voluntary basis by a portion of the students after completing one further semester of study. The data collected in the survey suggests that reported satisfaction levels have no discernible correlation with grades awarded for each student. The subject consisted of two assignments and a final examination. The data from feedback included in assignment submissions was assessed using inferential analysis and compared with reported
satisfaction levels from the voluntary responses to the email-based survey. Indications were found that respondents who indicated dissatisfaction also reported no benefit from participation in the course with respect to improved capability to work in a team or benefits accrued in the course for use in later subjects.
Introduction
If you asked the question, “How do you get better SELT (Student Evaluation of Learning and Teaching) numbers from your students”, you could well hear, “Just give them better grades!” The response could well be whimsical, but anecdotally, it seems to be a commonly held thought in the minds of teachers trying to juggle their work load, student retention issues and incentives, and their own career aspirations, while still holding a genuine desire to have students appreciate their teaching.
To establish whether students’ reported satisfaction levels are influenced by the grade achieved, a study of student satisfaction levels in relation to a team based problem solving course at the University of Southern Queensland was conducted. The subject, Engineering Problem Solving 3 (PS3) is
undertaken by all Bachelor of Engineering students in second semester, second year for those on-campus students taking the preferred enrolment pattern. All majors participate in teams of 4 or 5 students with a diversity of majors within each team. Teams are made up of either on campus students or external students. Engineering Problem Solving 3 aims to extend student team work experience and problem solving skills while introducing numerical techniques using Matlab.
To augment the feedback received during the course, a survey was distributed to all students who initially enrolled. Students responded voluntarily, therefore potentially producing a biased sample. The survey data was compared to inferentially analysed feedback data. The total enrolment for the subject was 165, consisting of 73 on campus students and 92 external students. 19 external students (21% of enrolments) responded to the survey with one of those students having not submitted any feedback during the course assessment. 12 on campus students (16% of enrolment) responded.
Literature Review and Research Question
The assumption that increased grades leads to increased satisfaction appears common. However, Pike (1991) addressed this assumption and reported that “satisfaction exerts a stronger influence on grades than grades exert on satisfaction”. Persistence (retention) levels were addressed in Pike’s work with one purpose being to identify why individuals failed to complete study at various levels. In Pike’s study of 1991, it was reported that student satisfaction would be increasingly used as a measure of institutional performance, and this seems to be the case.
The Australian Government Review of Higher Education (Bradley, Noonan, Nugent, & Scales, 2008) recommends in its executive summary, amongst many other things that, ‘a proportion of the funds allocated to institutions will be allocated on the basis of performance against specific targets for teaching and equity’. So the question arises, “What mechanisms are used to assess the performance of institutions?” Consequently, “What influence can university teaching staff have on the mechanism that impacts on their institution’s funding?”
The association between reward (grades), student effort, self-efficacy and student satisfaction are addressed by Nesbit and Burton (2002). They argue that students’ evaluation of instructors’
performance is more complex than simply reflecting ‘a good grade promotes favourable evaluations’. They assert that students assess course delivery in a significantly more complex fashion than reporting on the grade achieved.
Because reported student satisfaction levels contribute to funding levels, it seems important to explore what aspects of a student’s experience affect their reported satisfaction levels. This paper explores one aspect of student reported satisfaction levels, “Does a higher grade given for a subject improve the student’s reported satisfaction level?” within the context of a team-based problem solving course delivered to on-campus and external students.
Methodology
From techniques described by Bernard (2006) and Fischer (1994), the data collected from the students feedback submitted with assessment (feedback data) was correlated with data collected from an emailed survey (survey data).
The feedback questions were designed with several goals in mind. Primarily the information was intended to directly contribute to improving course content and delivery. Part of the course required the use of a remote lab. Feedback requested an appraisal from students as to the functionality and accessibility of the remote lab. The use of hardware (actual physical equipment) was employed in the course with the goal of improving exposure of students to physical phenomenon in what is perceived as increasingly theoretical teaching environments. Feedback was sought on the appropriateness and significance of the use of hardware. An opinion on the overall experience of the problem solving course was also requested in the feedback. The feedback questions were arranged to have students reflect on their satisfaction levels with the subject as a whole.
purpose of assessing the relationship between the feedback data and the survey data. Some of the survey data was not used for some of the analysis when insufficient individual feedback data existed.
The feedback data and survey data was transformed into a numerical scale representing satisfaction levels during the course and at the time of the survey. The data was displayed graphically on a plot of student’s marks for the subject versus the student’s accumulated GPA before commencing the semester in which they studied the subject. This technique allowed identification of any trend in the relationship between the marks achieved and the previous GPA with satisfaction level. Considerations were taken of previous GPA alone with satisfaction level. A comparison was also taken of marks achieved against satisfaction level. Satisfaction level was considered in two forms: (1) the satisfaction reported in the survey (that is the satisfaction with the subject as reported by the student at a date after the subject was concluded); and (2) a relative satisfaction level determined from the change in
reported satisfaction from the feedback data to the satisfaction level reported in the survey.
The survey also asked several questions relating to the students’ views on teamwork, the use of hardware, and the level of difficulty of the assessment they experienced in the subject. Survey reliability was achieved using a patterned approach where pairs of questions were constructed for the purpose of validating answers.
Results and Discussion
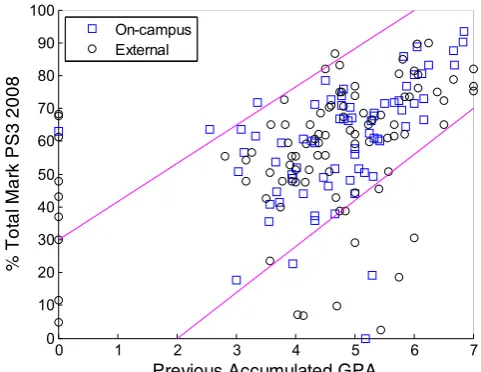
The first comparison of the survey data was to assess whether the respondents were a good cross section of the students enrolled in the subject. Figure 1 shows the full enrolment for the subject on a plot of marks achieved in the subject versus previous accumulated GPA.
0 1 2 3 4 5 6 7
0 10 20 30 40 50 60 70 80 90 100
Previous Accumulated GPA
%
Tot
al
M
ar
k P
S
3 2008
[image:3.595.169.410.403.589.2]On-campus External
Figure 1: Full distribution of enrolments for Problem Solving 3, 2008 showing the position of each student with respect to the mark achieved in the subject and the previously accumulated GPA. In this figure and all similar figures, the diagonal links represent the bounds of the indicative trend for students to score a grade similar to their
previous GPA.
3 4 5 6 7 20 40 60 80 100
Previous Accumulated GPA (EXT)
% T ot al M ar k P S 3 200 8
3 4 5 6 7
20 40 60 80 100
Previous Accumulated GPA (ONC)
[image:4.595.82.470.75.227.2]% T ot al M ar k P S 3 20 08
Figure 2: External and on campus respondents were a good representative sample of enrolled students (See Figure 1)
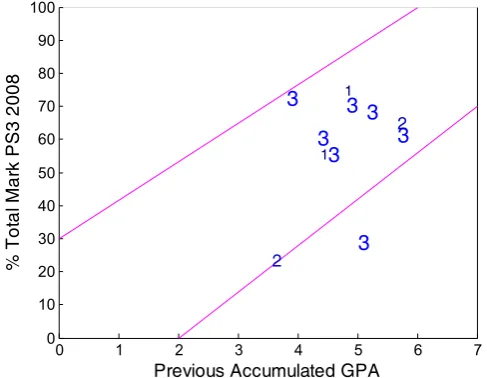
Using external student respondents, Figure 3 shows that no discernible trends exist to correlate the students’ survey reported satisfaction level relative to their feedback reported satisfaction levels with students previous accumulated GPA. Figure 3 is for students whose survey reported satisfaction level was higher than the feedback reported level. The numerals 1 through to 3 indicate the level of their satisfaction with 3 indicating significant satisfaction.
0 1 2 3 4 5 6 7
0 10 20 30 40 50 60 70 80 90 100
Previous Accumulated GPA
[image:4.595.168.412.349.538.2]% T o ta l M a rk P S 3 2 0 0 8 3 3 1 3 3 3 2 1 3 2 3
Figure 3: External student indication of increase in satisfaction levels between the feedback data and the survey
data: 1 indicating slight change through to 3 indicating significant change.
Similar plots for external students who reported a reduction in satisfaction levels between feedback and survey, and for both categories of on campus students (those with increased, and those with decreased levels of satisfaction) showed no trends to indicate that satisfaction level was influenced by grades achieved in the subject.
3 4 5 6 7
←
D
is
-s
a
tis
fa
ctio
n
S
a
tis
fa
ctio
n
→
GPA before commencing PS3
[image:5.595.185.409.83.271.2]ONC increased satsifaction ONC decreased satisfaction Ext increased satisfaction Ext decreased satisfaction
Figure 4: Survey reported satisfaction levels for all respondents plotted against GPA. No discernible trends indicate that previously accumulated GPA had any influence on reported satisfaction levels.
With respect to reported satisfaction levels plotted against the marks achieved in the subject, Figure 5 gives a similar picture as Figure 4.
0 20 40 60 80 100
←
D
is
-s
a
tis
fa
ctio
n
S
a
tis
fa
ct
io
n
→
Marks for PS3-2008
ONC increased satsifaction ONC decreased satisfaction Ext increased satisfaction Ext decreased satisfaction
Figure 5: Survey reported satisfaction levels for all respondents plotted against marks achieved in the subject. No discernible trends indicate that marks achieved did not have any influence on reported
satisfaction levels.
The data was further analysed to assess whether any trends existed for any of the associated questions posed in the survey. In this analysis, different trends were evident for on campus students than for external students.
External students whose satisfaction level in the survey was lower then the feedback satisfaction indicated that they were not more capable of working in a team after having studied PS3. These students’ average response to the question, ‘I found PS3 helped with later courses’, was 2.0 based on a numerical scale (1 for strongly disagree to 5 for strongly agree). For the students whose satisfaction level was higher in the survey relative to the feedback averaged 3.8 for this question. The same group of external students with a decreased satisfaction levels, also reported disagreement with the
[image:5.595.182.413.364.551.2]2.1 on the numeric scale. External students with increased satisfaction averaged 3.8. On-campus students did not indicate this trend.
On campus student whose survey satisfaction was lower than their feedback satisfaction reported that they lacked the background knowledge to fully participate in the subject, averaging 3.8 on the numeric scale to the question, ‘I lacked the background knowledge and experience with hardware to fully participate in PS3’. Where as, on campus students with increased satisfaction indicated their background knowledge was not disadvantageous, averaging 2.5 on the scale. A similar trend was evident for a question about the difficulty of the content of PS3. External students did not display these trends.
One could speculate about the association of satisfaction to the capacity to participate in the subject, but the analysis shows that independent of that, students reported satisfaction levels were not related to the marks achieved in the subject. Student satisfaction with the content and delivery of the subject was independent of the marks achieved. The analysis suggests that features of a course, for example, team work or required background knowledge can influence what level of satisfaction is reported by students.
Conclusion
This analysis of student satisfaction levels reported for this team based problem solving course shows that students were not influenced by the grade they received for the subject. This suggests that any anecdotal evidence that improving students reported satisfaction levels by increasing grades is
unfounded. In the author’s view, if student satisfaction levels with a subject are low it is likely to be an indicator that the subject has deficiencies; at least relative to the student’s experience at the time. From the work reported here, the author concludes that students assess their satisfaction with a subject in a comprehensive and sophisticated way. It appears that to improve student satisfaction, many aspects of course content and delivery need to be considered.
The work presented here reinforces the usefulness of including feedback from students as part
of assessment. Future work will attempt to create formats that allow students to report specific
information for use in course reviews, which also allow those responses to be potentially
useful in other research endeavours not specifically identified at the time.
References
Bernard, H. R. (2006). Research methods in anthropology : qualitative and quantitative approaches
(4th ed.). Lanham: Altamira Press.
Bradley, D., Noonan, P., Nugent, H., & Scales, B. (2008). Review of Australian Higher Education Report. Retrieved. from
http://www.deewr.gov.au/HigherEducation/Review/Pages/ReviewofAustralianHigherEducatio nReport.aspx.
Fischer, M. D. (1994). Applications in computing for social anthropologists. London ; New York: Routledge.
Nesbit, P. L., & Burton, S. (2002). Student Perceptions Following Assessment: An Investigation of the Effort-Reward Relationship and its Impact on Efficacy Cognitions [Electronic Version]. Retrieved 29/7/09.
Pike, G. R. (1991). The effects of background, coursework, and involvement on students' grades and satisfaction. Research in Higher Education, 32(1), 15-30.