Workforce Issues in Nursing in Queensland: 2001 and 2004
Queensland nurses workforce
Authors:
*Desley HegneyRN, BA (Hons), DNE, PhD, FRCNA FCN (NSW), Director, Centre for Rural and Remote Area Health, Faculty of Sciences, University of Southern Queensland and Faculty of Health Sciences, University of Queensland. [email protected] tel +61 7 4631 5456, fax +61 7 4631 5452
Robert Eley BSc (Hons), MSc, PhD, MIBiol, CBiol, Senior Research Fellow, Centre for Rural and Remote Area Health, University of Southern Queensland, Toowoomba, Australia.
[email protected], tel +61 7 4631 5477, fax +61 7 4631 5452
Ashley PlankDip.T, BSc, MSc (Hons), PhD, Statistics Coordinator SimStat, Department of Mathematics and Computing, Faculty of Sciences, University of Southern Queensland, Toowoomba, Queensland, Australia. [email protected]. tel +61 7 4631 5538, fax +61 7 4631 5452
Elizabeth Buikstra BSc (Hons) PhD,Research Fellow, Centre for Rural and Remote Area Health, University of Southern Queensland, Toowoomba, Australia [email protected], tel +61 7 4631 5443, fax +61 7 4631 5452
Victoria ParkerRN, BHSc, Grad. Dip. Critical Care, MN, MRCNA, Lecturer, Department of Nursing, University of Southern Queensland, Toowoomba, Queensland, Australia. [email protected] tel +61 7 4631 2377, fax +61 7 4631 5452
*Address for correspondence: Professor Desley Hegney
Centre for Rural and Remote Area Health University of Southern Queensland PO Darling Heights
Queensland Australia 4350
Ph: +61 7 4631 5456 Fax: +61 7 4631 5452 Email: [email protected]
ABSTRACT
Aims and objectives: The aim of the study was to identify the factors impacting upon nursing
work and to use the results to inform strategic planning of the Queensland Nurses Union.
Background: In 2001 and 2004, a study was undertaken to gather data on the level of
satisfaction of nurses with their working life. This paper reports the 2004 results on workload,
skill mix, remuneration and morale. Where applicable, the results are compared to 2001 data.
Methods: A questionnaire was mailed to 3000 Assistants-in-Nursing, Enrolled and Registered
Nurses in October 2004. All participants were members of the Queensland Nurses Union. The
results are reported in three sectors – public, private and aged care. A total of 1349 nurses
responded to the survey, a response rate of 45%.
Results: Nurses in the 2004 study believed: their workload was heavy; their skills and
experience poorly rewarded; work stress was high; morale was perceived to be poor and,
similar to 2001, deteriorating; the skill mix was often inadequate; and the majority of nurses are
unable to complete their work in the time available. Nursing morale was found to be associated
with autonomy, workplace equipment, workplace safety, teamwork, work stress, the physical
demand of nursing work, workload, rewards for skills and experience, career prospects, status
of nursing, and remuneration.
Conclusion: Overall the findings of the study are consistent with those determined by the 2001
survey.
Relevance to clinical practice. The findings of this study indicate the importance of factors such
as workplace autonomy, teamwork, the levels of workplace stress, workload and remuneration
on nursing morale. The data also indicate that workplace safety and workplace morale are
linked. These findings provide information for policy makers and nurse managers on areas that
need to be addressed to retain nurses within aged care, acute hospital and community nursing.
Number of words: 4875
Keywords: nurses, workload, skill mix, morale, Queensland, autonomy, teamwork
In 2001 and 2004 the University of Southern Queensland (USQ) in conjunction with the
Queensland Nurses’ Union (QNU) undertook a study of enrolled and registered nurse and
assistant-in-nursing members. In Queensland, registered nurses (RNs) and enrolled nurses
(ENs) are qualified to practice nursing and are licensed by the Queensland Nursing Council
(QNC), an independent registering authority responsible for the setting and maintaining of
nursing standards in the State. Although not licensed by the QNC, Assistants in Nursing (AINs)
work within a nursing model of care. These workers may also have other titles such as Personal
Care Assistants or Carers. Regardless of their title, they work under the direct or indirect
supervision of a RN.
The study sampling was confined to nurses employed in acute hospitals, community
health/domiciliary and aged care. For the purpose of the study, nurses were seen to be
employed in the public (government hospitals and community health), private (non-government
hospitals and domiciliary care) or aged care (government and non-government providers)
sectors.
The latest published Labour Workforce Survey data suggests there were 32,805 RNs and 6,491
ENs in Queensland in 2001 of which 90% are in the active nursing workforce (Australian
Institute of Health and Welfare, 2003). Based on data provided to the Australian Industrial
Relations Commission, Queensland Health employs a nursing workforce of around 20,000
(Hawksworth, 2004). The exact number of nurses in the private sector is unknown as is the
number of AINs employed in Queensland as there is no registering authority or other body that
collects these data. In 1996 the number of AINs was estimated to be 5,294 or 13% of the
nursing workforce (Harding, 1999). Currently 12% of QNU members are AINs. Approximately
70% of practicing nurses in Queensland are members of the QNU.
Australia, like other countries, is experiencing a shortage of nurses (Buchan & Calman, 2004).
Workplace Relations show Queensland, South Australia and Western Australia had shortages
against all categories of nurse specialisations (Health Workforce Australia, 2004).
Shortages of nurses have implications in workforce dynamics, staff morale, and patient
outcomes. Recent research has linked low staffing levels with poor patient welfare and longer
patient stay (Needlemann et al., 2002; Stanton, 2004). Staff-to-patient ratios are used to
demonstrate how understaffing and workload have an adverse affect on patient welfare
(Buchan, 2004). Aiken et al. (2002) calculated that for each additional patient per nurse over a
4:1 ratio, there was a seven percent increase in the likelihood of death in surgical patients.
Furthermore, those patients in hospitals with the highest patient-to-nurse ratio (eight patients
per nurse) had a 31% greater risk of dying than those in hospitals with four patients per
registered nurse. The Institute for Health and Socio-Economic Policy projects annual savings of
about US$2 billion a year for California hospitals just from the shorter patient stays that result
from lower patient to RN ratios (The Department for Professional Employees AFL-CIO, 2004).
Low staff to patient ratios have an adverse effect on nurses’ health and morale (L. Aiken et al.,
2002). In Aiken et al’s (2002) study, the authors found that each additional patient per nurse
was associated with a 23% increase in the odds of nurse burnout and a 15% increase in the
odds of job dissatisfaction. As demonstrated in a study in Australia, staff numbers are inevitably
linked to workload (Clare et al. 2002) Day (2005). found that nurses’ ability to cope (defined as
staff, workloads) was associated with morale. Morale, job satisfaction, and health all have major
implications to turnover and retention (Aiken et al., 2001).
The results of the 2001 study have been previously published (Hegney et al., 2003a; Hegney et
al., 2003b; Parker et al., 2003). This paper reports the major findings of the 2004 study as well
as providing data on major changes between the 2001 and 2004 studies.
Aim
The aim of the 2001 and 2004 studies was to identify the factors and the change in those
factors that impact upon nursing work in each of the three main nursing employment sectors in
Queensland (aged care, public and private) and to use the results study to inform strategic
planning of the QNU.
Research Questions
There were three research questions for the 2004 study. These were:
1. From the perspective of members of the Queensland Nurses’ Union, what are the
factors that impact upon nursing work in Queensland?
2. How satisfied are members of the Queensland Nurses’ Union with nursing work in
Queensland?
3. Have perceptions of and satisfaction with nursing work changed during the period 2001
to 2004?
Procedure
The study was approved by the Human Research and Ethics Committee of the University of
Southern Queensland. In order to comply with the Ethical Principles and the Queensland and
Australian Governments Privacy Guidelines and Legislation, the questionnaires (including the
reminder) were posted from the QNU to the participants. The research team only had access to
the code provided by the QNU, not the names or addresses of the membership. Any material
returned because of postal delivery issues were returned to the QNU. The participants were
provided with a reply-paid envelope in which to return the questionnaire which came direct to
the research team. At no time has the research team had access to the names and addresses
of the participants. Similarly, at no time has the QNU access to any identifiable data (only
Once the codes had been generated by the QNU, a database of coded numbers was sent to
the research team. From these, using random numbers, 1000 participants were randomly
selected from each of the three sectors, resulting in a total sample of 3,000. The survey, along
with a Plain Language Statement and Reply-Paid envelope was mailed to these participants by
the QNU. Three weeks after the first mail out, a reminder package was sent to
non-respondents.
Sample and Sampling Design
Of the 3000 participants (1000 from each sector) invited to participate in the 2004 survey, 1349
responded; representing an overall response rate of 45%. The estimated response rates and
number of respondents from each sector (after adjusting for discrepancies in sector
membership between the QNU database and survey responses, and after allowing for
respondents who were no longer working in Queensland) were:
• 43% (n=428) aged care sector
• 44% (n=439) public sector
• 48% (n=475) private sector
• Of the 1349 participants in the 2004 study, 1342 provided information that allowed their
allocation to a sector. A total of 1306 (97%) were in paid employment in nursing in
Queensland at the time of the study.
The Survey Instrument
The questionnaire was based on that used in the 2001 survey of QNU members. Only minor
changes were incorporated, since the instrument had been validated in 2001 and a comparison
of changes in responses between 2001 and 2004 was of particular interest. Piloting of the
instrument was unwarranted because the data collection process was unchanged from that
used for the 2001 study. Items modified or added to the 2001 questionnaire procedure,
The questionnaire (called ‘Your Work, Your Time, Your Life’) contained 77 questions divided
into eight sections. The sections reported in this paper were:
• Section 1 – Your Current Nursing Employment – asked eight questions relating to
current employment, place of main employment and if they were working for a nursing
agency.
• .Section 3 – Your Working Conditions – contained 21 questions that sought information
on their ability to complete work within the paid time available, skill mix, workload,
rostering practices, workplace violence, and replacement of staff. This section contained
one open-ended question on workload issues.
• Section 6 – Your Experience in Nursing – contained eight questions that gathered data
on the nurses’ perceptions of nursing work as well as the length of time worked in
nursing, the number of breaks from nursing and the reason/s for these breaks.
Limitations
To assess the possibility of non-response bias, checks where made against the QNU database
in each sector regarding the distributions of gender, age and job designation. No significant
difference exists between the gender distribution of the respondents and the gender distribution
of the QNU database within each sector. Similarly, there were no significant differences in the
distribution of job designation when compared to the database within each sector. Concerns
exist, however, regarding bias in the age distribution of respondents in the survey compared to
the QNU database. In all three sectors there was evidence that older nurses were relatively
over-represented. However, this issue is clouded by the QNU database being incomplete – the
ages of about 20% of members are unknown. The effect of this apparent bias was assessed to
be insufficient to make a substantive impact upon the findings of the study.
Unlike in 2001, when data were manually entered, the questionnaires were formatted to allow
automatic scanning and data entry using Teleform (Verity Inc. Sunnyvale, California). While
quantitative data were scanned in, all qualitative data were typed in manually.
Quantitative data
The data were extensively screened and anomalies logged, checked and corrected where
appropriate. Comparisons between sectors in the 2004 survey have been made on an
item-by-item basis using descriptive and inferential statistical tools as appropriate to the scale of
measurement – contingency tables, bar charts and chi-squared testing for categorical data,
Kruskall-Wallis and chi-squared testing for ordinal data, and means and standard deviations, F
and t procedures for interval data.
Given the large number of comparisons of interest within the 2004 study and between the 2001
and 2004 studies, measures have been taken to protect against false positives in reporting the
results. These include a log linear analysis encompassing both the sector and year factors to
filter out non-significant effects overall prior to a sector-by-sector analysis of categorical or
ordinal data
Only inferences supported at the 1% level of significance are reported, except where more than
one sector exhibits a similar trend or where there is a prior expectation of an effect. In these
cases the threshold has been lowered to the 5% level.
Qualitative data
There were three major qualitative data questions in the survey. The data from each returned
questionnaire were typed verbatim into a word processing file. Analysis for each question was
carried out separately for each of the sectors. Thus, for each question there were three files. A
• studying each transcript individually as well as by sector to give a sense of the whole,
• identifying, themes and categories that arose from each question and from each sector,
• developing summative themes and research findings from this analysis.
RESULTS
Demographics
Approximately eight percent of the nurses in the study were male. The mean age of the
participants was 44.1 years, which reflects the ageing nursing workforce in Australia. This is an
increase from a mean age of 43.4 years in 2001. There were differences in the mean age of
nurses across the sectors, with nurses in the aged care sector having a higher mean age (49.7
years) than nurses in the public (42.8) and private (43.6) sectors. There were a total of 172
assistants in nursing, 157 enrolled and 913 registered nurses in the study. Because of the
small numbers of assistants in nursing employed in the private and public acute sectors,
analysis of differences between levels of nurses was not possible.
Workload
Respondents were asked to indicate if they were able to complete their work to their satisfaction
in the paid time available. Highly significant differences differences exist among the sectors in
both 2001 (χ2 = 85.215; 12: P<.001) and 2004 (χ2 = 142.499: 16: P<.001; see Table 1). In 2004
there is little difference in the average response of the nurses in the public and private sectors.
However, nurses in the aged care sector on average find it relatively more difficult than public or
private sector nurses to complete their job to their satisfaction (χ2 = 75.91: 4: P<.001). In the
aged care sector, but not in the other two sectors, there is a significant evidence of a change
between 2001 (and 2004 (p = 0.014). Although the average response is still significantly inferior
to that of the nurses in the other sectors, a significant improvement on average for aged care
nurse is indicated between 2001 and 2004. This difference persists in this sector for RNs, ENs
INSERT TABLE 1 HERE
Sufficient staff employed in the work unit
There is a highly significant difference (2001; χ2 = 106.532; 8: P<.001; 2004 χ2 = 73.357; 4;
P<.001) across the sectors in the proportion of nurses who believe sufficient staff were
employed over the last six months to meet patient/client/resident needs (see Table 2). The
major source of this difference is the relatively high proportion of aged care nurses who believe
that there is ‘never’ or ‘very seldom’ sufficient staff to meet needs. Between 2001 and 2004 an
improvement in average response to this issue has occurred in the public (χ2 = 13.861; 4:
P=.008) sectors. No such change is apparent in the aged care or private sectors.
INSERT TABLE 2 HERE
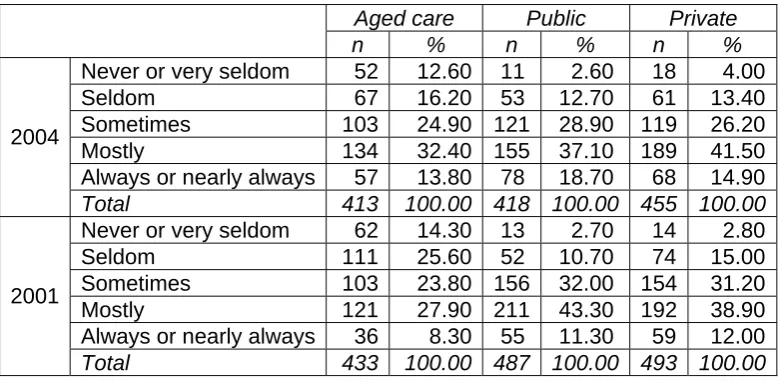
Skill mix
Using a five point Likert scale, the respondents were asked to indicate if there was ‘always or
nearly always, mostly, sometimes, seldom, or never or very seldom’ adequate skill mix to meet
patient/client/resident needs. The data in Table 3 reveal that in both 2001 and 2004 there is a
highly significant difference across sectors in the proportion of nurses who believe skill mix is
adequate (2001; χ2 = 102.669; 8: P<.001; 2004 χ2 = 50.486; 4; P<.001) with nurses in the aged
care sector most likely to indicate an inadequacy. There is good evidence in the aged care
sector (χ2 = 16.695; 8; P = 0.002) and weaker evidence in the public sector (χ2 = 11.593; 8; P =
0.018) of differences between 2001 and 2004. In the aged care sector, on average, there is
significant evidence of an improvement in the perceived adequacy of skill mix support. In the
public sector, the main reason for the difference between 2001 and 2004 is the relatively higher
response of ‘always or nearly always’ to this question. However, in terms of average response,
INSERT TABLE 3 HERE
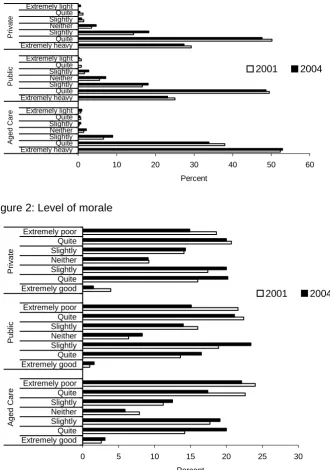
Workload
Nurses were asked to specify their perceptions of their workload from options ranging from
‘workload is heavy’ to ‘workload is light’ (see Figure 1). There is very strong evidence (2001; χ2
= 103.215; 12: P<.001; 2004 χ2 = 118.603; 4; P<.001) of a difference across the sectors with
respect to perceived workload in nursing in both 2001 and in 2004. In 2004 the major reason for
this difference is the relatively high percentage of aged care nurses reporting an extremely
heavy workload compared to the other two sectors. On average, aged care nurses report a
substantially heavier workload than private sector nurses (2001; χ2 = 62.053; 6: P<.001; 2004 χ2
= 65.647; 6; P<.001), whose average response does not differ significantly from public sector
nurses. There is no indication of a change between 2001 and 2004 in any sector.
INSERT FIGURE 1 HERE
In addition to the quantitative data, the 547 respondents provided comments on workload and
skill mix. While at least 50% of the nurses in all sectors noted that workload issues were
reported (either formally through committees or informally through nurse managers/facility
managers), at least 20% in each sector believed that ‘nothing was done’. For example:
‘There is a workload committee – however we never hear from them and they never respond to
issues that occur’.
‘Workload issues are ignored by management’.
‘Immediate discussion with CNC in relation to inadequate staffing levels. They do try and get
extra staff from other wards or agency staff, otherwise no new acute admissions to the ward’.
‘Most requests for more staff are approved as long as rostering is viable and skill mix is
appropriate’.
These comments reflected those provided by the respondents in the two final questions. These
open-ended questions asked what the nurses believed should be the focus of the QNU for the
next 12 months as well as also providing some white space to allow nurses to provide
unsolicited comments in general about their nursing work. In the first question, issues around
workload, staffing, skill mix was the second ranked theme (aged care 37%; private 48% and
public 51%) and in the latter question, workload issues were the most cited issues raised (aged
care, 47%, private 79%, public 34%). For example:
‘Maybe the QNU could focus more on getting more nurses on the floor and less on increasing
wages. If there were more people to carry the workload job satisfaction would be a lot higher.
High wages do not really compensate for lack of job satisfaction and we don’t realistically
appear to be able to have both. MAYBE THE QNU COULD BE THE FIRST UNION TO PUSH
FOR HIGHER JOB SATISFACTION INSTEAD OF HIGHER WAGES’ [respondent’s
emphasis].
‘… the acuity rate has increased, patients are sicker, requiring more one on one within the ward.
Standards of care hence decrease, leaving nurses feeling frustrated with the care they can
‘… dangerous overcrowding of our [name of unit] due to budgetary shuffling are leaving us
working in dangerous overcrowded and overwhelming conditions. Effect on morale is high with
staff leaving, which compounds the problem’.
Morale
Approximately 40% of nurses in all sectors believed that morale was ‘extremely or quite’ poor.
There were no differences across sectors and no changes in perceptions of staff morale
between 2001 and 2004 (see Figure 2). Respondents were more likely to perceive that morale
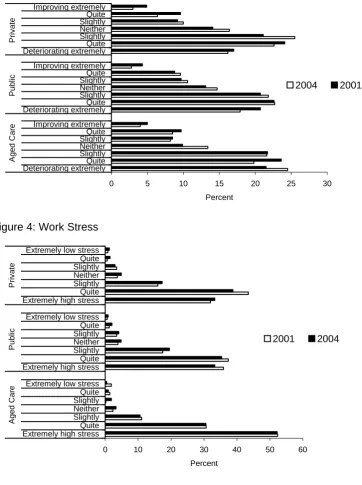
was deteriorating than improving. Again there were no significant differences across the sectors
or between 2001 and 2004 (p>0.05 in all cases) (see Figure 3).
Across all sectors in both 2001 and 2004, while there was no significant difference in the
perceived level of morale between male and female nurses in any sector or year, staff morale is
significantly associated with: how autonomy was encouraged, workplace equipment levels,
perceptions of the safety of the workplace, level of teamwork and support from colleagues,
deteriorating staff morale, work stress, the physical demand of nursing work, workload, rewards
for skills and experience, career prospects, status of career, nursing work valued in community
and in health sector, and remuneration (r2 > 10%, p < 0.001 in all cases).
INSERT FIGURES 2 AND 3 HERE
Work Stress
This question asked respondents to indicate if work stress was ‘high’ or ‘low’. There is strong
evidence (2001; χ2 = 62.529; 12: P<.001; 2004 χ2 = 51.127; 12; P<.001) of a difference across
the sectors, with nurses in the aged care sector reporting relatively higher levels of extremely
public and 72% private sectors) reported ‘extreme or quite’ high work stress. There was no
change in levels of reported work stress between 2001 and 2004.
INSERT FIGURE 4 HERE
Remuneration
There is a strong difference across the sectors with respect to the perception of adequacy of
pay (2001; χ2 = 64.532; 12: P<.001; 2004 χ2 = 70.975; 12; P<.001). While nurses in the aged
care sector were more likely to believe that their pay rate was ‘extremely or quite’ poor (46%),
nurses in the other sectors were similarly dissatisfied with their remuneration (25% public and
38% private sectors) (see Figure 5).
INSERT FIGURE 5 HERE
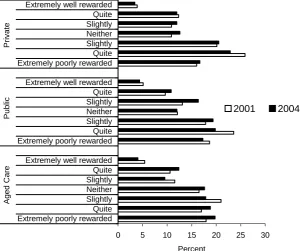
Rewards for skills and experience
Over one-third of nurses in the study believed that they were ‘extremely or quite’ poorly
rewarded for the skills and experience they bought to their workplace (aged care 39%, public
37% and private 40%). There was no significant difference across the sectors or between the
2001 and 2004 data (p>0.05 in all cases).
INSERT FIGURE 6 HERE
Remuneration and rewards for skills and experience were themes within the open-ended final
questions. In particular, 79% of nurses in the private and public sectors, and 81% of nurses in
the aged care sector believed that remuneration and conditions should be a priority of focus of
the QNU. As one respondent’s comments are indicative of the general feelings about pay:
In the private and aged care sectors, where nurses are paid less than nurses in the public
sector, the respondents believed that parity of wages should be achieved as soon as possible.
As one respondent noted:
‘Why is there a difference [in pay] between the private and public sectors?’
Another person noted:
‘… people working in our local citrus industry packing citrus have a higher rate of pay than
nurses’.
One nurse’s comment summed up the feelings about remuneration.
‘I love my job, and I enjoy going to work … but that does not mean I think I am adequately paid.
We should be ashamed of the hourly rate we get, and make more demands from private
institutions and government’.
Within the qualitative data there was a theme that we called ‘images of nursing’. These images
could be linked with morale. While some of the images were positive, others were negative.
Examples are:
‘When I first started my nursing career I felt so proud to put on my uniform. The prestige that
went with the job lifted my self-confidence greatly. Now I have a job to get myself to put on the
uniform as it makes me a target for abuse, harassment, workplace bullying, very little job
‘I love my job and I love to help my clients. Realistically there are never enough hours in the
day, but I find it personally satisfying to stay behind and make sure my job is done and my
clients are maintained’.
In many of the comments, both positive and negative, it was apparent that how local
management dealt with the respondents influenced how they felt about nursing work. Many
nurses believed that decisions driven by cost control were detrimental to the care nurses could
provide to patients:
‘Nurses are fed up. No respect working, working to care for people and they [management] just
cut costs. It’s all money in the private and public sectors’.
‘… most struggles are put down to a lack of funding but genuine encouragement and
recognition doesn’t always cost money’.
DISCUSSION
Job satisfaction and in particular job dissatisfaction has many ramifications including quality of
care and turnover. Reasons for dissatisfaction are numerous and this study has defined some
of them. The implications of the findings will now be discussed.
Workload
In response to two separate questions nurses recorded their opinions on workload. In excess of
90% of nurses graded their workload as heavy. In addition they noted that they cannot complete
their work to their own satisfaction in the allotted time. Although it is encouraging that some
improvement has been seen in the aged care sector since 2001, this issue is still greatest in this
the allotted time. These data are also in accord with recent research undertaken in three
hospitals in South East Queensland (Day, 2005).
In our study this problem was worst in the aged care nursing workforce where a third of nurses
consider that seldom or never were they able to complete their work in the paid time available
compared to less than 15% of nurses in the other sectors. Workload has been cited as the
principle cause for nurses considering leaving their workplace and their profession (Best
Practice Australia Pty Ltd, 2003). Judged by the volume of unsolicited text comments workload
was certainly of prime importance to the nurses in this study.
Nurses were not asked if their success or failure to complete work in the available time was
directly attributable to staff numbers or skill mix. However, from proffered comments and
responses to other questions it is reasonable to assume this was the case. Aged care nurses
were far more likely to indicate that staff numbers are insufficient to meet patient needs than
were nurses in the other two sectors. However, in none of the sectors did more than 40% of
nurses consider that staff numbers were adequate. This is a critical observation for both nurses
and client safety (Aiken et al 2002). It is also worth noting that nurses are somewhat prepared to
accept a heavy workload. This is borne out by the fact that the proportion of nurses who
considered staff to be insufficient was over 10% greater than the proportion who reported that
they were unable to finish their work.
Buchan (2004) noted in a report to the Royal College of Nursing the traditional views of staff
numbers being determined by local management is being challenged by the increasing number
of reports on patient welfare and nurse to patient ratios. In general higher staff-to-patient ratios
result in not only improvements in medical outcomes but also large reductions in associated
medical costs such as time in hospital, readmissions, complications and so forth. No detailed
Skill mix
In general, a richer mix of staff improves patient outcomes although relationship between
staffing levels, mix and outcomes is complex (Buchan, 2004). Skill mix is a major identified
factor affecting the nursing environments in Queensland. Only half of all nurses perceived skill
mix to be adequate at a level more than ‘sometimes’ Again aged care respondents expressed
concern, although as with the question related to the number of staff employed in the ward/unit,
there was a trend for an improvement since 2001. In all sectors adequacy of skill mix was
qualified by the nurses as being largely a case of too few experienced nurses and too many
inexperienced ones. Nearly half of the aged care nurses indicated that insufficient funding was a
contributory factor. In comparison private and public sector nurses were much more likely to see
the numbers of casuals, agency and relief staff as factors influencing skill mix.
These issues are of major concern to the respondents as illustrated by large numbers who
suggested that workload issues should be a QNU focus. Workload and related issues such as
understaffing or appropriate staffing can cause turnover which then compounds the problem.
Resolving the issue of understaffing is not a case of simply employing more staff. Rather, it is
influenced by the availability and cost of a larger workforce.
Morale and work stress
In 2001 morale was low and this has not improved in the 2004 study. A workforce where 40% of
nurses consider morale to be ‘poor’ and ‘deteriorating’ does not bode well for the profession.
Nor does it bode well for patient care. Work stress, a major factor influencing morale, is
extremely high especially in the aged care sector.
Morale is affected by response of management to issues. In this study, while some nurses
recognised that their workload concerns were addressed, an equal number of nurses believed
that nothing was done when workload issues were raised. Similar results were found by Day
respond to their concerns and ideas. The results suggest, therefore, that there needs to be an
improvement in line management attitudes with a greater valuing of nurses.
Remuneration
Remuneration is often touted as the principal reason for job dissatisfaction and certainly is
identified by nurses as being a major reason for considering leaving a job (Best Practice
Australia Pty Ltd, 2003). In this study 50% of nurses in both the private and aged care sectors
considered their wages to be poor. This was 15% higher than in the public sector where 50% of
nurses believed their pay was adequate or better. However, it is extremely interesting to note
that in the few studies that have been undertaken with nurses who have actually left their
employment, that remuneration was not given as the main reason for leaving (Nursing and
Health Services Research Consortium 2000, 2001). Recent studies support the view that
remuneration is not the primary reason that nurses leave their workplace (Cowin & Jacobsson,
2003a; Day, 2005).
CONCLUSION
This study presents the findings of two surveys of nurses of the Queensland Nurses’ Union. In
both 2001 and 2004, staffing numbers and skill mix, factors that have an impact on patient
safety, length of stay and patient outcomes, were shown to have a major effect on staff morale
of nurses in Queensland.
It is apparent that from a workforce perspective, if employers are to retain nurses within the
nursing workforce, that these factors must be addressed. If they are not addressed, not only will
the nursing workforce continue to exhibit high turnover, but it is possible that there will be
increasing litigation against employers of nurses who continue to ignore the international
REFERENCES
Aiken LH, Clarke SP, Sloane DM, Sochalski JA, Busse ., Clarke, H, et al. (2001). Nurses'
reports on hospital care in five countries. Health Affairs, The Policy Journal of the Health
Sphere, 20, 43 -53.
Aiken L, Clarke S, Slone D, Sochalski J, & Silber J (2002). Hospital nurse staffing and patient
mortality, nurse burnout, and job dissatisfaction. Journal of the American Medical
Association (JAMA), 288, 1987-1993.
Australian Institute of Health and Welfare. (2003). Nursing Labour Worksforce 2002 (Vol. AIHW
cat. no. HWL 29.). Canberra: Australian Institute of Health and Welfare, Canberra.
Best Practice Australia Pty Ltd. (2003). Benchmarking Study into Nursing Attraction and
Retention, Sydney.
Buchan J (2004). A Certain Ratio? Minimum Staffing Ratios in Nursing: Royal College of
Nursing, London.
Buchan J, & Calman L (2004). The Global Shortage of Registered Nurses: An Overview of
Issues and Actions. International Council of Nurses, Geneva.
Clare J, White J, Edwards H, & van Loon A (2002). Learning Outcomes and Curriculum
Development in Major Disciplines: Nursing. Final Report for the Australian Universities
Teaching Committee. School of Nursing & Midwifery, Flinders University, Adelaide.
Cowin L, & Jacobsson D (2003). Addressing Australia’s nursing shortage: is the gap widening
between workforce recommendations and the workplace? Collegian, 10, 20 - 24.
Day G (2005). Nurse Morale plummets in Queensland. PhD, University of New England,
Armidale.
Harding J (1999). Trends in Queensland and Australian Nurse Statistics. Paper presented at the
QNU Annual Conference, Brisbane.
Health Workforce Australia. (2004). The Australian Nursing Workforce. Available at:
http://www.healthworkforce.health.nsw.gov.au/amwac/info.html (accessed 11 November
2005).
Hegney D, Plank A, & Parker V (2003a). Nursing workloads: the results of a study of
Queensland Nurses. Journal of Nursing Management, 11, 307 - 314.
Hegney D, Plank A, & Parker V (2003b). Workplace violence in nursing in Queensland
Australia: A self-reported study. International Journal of Nursing Practice, 9, 261 - 268.
Needlemann J, Buerhaus P, Mattke S, Steward M, & Zelevinsky K (2002). Nurse-staffing levels
and the quality of care in hospitals. New England Journal of Medicine, 346, 1715 - 1722.
Nursing and Health Services Research Consortium 2000. (2001). New South Wales Nursing
Workforce Research Project, for the New South Wales Health Department Nursing
Branch, Sydney. Unpublished Report.
Parker V, Plank A, & Hegney D (2003). Adequacy of support for new graduates during their
transition into the workplace: a Queensland, Australia study. International Journal of
Nursing Practice., 9, 300-305.
Stanton M (2004). Hospital nurse staffing and quality of care. Maryland. Agency for Health
Research and Policy, Maryland.
The Department for Professional Employees AFL-CIO. (2004). The Costs and Benefits of Safe
Staffing Ratios. Available at:
http://www.dpeaflcio.org/policy/factsheets/fs_2004_staffratio.htm (accessed 8 November
2005)
Acknowledgements:
We wish to thank the QNU for funds for both the 2001 and 2004 studies and the QNU members
Table 1: Ability to complete work in the paid time available
Aged care Public Private
n % n % n %
Never or very seldom 67 16.30 19 4.50 19 4.10
Seldom 75 18.20 40 9.40 53 11.60
Sometimes 82 19.90 109 25.70 112 24.50
Mostly 134 32.50 180 42.50 198 43.20
Always or nearly always 54 13.10 76 17.90 76 16.60
2004
Total 412 100.00 424 100.00 458 100.00
Never or very seldom 79 18.20 21 4.30 12 2.40
Seldom 91 21.00 61 12.40 57 11.50
Sometimes 115 26.60 140 28.50 154 31.20
Mostly 102 23.60 194 39.50 208 42.10
Always or nearly always 46 10.60 75 15.30 63 12.80
2001
[image:22.595.60.454.340.526.2]Total 433 100.00 491 100.00 494 100.00
Table 2: Sufficient staff employed in the work unit
Aged care Public Private
n % n % n %
Never or very seldom 88 21.40 34 8.10 35 7.70
Seldom 96 23.30 66 15.80 96 21.00
Sometimes 74 18.00 119 28.50 136 29.80
Mostly 118 28.60 149 35.60 161 35.20
Always or nearly always 36 8.70 50 12.00 29 6.30
2004
Total 412 100.00 418 100.00 457 100.00
Never or very seldom 112 25.80 45 9.20 30 6.10
Seldom 121 27.90 112 23.00 119 24.20
Sometimes 76 17.50 145 29.80 156 31.70
Mostly 101 23.30 151 31.00 155 31.50
Always or nearly always 24 5.50 34 7.00 32 6.50
2001
Total 434 100.00 487 100.00 492 100.00
Table 3: Perceptions of the adequacy of skill mix
Aged care Public Private
n % n % n %
Never or very seldom 52 12.60 11 2.60 18 4.00
Seldom 67 16.20 53 12.70 61 13.40
Sometimes 103 24.90 121 28.90 119 26.20
Mostly 134 32.40 155 37.10 189 41.50
Always or nearly always 57 13.80 78 18.70 68 14.90
2004
Total 413 100.00 418 100.00 455 100.00
Never or very seldom 62 14.30 13 2.70 14 2.80
Seldom 111 25.60 52 10.70 74 15.00
Sometimes 103 23.80 156 32.00 154 31.20
Mostly 121 27.90 211 43.30 192 38.90
Always or nearly always 36 8.30 55 11.30 59 12.00
2001
[image:22.595.60.451.561.752.2]Figure 1: Perceptions of workload being heavy or light
0 10 20 30 40 50 60
Extremely heavyQuite
SlightlyNeither
SlightlyQuite
Extremely light
Extremely heavyQuite
SlightlyNeither
SlightlyQuite
Extremely light
Extremely heavyQuite
[image:23.595.74.405.99.570.2]SlightlyNeither SlightlyQuite Extremely light Aged Care Public Private Percent 2001 2004
Figure 2: Level of morale
0 5 10 15 20 25 30
Figure 3: Morale improving or deteriorating
0 5 10 15 20 25 30
[image:24.595.73.436.93.579.2]Deteriorating extremelyQuite Slightly Neither SlightlyQuite Improving extremely Deteriorating extremelyQuite Slightly Neither SlightlyQuite Improving extremely Deteriorating extremely Quite Slightly Neither SlightlyQuite Improving extremely A ged Care P ubl ic P ri v at e Percent 2004 2001
Figure 4: Work Stress
0 10 20 30 40 50 60
Extremely high stress Quite Slightly Neither Slightly Quite Extremely low stress Extremely high stress Quite Slightly Neither Slightly Quite Extremely low stress Extremely high stress Quite Slightly Neither Slightly Quite Extremely low stress
Figure 5: Perceptions of remuneration by sector
0 5 10 15 20 25 30
Extremely goodQuite
Slightly
NeitherSlightly
Quite Extremely poor
Extremely goodQuite
Slightly
NeitherSlightly
Quite Extremely poor
Extremely goodQuite
Slightly NeitherSlightly Quite Extremely poor A ged C a re P ubi c P ri v ate Percent 2001 2004
Figure 6: Perceptions of adequate reward for skills and experience
0 5 10 15 20 25 30
Extremely poorly rewarded Quite Slightly Neither Slightly Quite Extremely well rewarded Extremely poorly rewarded Quite Slightly Neither Slightly Quite Extremely well rewarded Extremely poorly rewarded Quite Slightly Neither Slightly Quite Extremely well rewarded
[image:25.595.78.379.341.592.2]