University of Southern Queensland Faculty of Engineering and Surveying
The Effect of the 50km/h
Implementation on Local Streets in
Toowoomba
A dissertation submitted by
Mr Joshua Edward Allan Goodall
In fulfilment of the requirements of
Bachelor of Engineering (Civil)
ABSTRACT
University of Southern Queensland Faculty of Engineering and Surveying
ENG4111 & ENG4112 Research Project
Limitations of Use
The Council of the University of Southern Queensland, its Faculty of Engineering and Surveying, and the staff of the University of Southern Queensland, do not accept any responsibility for the truth, accuracy or completeness of material contained within or associated with this dissertation.
Persons using all or part of this material do so at their own risk, and not at the risk of the Council of the University of Southern Queensland, its Faculty of Engineering and Surveying or the staff of the University of Southern Queensland.
This dissertation reports an educational exercise and ha no purpose or validity beyond this exercise. The sole purpose of the course pair entitled “Research Project” is to contribute to the overall education within the student’s chosen degree program. This document, the associated hardware, software, drawings, and other material set out in the associated appendices should not be used for any other purpose: if they are so used, it is entirely at the risk of the user.
Prof Frank Bullen
Dean
CANDIDATES CERTIFICATION
I certify that the ideas, designs and experimental work, results, analysis and conclusions set out in this dissertation are entirely my own efforts, except where otherwise indicated and acknowledged.
I further certify that the work in original and has not bee previously submitted for assessment in any other course or institution, except where specifically stated.
Joshua Edward Allan Goodall
Student Number: Q99220861
____________________________
Signature
ACKNOWLEDGEMENTS
This research was carried out under the principal supervision of Trevor Drysdale.
Appreciation is also due to:
Greg Smith
Co-ordinator Traffic Signals & Road Lighting Civil Assets Branch
Toowoomba Regional Council
Donna McDonald Data Analysis Unit
Land Transport and Safety Queensland Transport
Senior Sargent Bradley Clark Officer in Charge
Toowoomba District Traffic Branch
Queensland Police Service
TABLE OF CONTENTS
Contents Page
TITLE PAGE i
ABSTRACT ii
DISCLAIMER PAGE iii
CANDIDATE CERTIFICATION iv
ACKNOWLEDGEMENTS v
TABLE OF CONTENTS vi
LIST OF FIGURES ix
LIST OF TABLES x
LIST OF APPENDICES xi
ABBREVIATIONS xii
CHAPTER 1 - INTRODUCTION
1.1 Outline of the Study 1
1.2 Introduction 1
1.3 The Problem 2
1.4 Research Objectives 2
1.5 Conclusions: Chapter 1 2
CHAPTER 2 – LITERATURE REVIEW
2.1 Introduction 3
2.2 Overview of Toowoomba City 3
2.2.1 Brief History of Toowoomba 4
2.2.2 Roads in Toowoomba 4
2.3 Road Crashes 5
2.3.1 Crash classification 5
2.3.2 Accident causation factors 6
2.3.3 Limitations of reported crash data 7
2.4 50km/h streets 9
2.4.1 Road Hierarchies 9
2.5 Alternatives to lowering speed limit 13
2.6 Conclusions: Chapter 2 15
CHAPTER 3 – RESEARCH DESIGN AND METHODOLOGY
3.1 Introduction 16
3.2 Data 16
3.2.1 Crash Data 16
3.2.2 Speed Infringement Data 17
3.3 Methodology 17
3.3.1 Crash Data 17
3.3.2 Speed Infringement Data 18
3.3.3 Factors Influencing the Accuracy of Data 19
3.4 Conclusions: Chapter 3 19
CHAPTER 4 – DATA ANALYSIS
4.1 Introduction 20
4.2 Accidents occurring on local streets 20
4.3 Fatalities on local streets 21
4.4 Casualty crashes on local streets in Toowoomba 23
4.5 Casualty crashes to RUM codes 23
4.5.1 RUM Codes 00 – 09 Pedestrian 24
4.5.2 RUM Codes 10 – 19 Vehicles from adjacent directions
intersections only 24
4.5.3 RUM Codes 20 – 29 Vehicles from opposing directions 25 4.5.4 RUM Codes 30 – 39 Vehicles from the same direction 26
4.5.5 RUM Codes 40 – 49 Manoeuvring 26
4.5.6 RUM Codes 50 – 59 Overtaking 27
4.6.3 Neil street 30
4.6.4 Hurstway court 30
4.6.5 McGregor street 31
4.6.6 Curzon street 31
4.6.7 Mort street 32
4.6.8 Pechey street 33
4.7 Speed infringement data 34
4.8 Maps 35
4.9 Conclusions: Chapter 4 36
CHAPTER 5 – CONCLUSIONS
5.1 Introduction 37
5.2 Discussion 37
5.3 Further research and recommendations 37
5.4 Summary of Chapter 5 38
LIST OF FIGURES
Number Title Page
2.1 Population growth in Toowoomba 3
2.2 The 3 factors that contribute to road crashes 6
2.3 Stopping distances 11
4.1 Raw Data showing accidents occurring
on 50km/h streets in Toowoomba 20
4.2 Accidents including increase in
population and car registration 21
4.3 Fatalities occurring on 50km/h local streets in Toowoomba 21 4.4 Casualty crashes in Toowomba local streets factoring for
car registration and population growth 23
4.5 Intersection where the giveway sign on
the left may be easily missed 24
4.6 Example of trees reducing visability on a local street 25
4.7 Toowoomba fog 26
4.8 Corner of Russel and Neil streets 29
4.9 McGregor street 31
4.10 Curzon street 31
4.11 Intersection of Curzon and Ipswich streets 32
4.12 Tree lined Mort street 32
LIST OF TABLES
Number Title Page
2.1 Impact of 50km/h speed limit on
Australian States & Territories 12
2.2 Alternatives to Lowering the Speed Limit 14
4.2 Fatalities on Toowoomba local streets
according to RUM code 22
LIST OF APPENDICES
Appendix A Specification Page 40
Appendix B Risk Assessment Page 41
Appendix C Sample Data Received From Toowoomba Regional
Council Page 44
Appendix D Toowoomba City Speed Zonal Plan Page 46 Appendix E Speed Infringement Data from Queensland Transport Page 47
Appendix F Coding of Road User Movements Page 48
Appendix G Rum Code Analysis Page 49
ABBREVIATIONS
The following abbreviations have been used throughout the text & list of references: Km/h = Kilometres per hour
CHAPTER 1
INTRODUCTION
1.1 Outline of the Study
The first chapter presents an overview of the intentions of this study. (See Specification Appendix A)
The second chapter of this dissertation consists of a literature review of previous studies into road crash, crash types, crash casual factors and road hierarchies. Other background information discusses Toowoomba City with its boundaries, population and history. Information relevant to Toowoomba road crashes is also included.
The third chapter will explain how the project aims to achieve its results through refining raw crash data from the Toowoomba Regional Council and examining speed infringement data.
The fourth chapter discusses how these data sets were analysed, how crashes were plotted on maps and other factors that contribute to casualty crashes on local roads. Risk Assessment has been conducted (Appendix B) before embarking on the site investigations discussed in this chapter.
The fifth chapter will conclude with findings and recommendations of how this data may be transferred to arterial roads.
1.2
Introduction
Local, state and national governments are constantly striving for ways to lower number and severity of road crashes. The implementation of the 50km/h streets has been designed with this in mind. However, unless one closely examines the
1.3 The Problem
Despite the best efforts of government bodies – including police enforcement and extensive marketing campaigns - lives are still being lost on Queensland roads. The extent to which this is occurring in Toowoomba local roads will be examined in Chapter 3. There is a limit to the resources that will be invested by government and private organisations into lowering the road toll. Therefore it is essential that the most cost effective strategies are chosen. It is imperative that this strategy is critically evaluated in order to ensure the most effective methods of reducing the Toowoomba road toll are being implemented.
1.4 Research Objectives
The aim of this research is to firstly identify and compare the number of road crashes which have occurred in local streets both before and after the implementation of the 50km/h speed limit.
To do this road crashes recorded in the Toowoomba Regional Council data will be examined to determine whether they occurred in local 50km/h streets or at
intersections between local and other streets.
1.5
Conclusions: Chapter 1
The intentions of this dissertation are to critically evaluate the effectiveness of the implementations of the 50kmh speed limit in Toowoomba. This will be done through data analysis and by first examining literature to study the foundation laid by previous
CHAPTER 2
LITERATURE REVIEW
2.1
Introduction
This chapter will review literature to establish the need for the implementation of the 50km/h speed limit on local streets in Toowoomba.
After giving an overview of Toowoomba with its history and roads it will discuss road crashes, their classification, causes and limitations on their reporting. The history of the implementation of the 50km/h speed limit on local streets will be discussed at a wider Queensland and local level. The effectiveness of this implementation in other areas will be considered along with alternative measures to lower the number of casualty crashes. A casualty crash is any road accident where people are injured or killed.
2.2 Overview of Toowoomba City
Toowoomba city is located atop the Great Dividing Range more than 700m above sea level and approximately 130kms west of Queensland’s capital city Brisbane. Its latitude is 27 33’S 151 57’E. It has reputation as “The Garden City” with more than 240 public parks and gardens and more than 6,300 hectares of open space.
(Toowoomba Now, 2008.)
[image:15.612.183.419.537.692.2]Toowoomba has a population of approximately 96 226 and has experienced growth of between 1-2% each year since 2000. (See figure 2.1) (DLGSR 2007)
This makes Toowoomba Australia’s second largest inland city, second only to the nation’s capital Canberra.
There were 66242 motor vehicle registrations in Toowoomba as at March 2006 - 51 726 of which were passenger vehicles. (Toowoomba Now, 2008).
Toowoomba experiences four distinct seasons. It is notorious for its fog especially during Winter and fog streetlights line several of the major arterial roads.
2.2.1 Brief History of Toowoomba
This section is included to justify why many of Toowoomba roads are in their present locations.
The original Toowoomba settlement was called the Swamp in the Drayton area. (Ivan McDonald Architects, 2004). Originally the Drayton Swamp Agricultural area was bounded by what is now West Street, Bridge Street, and Stephen Street. It comprised 12 20 acre sections. As land speculation increased subdivisions did also and several residential estates were established. Boundary streets one square mile or longer framed a large square or rectangular grid with cardinal orientation.
The early surveyors applied this grid pattern somewhat haphazardly with little regard for the natural features of the land. There was no “master plan.”
In 2008 Toowoomba City Council merged with other councils in surrounding shires to become Toowoomba Regional Council.
2.2.2 Roads in Toowoomba
Toowoomba’s road network is largely designed on a grid pattern. Several major roads in Toowoomba are state and Federally controlled with Main Roads being responsible for these. However, the great majority of local streets are the responsibility of Toowoomba Regional Council.
Toowoomba is widely regarded as a transport hub for the Darling Downs and beyond (Maunsell, 1997).
There is limited public transport in Toowoomba. There are several bikeways though Toowoomba’s crisp Winters and varying altitude can make this form of transport difficult. Therefore it can be assumed that motor vehicle traffic on these roads will continue to grow.
2.3 Road Crashes
The terms crash, collision and accident are used often interchangeably. For the purposes of this dissertation a road crash is defined by Austroads (2004) as follows –
A road crash is an apparently unpremeditated event which results in death or injury to a person or property damage and is attributable to the movement of a road vehicle on (including entering or leaving) a public road.
A casualty crash is a crash where people are injured or killed within 30 days, excluding death from another primary reason or deliberate intent, or a person not directly involved in the crash.
Crash frequency is the number of crash occurrences per year.
2.3.1 Crash classification
Toowoomba has a higher number of crashes than the state average but the severity is below average. (Dugdell, 2007).
Movements or ‘RUM’ codes. These RUM codes use two digits and a letter to define the direction the vehicle was travelling. The full page of RUM codes is set out in Appendix A.
There is no blame attributed to drivers with the RUM system (Andreassen 1994).
2.3.2 Accident causation factors
The three main components in a traffic system are • the human;
[image:18.612.235.416.290.426.2]• the vehicle; and • the road.
Figure 2.2 The three factors that contribute to road crashes Source: Austroads 2004
A crash or accident may be considered as a 'failure' in the system. Indeed, the UK Department of Transport (1986) defines an accident as a 'rare, random, multifactor event always preceded by a situation in which one or more persons have failed to cope with their environment'. (Austroads, 2004)
Human error is often a major contributor to serious accidents. The “fatal four” of alcohol & drugs, failure to wear a seatbelt, fatigue and speed play a major part in accidents. Some statistics pertaining to these are outlined below.
o Approximately 30% of fatal crashes are influenced by alcohol and drug
o Around 40 road user deaths each year are caused by fatigue. This is a
difficult area to accurately measure statistically.
o Speed magnifies risk and increases severity of injury in accidents. o Inexperience contributes to the road toll for young drivers.
o In-attention is the leading contributor to road crashes resulting in
serious injury and increasingly for deaths. (Austroads 2004)
More information on the human factor in road crashes can be accessed from Cairney and Catchpole (1991).
Road environment causation factors are many. Some are briefly outlined below. For more information see Austroads (2004, p.62)
o Road, road surface and geometry o Intersection
o Signs and markings o Traffic signals
o Pedestrian and cyclists o Lighting
o Parked vehicles
o Speed and the environment o Roadside
o Visibility
o Evidence of problems
Vehicular safety issues are largely the responsibility of car manufacturers in their initial design and owners to ensure regular maintenance if performed. The Australian design rules go some way towards reducing risk in this area.
2.3.3. Limitations of reported crash data
Austroads, 1997 a minimum common dataset for reporting of crashes on Australian Roads proposes a national system of consistent road crash reporting.
Systematic reporting bias – Accidents are not always recorded by different organizations in a consistent manner. Due to a number of factors including staff inexperience, non injury accidents are not always reported or not recorded in the database.
Random reporting bias –In addition to many non fatal accidents being under reported erroneous conclusions can be made from wrong interpretation of information. This is particularly evident when roadway factors and human factors are not precisely entered into the database in the first place.
Subjective bias. There are a range of answers to the question “What causes an accident?” Even when presented with similar information subjective elements come into play and different people can draw different conclusions.
Reporting errors. It is important to recognise the circumstances under which a police officer obtains information to complete an accident report. There will often be more pressing matters at an accident scene. The officer may not have local knowledge, so some data items may be inadequately or wrongly recorded. Accidents do not always fit 'standard' formats and there may not be the
motivation to fill in the form.
Coding errors. These can occur throughout the process from filling out the accident report form to the data entry at the computer terminal. It is estimated that errors of this type are present in 5% of accident files (Ogden, 1996).
Location errors. A road may have different regional and local names which means accidents at one location may appear in two separate parts of the accident data base. Locations are often estimated.
Delays. Agencies responsible for data processing may not be sufficiently resourced: it may be many months before information is available for analysis. This means that countermeasure development may be responding to historical accident patterns which may be out of date.
Masked or hidden problems. It may be the case that a location is perceived as being so dangerous that people avoid using it.
2.4 50km/h streets
The following discusses the background to the 50km/h speed limit. 2.4.1 Road Hierarchies
A road hierarchy is defined as the grading of roads according to increasing or decreasing importance of their traffic-carrying or other function (Austroads 2004).Toowoomba Regional Council uses a 4 tier road hierarchy. Roads are classified as local collector, trunk collector, sub arterial or arterial. (Toowoomba Planning Scheme Online, 2008.) Urban arterial roads have a predominant function to carry traffic. They form the primary road network and link main districts of the urban area. Arterial roads that perform a secondary function are sometimes referred to as sub-arterial roads. Urban collector/distributor roads are local streets that have a greater role than others in connecting contained urban areas (e.g. residential areas, activity areas) to the arterial road system. Urban local roads are roads intended exclusively for access with no through traffic function. This paper considers both Urban collector roads and Urban local roads. Motorways and freeways that have the exclusive function to carry traffic within cities and to ensure the continuity of the national or regional primary road system are not evident in the Toowoomba Regional Council boundary. (Austroads, 2004).
2.4.2 Background to implementation on 50km/h streets
Before one can consider the effectiveness of the 50km/h speed limit, extensive background research must be done into its implementation. Most of the
The 50km/h speed limit became effective throughout the entire state of Queensland from 1 February 2003. According to Queensland Transport the ruling is as follows - in built up areas drive no faster than 50km/h unless
otherwise signed. The 50km/h speed limit will only apply to local streets. That is usually a street mainly used to provide direct access to homes and private properties.
Speed limits are decided after considering the following things – - the number and configuration of traffic lanes
- density and type of development - the amount of on-road parking - access arrangements to properties
- the presence or otherwise of traffic signals - the accident patterns that have occurred.
Local, 50km/h streets, are not normally signposted. There are some exceptions but as a general rule motorists must drive at 50kmh unless they see a sign telling them otherwise. The Queensland Police Service enforces this speed limit using radar and hand held laser devices. (Queensland Transport 2003b).
Previous to the 50km/h limit being introduced the speed limit in local streets was 60 km/h. According to Queensland Transport approximately 1/3 of all crashes resulting in injury occur in local streets. The aim is to not only to decrease the number of crashes but also the severity. Driving at a lower speed limit gives drivers shorter stopping distances and extra time to avoid collision.
The three aims of this move are - save lives
- reduce serious injury and property damage
A car travelling at 50km/h can stop 12 – 16 metres sooner than one travelling at 60km/h as illustrated in Figure 2.3
Figure 2.3 Stopping Distances
Source: Queensland Transport, 2003b.
2.4.3 Affect of lowering speed limit to 50km/h in other areas
State/Territory Impact on Crashes and Casualties
Impact on Speeds
New South Wales A three-month trial of a 50 km/h urban speed
limit in 26 local government areas commenced in October 1997; in June 1998
all local councils were invited to implement
the limit, with all implementation costs to be
met by the State Government. Networks of streets with limited access are
posted with 50 km/h area signs, supplemented by repeater signs or pavement
markings.
As at December 2002, 141 councils out of 171 (and two communities in the unincorporated area) had implemented the lower limit, covering more than 90% of the State’s population.
Victoria As a default limit by regulation. Implemented on local streets throughout the State from January 2001.
Queensland As a default limit by legislation. Signposting of 50 km/h areas is limited to
perimeter and repeater signs.
Implemented on local streets by eleven local government areas in the south-east region of Queensland from 1 March 1999, covering 90% of the State’s population.
Will be extended to all of regional Queensland from February 2003.
South Australia
As a default limit by regulation. Implemented on local streets throughout the State from 1 March 2003; existing 40 km/h local speed zones will not change.
Western Australia
As a default limit by regulation. Implemented on local streets throughout the State from 1 December 2001.
Tasmania As a default limit by regulation. Implemented on non arterial roads in urban areas throughout the State from May 2002.
Australian Capital Territory
As a default limit by regulation for a two year
trial period.
Signs have been installed at the entry and
exit of all 50 km/h areas.
Implemented on local streets in the ACT from 1 March 2001.
In addition to the findings of other Australian states supporting evidence for the lower speed limit can be found internationally. (Monash University 2003)
In Europe and North America countries with an urban speed limit of 60km/h had a 30 per cent higher average death rate for pedestrians aged 25 – 64 years.
Within two years of implementation, 3 per cent of the annual French road toll was deemed to be prevented by the reduced 50 km/h speed limit.
The Norwegian Traffic Safety Handbook found that the average speed fell by 3.5-4 km/h and the number of fatal accidents was reduced by 45 per cent after Norway reduced its urban speed limit from 60 km/h to 50 km/h.
When the speed limit in Zurich was reduced from 60 km/h to 50 km/h, pedestrian collisions fell by 20 per cent and pedestrian deaths by 25 per cent.
In addition to this reduction in the number and severity of accidents there is a subsequent reduced cost to the community
2.5
Alternatives to lowering speed limit
The lowering of the speed limit to 50km/h has the potential to lower casualty crashes in Toowoomba. However, it can be difficult to control driver behaviour and reduce speeds on local streets solely through regulation and enforcement. There are
alternatives measures that can be implemented to help reduce injuries and fatalities.
Table 2.2 Alternatives to Lowering the Speed Limit. (Cameron et al, 2002)
Measure Description
Road hump Rounded raised area with dimensions in the order of a 4-metre radius and a 5 to 15 cm height. Raised table Long raised speed hump with a flat section in
the middle and ramps on the ends; sometimes constructed with brick or other textured material on the flat section.
Chicane A series of narrowings or curb extensions that alternate from one side of the street to the other forming S-shaped curves.
Roundabout Raised circles, placed in intersections, around which traffic circulates.
Centre-line marking / flush kerbing Painted markings in the centre of the road. One- and two-lane slow points Islands used to create an angle path for vehicles.
The effect of angling the travel path slows vehicles down.
Intersection priority changes Changes to an intersection priority, such as not allowing right turning traffic.
Channelisation A raised island, islands or markings that force traffic in a particular direction, such as right-turn-only.
Speed cushions A form of road hump, occupying part of the traffic lane in which it is installed, generally located in pairs.
2.6 Conclusions: Chapter 2
Chapter 3 – RESEARCH DESIGN AND METHODOLOGY
3.1 Introduction
This chapter describes the types of data required for analysis in this project. This chapter states the source of the data, how the data was collated and refined, as well as the methodology to analyse the data. As with the Monash University Evaluation of Victorian roads (Newstead et al 2002) hypothesis testing is evident in the analysis presented. No assumption is made that the introduction of the 50 km/h default speed limit will either decrease or increase crash frequency on the affected roads.
3.2 Data
The Toowoomba Regional Council, was contacted in May 2008 and crash data requested. This data was supplied by Greg Smith by way of a “data dump” from council’s accident database into Microsoft Excel spreadsheet. (See Appendix B). The data details all reported accidents received from the Queensland Police Service (Toowoomba) for the Toowoomba city area dating back to the late 1980's. Also, provided from this organization was a map illustrating the streets of Toowoomba and their speed limits. (Appendix C). Queensland Transport was contacted in June 2008 requesting speed infringement data for local streets in Toowoomba. This data was supplied in a spreadsheet format. (Appendix D) It covered all speeding infringements in Toowoomba over the past five years. The relevant data was extracted analysed.
3.2.1 Crash Data
This data was very extensive with over 14000 entries since 1987. It needed some refining to obtain the relevant information. In addition to crash data provided there were also entries of each Give Way, Stop sign, roundabout and traffic light
Appendix E shows a list of the Road User Movement (RUM) codes. Toowoomba City Council uses RUM codes to record road user movements during an accident.
3.2.2 Speed Infringement Data
This data was limited to only covering speed infringements from 2001. The data only had total annual speed infringement numbers with the corresponding infringement type. Appendix D shows the speed infringement data.
3.3 Methodology
This section explains the methods used in verifying the accuracy of the data and how the various data types will be analysed.
3.3.1 Crash Data
Using the Toowoomba City Speed Zone plan (Appendix C), accidents occurring on roads or intersections which were not classified as local were removed. However, if an accident occurred on an intersection between a local and non local road this information was retained. A local road constituted any road with a speed limit of 50km/h.
In order to reduce the possibility of human error all of these entries removed from the spreadsheet were proofread by another person.
As one of the main aims of the reduced speed limit was to decrease serious injury and death these elements too have been considered. All roads that were not 50km/h or intersecting with a 50km/h street were removed. The crash data attained does not distinguish between minor or serious injury.
Four maps were constructed showing casualty crash. Two years were selected before the implementation of the 50km/h speed limit and two years after. The years selected previous to the implementation were 2001 and 2002. The years selected after the implementation were 2004 and 2007. 2004 was selected to show any immediate reduction following the extensive advertising campaign that accompanied the implementation. 2007 was selected as it was the most recent complete set of data. Each casualty crash occurring on a local street or an intersection with a local street was represented on the map with a dot. Only 50km/h streets with single carriageway were included.
3.3.2 Speed Infringement data
Senior Sergeant Bradley Clark of the Queensland Police Service – Toowoomba Traffic Branch provided codes for statistics regarding the number of annual speed infringements in 50km/h local streets. These codes were then sent to Queensland Transport statistics and data analysis department to obtain the relevant information. However, the exact location of the infringements could not be ascertained from Queensland Transport. Freedom of Information was contacted as an attempt to broaden the scope of the data however the information regarding exact location of infringements still could not be ascertained. Also, data on how many police radar traps were implemented on Toowoomba local roads could not be accessed. However, Queensland Police did state that speed cameras are not used on 50km/h streets. Radar traps are only used in response to supplied intelligence in 50km/h streets.
Statistics was again used to include a factor for the increase in registered car ownership.
3.3.3 Factors Influencing the Accuracy of the Data
Several factors influencing the accuracy of the raw data need to be considered before implementing its use. The crash data from Toowoomba City Council is susceptible to double entries of accidents. Numerous data entries require extraction as it appears accidents at the same time, day and intersection have been duplicated by mistake.
Human errors also appear in leaving out vital information in the crash data from data entry personnel. Some accidents may only have one street defined as a location or have RUM code information missing. These data entries need to be assessed for usability and if deemed unusable extracted from the data.
As there is over 14000 crash data entry points it is inevitable that some data may be omitted by mistake. As all care must be taken to ensure a high level of data
refinement a second person must check the omitted data.
3.4 Conclusions: Chapter 3
CHAPTER 4
DATA ANALYSIS
4.1 Introduction
Having obtained the data it was necessary to manipulate it appropriately to achieve desired results. The following section discusses how what information could be drawn from the data after it was plotted and graphed.
4.2 Accidents Occurring on Local Streets
Figure 4.1 is a graph showing the number of accidents occurring on local streets in Toowoomba from 1987 to 2007. The overall trend is a growth in the number of accidents from 1987 until 2003. From 2005 there is a decline. The data for 2008 was omitted as it is not a full calendar year. Figure 4.2 shows this same data but takes into account population growth and increase in car ownership.
ACCIDENTS OCCURRING ON 50KM/H STREETS IN TOOWOOMBA
0 50 100 150 200 250 300 350 400 450 500
1985 1990 1995 2000 2005 2010
[image:32.612.126.512.368.555.2]Years N u m b e r o f C ra s h e s 50km/h introduced
ACCIDENTS OCCURRING ON 50KM/H LOCAL STREETS IN TOOWOOMBA (factoring for population and car ownership growth)
0 100 200 300 400 500 600 700
1985 1990 1995 2000 2005 2010
[image:33.612.126.534.108.284.2]Years N u m b e r o f C ra s h e s
Figure 4.2 – Accidents including increase in population and car registration
4.3 Fatalities on Local streets
There is not a general downward trend when one examines the fatalities occurring on Toowoomba local streets, as seen in figure 4.3. This attracted interest considering the general downward trend in accident numbers. However, given that there is so few (under 10) fatalities a year on local 50km/h streets trends can be harder to establish.
TOOWOOMBA FATALITIES FROM ACCIDENTS IN LOCAL STREETS
-1 0 1 2 3 4 5 6 7 8 9
1985 1990 1995 2000 2005 2010
YEAR N U M B E R O F F A T A L IT IE S .
Table 4.2 Fatalities on Toowoomba local streets according to RUM code
In order to more closely examine this phenomenon fatalities were grouped according to their RUM code as shown in Table 4.2. The most commonly occurring RUM Code was 10 which is cross traffic. (See Appendix E) This has seen a decrease in the five years after the implementation compared to the 5 years before. It is worth noting that all of the RUM codes from 71 – 75 refer to probably single car accidents where cars have travelled off path on a straight section of road. These accidents are less likely to occur if a car was travelling at 50km/h. Therefore it suggests that even though the speed limit is 50km/h this may not be being adhered to.
Road User Movement (RUM) Code
Total
Prior to Feb
2003
After Feb
2003
Pedestrian00 2 2
01 1 1
02 5 4 1
04 1 1
Vehicles from Adjacent Directions
10 8 5 3
Vehicles from Opposing directions
20 2 2
21 2 2
Vehicles from Same Direction
30 2 1 1
Overtaking
50 1 1
On Path
60 1 1
Off Path, on Straight
71 4 2 2
72 2 1
73 2 1 1
74 1 1
75 3 2 1
Off Path on Curve
81 1 1
Passengers and Miscellaneous
4.4 Casualty crashes on local streets in Toowoomba
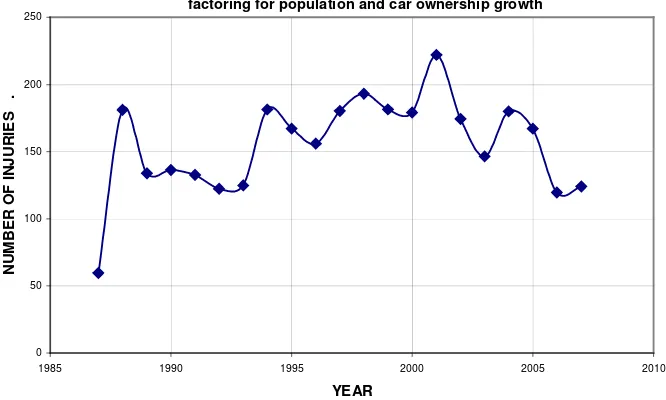
The total number of injuries occurring on local streets is shown below in Figure 4.4.
TOOWOOMBA INJURIES FROM ACCIDENTS IN LOCAL STREETS factoring for population and car ownership growth
0 50 100 150 200 250
1985 1990 1995 2000 2005 2010
[image:35.612.122.455.132.332.2]YEAR N U M B E R O F I N J U R IE S .
Figure 4.4 Casualty crashes in Toowoomba local streets factoring for car registration and population growth
Though there was some increase between 2003 and 2004 the overall trend is falling. The total number of accidents in the years 1999 – 2002 previous to the
implementation of the 50km/h speed limit is 578 while the total number of accidents in years 2004 – 2007 are 557. This shows a decrease of 21 accidents or approximately 5 per year. While this is not a sharp decrease it is worth noting when one considers that there is a greater number of cars on the road.
4.5 Casualty crashes according to RUM codes
4.5.1 RUM Codes 00 – 09 PEDESTRIAN
There has been a decrease in the number of accidents involving pedestrians over the time period (Appendix F). Overall the decrease was 42%. The majority of fields decreased some degree. This is particularly relevant given that this is one of the major types of accidents targeted by the reduced speed limit. The majority of the marketing campaign focused on cars stopping in time to avoid hitting pedestrians. It is virtually impossible for an accident to occur with a pedestrian without injury or fatality occurring so this decrease is encouraging.
4.5.2 RUM Codes 10 – 19 VEHICLES FROM ADJACENT DIRECTIONS
INTERSECTIONS ONLY
10 was the frequently occurring RUM code in accidents causing injury for every year. RUM code 10 refers to Cross Traffic accidents (See Appendix E).
[image:36.612.153.494.417.578.2]In the site investigations undertaken it was noted that intersections between local streets are often not as clearly marked as those on arterial roads. Also, at times there is little warning that the driver is approaching an intersection until they are upon it. Rises and dips can be deceptive and prevent clear sight of upcoming intersections
Also, there are greater chances of trees not being adequately pruned to clearly see all oncoming traffic.
Figure 4.6 Example of Trees reducing visibility on a local street.
Another possible factor is that many of these local street intersections are poorly lit and, especially in foggy Toowoomba conditions, can be difficult to make out.
The most obvious causation factor is driver error whether through inattention, fatigue or error in judgement.
The increase from 92 crashes in 2001 – 2004 to 96 crashes from 2004 – 2008 is marginal considering the increased number of cars on roads. However, it does suggest that lowering the speed limit on its own is not enough to significantly decrease the number of crashes occurring in this way. Thought the 50km/h speed limit can give other drivers extra time to react it will not eliminate all these other possible contributing factors for the high frequency of these crashes.
Rum CODE 13 referring to Right Near turns (Appendix E) also warrants discussion given its high occurrence. Again, there could be many contributing factors to this increase. Confusion over give way rules may be one as showed people are not as confident with this, especially on unguarded intersections. (Driving School 2001) Judgement errors are likely to be the other contributing factor with drivers thinking they have enough time to turn in front of oncoming traffic.
4.5.3 RUM Codes 20 – 29 Vehicles from opposing directions
right thru turns. RUM21 causing injury occurs on average 12 times a year between 2004 – 2007. There is a decrease of 21% on the four years previous to the 50km/h implementation. Reasons for these accidents could be similar to RUM Code 13 driver judgment errors, obstructions or lack of clear vision.
4.5.4 RUM CODES 30 – 39 Vehicles from the Same Direction
The number of accidents causing injury in this category have largely remained the same – a 1.9% increase overall. There are few isolated accidents causing in jury in each category.
[image:38.612.235.374.340.496.2]RUM Code 30 saw a decrease of 25% but still had 24 crashes causing injury in the four year period. The lower speed limit should mean that drivers have increased reaction time to stop before hitting someone but road, car and weather conditions all play a part. (See Figure 4.7)
Figure 4.7 Toowoomba Fog
Code 32 was the 2nd most common accident type causing injury. With occurrences over the eight year period being examined. There was a consistently high number of crashes of this type occurring each year with an 18% growth since the lower speed limit was introduced.
4.5.5 RUM codes 40 – 49 Manoeuvring
can become complacent and unobservant. While the 50 km/h speed limit does give other drivers longer time to react this will not prevent all accidents of this nature.
Also, RUM code 47, emerging from a driveway, has an average of two crashes a year. Car parking is policed less on local roads and motorists Cars parked on the foot path or in the gutter can obstruct drivers view emerging from driveways. Though we do not know if these accidents are residents leaving their own homes this information could still be relevant. According to Monash University (2003)over half of all accidents happen within 8km of home. This study found that it may be a human fault or inattention and familiarity that causes the problems.
4.5.6 RUM Codes 50 – 59 Overtaking
The only accident type causing data in this category was code 53 overtake turning. There has been a decrease of 62% from eight to only three of these accidents occurring in the four years since the decreased speed limit.
4.5.7 RUM Codes 60 – 69 Accidents on Path
Accidents on Path had an overall decrease of 12 % from 17 to 15 in the four year period after the implementation. Overall accidents of this nature were farily rare with the most common being accidents occurring when drivers were double parked – RUM 61.
4.5.8 RUM Codes 70 – 79 Off Path On Straight
This category Off path on straight section of road has seen a decrease of 24% in accidents causing injury. However, as discussed in the fatality section this was the area with the most fatalities occurring.
4.5.9 RUM Codes 80 – 89 Off Path On Curve
This category referring to drivers going off onto the path on a curve has seen a 27% decrease. Once again speed often plays a part in these accidents. If a driver was adhering to the 50km/h speed limit these accidents are unlikely to occur. It may not matter what the speed limit is set to some drivers will always speed and therefore have accidents causing injury. All of these accidents have rarely occurred in the time periods examined.
4.5.10 RUM Codes 90 – 99 Passengers and Miscellaneous
This passengers and miscellaneous category rarely features. The most common form of accident appearing here is Rum 90 falling in or from a vehicle. It would be difficult to see a connection between these accidents and the decreased speed limit.
4.6 Injury causing accidents according to location
Using an adaptation of the Toowoomba City Speed Zonal Plan, all the casualty and fatality accidents on local streets were marked. The maps were then closely studied for areas where several accidents seemed to occur in close proximity. This enables further study to establish other contributing factors in these areas. Site investigations were then conducted of areas of interest. Photos were taken of particular points of interest. Where it was difficult to take appropriate photos Google Maps (2008) has been used to represent the intersections.
There were no streets that had a particularly high number of casualty crashes that appeared on one map only. They all appeared over several years.
Site investigations were carried out on the following streets which demonstrated a higher number of casualty crashes.
- McGregor Street – near the intersection with Bridge Street 2001, 2002 - Hurstway Street – 2002, 2004
4.6.1 James Street and local street intersections
There were several accidents occurring on local streets where they intersected with James Street. Site investigations were not conducted on each of these individual sites as it was deemed that the greatest contributing factors are more likely to be
intersection management than the speed limit on the local street.
4.6.2 Russell Street
Russell, McGregor, Neil and Pechey Streets are signed 50km/h streets according to the Toowoomba City Speed Zonal Plan (Appendix C). This demonstrates that while still sharing some characteristics with local streets they are recognised at streets which have a traffic load greater than most local streets.
[image:41.612.167.444.399.565.2]Site investigation at Russell Street revealed that, while it is a 50km/h street in some sections, in the areas where several accidents occurred it is a one way street with at least two lanes. It has three sets of traffic lights in this small section being examined between Victoria Street and Neil Street.
Figure 4.8 Corner of Russell and Neil Streets Source: Google Maps
4.6.3 Neil Street
A similar situation was found in Neil Street between Russell and Margaret Streets. While Neil Street does become a single lane carriageway between Perth and Herries Street previous to this it is similar to Russell Street – being one way with at least two lanes. In the areas where it show more characteristics of a local street there is not a higher than average casualty accident rate. One can effectively conclude that the 50km/h speed limit reduction introduced in 2003 has not hard a marked effect on accidents on both Russell and Neil street in the Toowoomba CBD.
4.6.4 Hurstway Court
4.6.5 McGregor Street
[image:43.612.129.484.183.377.2]McGregor Street runs alongside Captain Cook sporting grounds which in Winter in Toowoomba make it very busy on peak times such as Saturday mornings. Since 2001 additional parking has been installed and speed limits lowered during peak times. This has gone some way to decreasing accidents from seven in 2001 in future years to four accidents recorded in 2007.
Figure 4.9 McGregor St Source: Google Maps
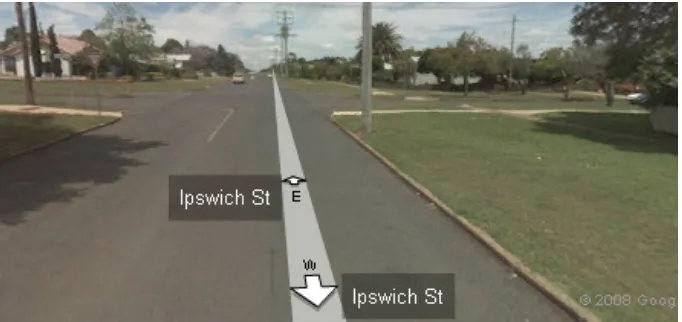
4.6.6 Curzon Street
Curzon Street runs north-south, parallel to Mackenzie Street, towards the Eastern escarpment of the Toowoomba Range. A site investigation of the section of Curzon Street between Herries and Perth Streets revealed several possible contributing factors to the higher number of injury causing accidents on this local road.
[image:43.612.203.408.522.677.2]Curzon Street runs past St Vincents Hospital and while it is not the main access road with the main parking areas, it is extensively used. So it does have a fairly high traffic volume in comparison with other smaller local residential streets. Many roads form crossroads intersections with Curzon Street such as Ipwsich Street in Figure 4.5
Figure 4.11 Intersection of Curzon Street and Ipswich St.
There is no traffic lights on Curzon Street, all intersections are either Stop or Give Way signs. Curzon Street is divided by a traffic island. Motorists travelling west along Ipswich Street drive down a dip before meeting rather abruptly with the Curzon Street cross roads. Also, it is possible that drivers get distracted looking ahead along other roads that they do not realise there is an intersection with Curzon Street that requires them to yield.
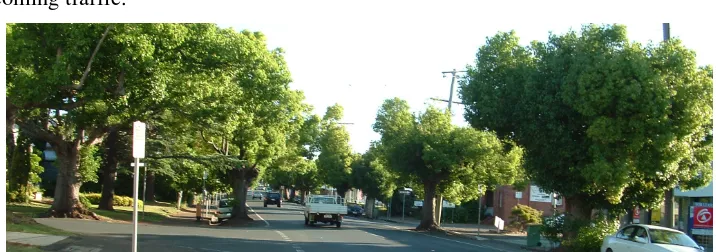
4.6.7 Mort Street
A site examination of Mort Street was conducted to establish problem spots on this stretch of road. Mort Street is lined with large, established trees.
[image:44.612.245.369.547.692.2]Cars can park in between trees and in parks along both sides of the road in places. This can make it very difficult for drivers to establish a clear line of site when trying to cross or turn into Mort Street very difficult. Also, Mort Street is lined with businesses that have driveways that come out between the trees to the street. If a driver cannot clearly see oncoming traffic they are presented with the choice to edge out slowly or travel with speed and hope for the best. The latter choice would contribute to high accidents causing injury. In Mort Street there was increased risk of drivers not having clear line of sight due to trees, parked vehicles and vehicles coming out of business driveways. The 50km/h speed limit on Mort Street gives other drivers longer time to react but there are other factors making this a high risk areas.
4.6.8 Pechey Street
Pechey Street is the main access road between the CBD and Toowoomba Base Hospital. There has been a decreasing trend of accidents here since 2002 but it still has a largely number of casualty crashes than most streets. The highest number of accidents along Pechey Street occur at the traffic light intersection with James Street. However, some are also further along towards the hospital entrance.
4.13 Pechey Street outside Toowoomba Base Hospital
4.7 Speed Infringement Data
The speeding infringement data obtained from the Queensland Police Force via Queensland Transport has limited conclusions that can be drawn from it.
Data was provided in table form for the sections where 50km/h limit was exceeded (Figure 4.8) The data has been left in table form as graphed it was misleading given that there we do not know how many tests were done and where they were done. The most common exceeded amount was >13 but <20km/h over the limit. However, it is alarming the number drivers exceeding the limit by greater than 30 or 40 km/h.
As there is no indication of how many radar tests are done on local streets it is impossible to work out what percentage of people are exceeding the 50km/h limit. Also, one cannot assume that the number of people speeding has increased in 2005 because it is possible there were a much greater number of speed traps conducted. What can be concluded from the data is that with that number of motorists exceeding the 50km/h limit, speed will still be a major factor in a large number of the accidents. Just because the limit has been lowered does not mean every driver is now adhering to it.
It may be necessary to consider other traffic calming measures such as chicanes or speed humps in conjunction with the lower speed limit in order to slow drivers down.
Table 4.3 Speed Infringement data 50km/h Toowoomba district
Code Offence Description 20012002200320042005200620072008 Total
1701
EXCEED 50KM/H (LOWER DEFAULT SPEED LIMIT BUA) BY LESS THAN 15
KM/H 0 1 0 0 0 0 0 0 1
1702
EXCEED 50KM/H (LOWER DEFAULT SPEED LIMIT BUA)BY 15KM/H <
30KM/H 3 2 0 0 0 0 0 0 5
2522
TRACTOR W/- S/CANE TRAIL EXCEED 50KMH BY MORE THAN 30KMH NOT
MORE 40K 0 0 0 0 0 0 1 0 1
2540
EXCEED 50KMH (LOW DEFAULT SPD LT BUA)BY AT LEAST 13KMH NOT
MORE 20KMH 0 0 45 104 225 176 160 35 745
2541
EXCEED 50KMH(LOW DEFAULT SPD LT BUA)BY MORE THAN 20KMH NOT
MORE 30KMH 0 0 12 29 52 36 30 6 165
2542
EXCEED 50KMH(LOW DEFAULT SPD LT BUA)BY MORE THAN 30KMH NOT
MORE 40KMH 0 0 1 8 6 6 3 4 28
2543
EXCEED 50KM/H (LOWER DEFAULT SPEED LIMIT BUA) BY MORE THAN
40KM/H 0 0 2 1 2 3 1 1 10
TOTAL 3 3 60 142 285 221 195 46 955
Figure 4.8 Number of speed infringements issued by Queensland Police in 50km/h streets – Toowoomba Branch.
4.8 Maps
4.9 Conclusions: Chapter 4
CHAPTER 5
CONCLUSIONS
5.1 Introduction
The aim of this chapter is to finalise the discussions of the previous sections. The scope of this paper will be examined and conclusions drawn on the effectiveness of the 50km/h speed limit on Toowoomba local streets.
5.2 Discussion
The number of casualty crashes on local roads in Toowoomba has decreased since the implementation of the 50km/h speed limit. This was shown by the decrease of
accidents in the four year period after the implementation compared to the four year period prior. However, this paper has highlighted how there are several types of accidents, differentiated by their RUM code, which have increased since the
implementation of the lower speed limit. Also, the paper highlighted several areas that have either remained the same or had an increased number of casualty crashes. In order to further reduce the number of casualty crashes many other factors need to be examined.
5.3 Further research and recommendations
There are many other factors that work in conjunction with speed to cause serious property damage, injury or death. In order to further reduce these incidents other issues need to be resolved such as -
• Poor lighting
• Unclear intersection signage
• Lack of warning signs of approaching intersection • Obstructions to clear view
• Fatal four – speed, alcohol, fatigue, seatbelts • Driver error – perhaps the most crucial
on the information being made available to the researcher. Particularly relevant is examining speed to establish what percentage of people travelling in 50km/h zones are over the limit if this data could be made available. Also in which streets these speeding infringements are taking place.
Another area of further work could be to investigate the driver education and how secure motorists are with the road rules. Given that there were a number of casualty accidents due to u turns, double parking and other illegal acts it would be interesting to research whether these errors are made out of ignorance or complacency. It is possible that better driver education may assist here but there is a realisation that there are budget and other constraints. For example, roundabouts were not in place in Toowoomba when many drivers received their licences so there may be a lack of confidence in using them.
The final area of research would be to ascertain whether traffic calming devices such as slow points help or hinder the reduction of casualty crashes on local 50km/h roads. Do they become a place for “hoons” to test driving capabilities at speed or do they genuinely slow traffic?
While refining data to examine only accidents occurring on local roads it was observed that the majority of very serious accidents are occurring on the bigger, busier arterial roads. This is a large field that requires much further study.
5.4 Summary of Chapter 5
“… although local roads make up a considerable amount of the road network, it is estimated that on average only 15% of journeys are spent on local roads. Secondly,
around 15 to 20% of crashes occur on local roads. Therefore reducing the speed limit
on such roads is only going to have small impact on the overall road safety situation.
Enormous gains can still be obtained by lower speed limits on busier arterial roads
Appendix A University of Southern Queensland
Faculty of Engineering and Surveying
ENG4111/4112 Research Project
Project Specification
FOR: Joshua Edward Allan GOODALL
TOPIC: The 50kph speed limit in residential Toowoomba SUPERVISOR: Trevor Drysdale
SPONSORSHIP: University of Southern Queensland ENROLMENT: ENG 4111 – S1, X, 2008
ENG 4112 – S2, X, 2008
PROJECT AIM: This project will seek to determine the effectiveness of the introduction of the 50kph limit in Toowoomba by examination of road crash data and residential speed infringements.
PROGRAMME: (Issue A, 19 March 2008)
1. Research the background information relating to the introduction of the 50kph speed limit in Queensland.
2. Ascertain data from sources that relate to residential Toowoomba road crashes and speed infringements before and after the implementation of the 50kph speed limit.
3. Critically compare data sets prior to and after the 50kph speed limit implementation.
4. Produce maps of Toowoomba showing where road crashes and speed infringements happen both prior to and after the 50kph speed limit implementation.
5. Analyse the maps for any major differences between the data sets.
6. Complete site investigations of areas where road crashes and speed infringements have not been reduced.
7. Produce a map that shows where the implemented speed limit has reduced road crashes and speed infringements.
As time permits
8. Design traffic managing systems in accordance with local and state laws for areas that have high amounts of road crashes and speed infringements.
AGREED:
_________________________ (Student) _________________________ (Supervisor)
Date: ___ /___ / 2008 Date: ___ /___ / 2008
Appendix C Sample Data Received from Toowoomba Regional Council
3/01/2001 21:35:00 JAMES ST PECHEY ST 0 0 10W
3/01/2001 16:30:00 JAMES ST 100m W HELEN ST 0 1 32E
4/01/2001 18:00:00 JAMES ST WEST ST 0 1 30N
4/01/2001 9:00:00 JAMES ST 12M W FIFTH 1 0 00W
5/01/2001 19:15:00 CAMPBELL ST RUTHVEN ST 0 1 53S
9/01/2001 23:00:00 MORTON ST RUTHVEN ST 0 0 31N
9/01/2001 18:50:00 PIERCE ST RUTHVEN ST 0 1 10E
9/01/2001 22:30:00 BIRDWOOD ST HENDERSON ST 0 0 75W
11/01/2001 18:10:00 CLIFFORD ST GRANGE ST 0 0 10E
11/01/2001 13:00:00 BRIDGE ST BROOK ST 0 0 32W
12/01/2001 12:55:00 STEPHEN ST WEST ST 0 1 10W
12/01/2001 22:00:00 RUTHVEN ST 20m S MARGARET 0 0 60N
13/01/2001 14:00:00 RUTHVEN ST 40m N ALDERLEY 0 0 60N
13/01/2001 12:30:00 ALDERLEY ST RUTHVEN ST 0 0 21W
14/01/2001 12:30:00 CAMPBELL ST O/S NO 172 0 1 47N
14/01/2001 17:00:00 BRIDGE ST RAFF ST 0 0 10S
16/01/2001 11:50:00 GLEESON CRES 100M N FLYNN 0 1 02N
16/01/2001 6:35:00 JAMES ST 100E E HELEN 0 1 71W
16/01/2001 21:10:00 KITCHENER ST MARGARET ST 0 0 21E
16/01/2001 10:10:00 GEDDES ST LONG ST 0 1 10S
17/01/2001 6:15:00 RUTHVEN ST STENNER ST 0 0 21W
17/01/2001 16:15:00 VICTORIA ST AT MILNE BAY 0 0 47E
18/01/2001 9:00:00 HERRIES ST PHILLIP ST 0 1 10W
18/01/2001 18:00:00 CURZON ST SINCLAIR ST 0 0 60E
19/01/2001 14:35:00 MANSFORD ST RUTHVEN ST 0 1 32N
19/01/2001 10:42:00 PECHEY ST 200m S JAMES 0 0 60N
19/01/2001 12:50:00 FITZPATRICK ST TARA ST 0 0 10N
19/01/2001 14:15:00 COONAN ST MOONEY ST 0 0 83S
20/01/2001 3:45:00 ANZAC AVE HURSLEY RD 0 0 81S
20/01/2001 13:05:00 CURZON ST JAMES ST 0 0 32W
20/01/2001 1:30:00 HOLBERTON ST 50M S CAMPBELL 0 0 71S
23/01/2001 17:50:00 DALGLEISH ST AT END 0 1 75E
25/01/2001 21:20:00 KITCHENER ST MARGARET ST 0 0 13N
25/01/2001 14:55:00 JELLICOE ST LINK ST 0 0 13N
26/01/2001 15:10:00 NORTH ST 100M E GREENWATTLE 0 1 71W
27/01/2001 0:50:00 RUTHVEN ST 20m N JAMES ST 0 0 35S
30/01/2001 3:00:00 HERRIES ST MACKENZIE ST 0 0 71E
30/01/2001 2:00:00 ALAYNE CT RACHEL ST 0 0 85S
30/01/2001 18:30:00 NORTH ST RUTHVEN ST 0 0 21W
30/01/2001 15:30:00 LONG ST RUTHVEN ST 0 0 21E
30/01/2001 12:10:00 MARGARET ST E OF PARK LN 0 0 43W
31/01/2001 10:15:00 TAYLOR ST WYALLA ST 0 0 13N
31/01/2001 14:50:00 RUTHVEN ST STEPHEN ST 0 0 30N
AT INTERSECTION CROSS TRAFFIC SOUTHBOUND - WESTBOUND ON PATH HIT PARKED VEHICLE NORTHBOUND
ON PATH HIT PARKED VEHICLE NORTHBOUND
VEHICLES FROM OPPOSING DIRECTIONS RIGHT-TURN FROM E - STR FROM W EMERGING FROM DRIVEWAY ONTO WESTBOUND CARRIAGEWAY
AT INTERSECTION CROSS TRAFFIC SOUTHBOUND - EASTBOUND PEDESTRIAN far side westbound
STRAIGHT OFF CARRIAGEWAY TO LEFT INTO OBJECT/PARKED VEH WESTBOUND VEHICLES FROM OPPOSING DIRECTIONS RIGHT-TURN FROM W - STR FROM E AT INTERSECTION CROSS TRAFFIC SOUTHBOUND - EASTBOUND
VEHICLES FROM OPPOSING DIRECTIONS RIGHT-TURN FROM E - STR FROM W EMERGING FROM DRIVEWAY ONTO NORTHBOUND CARRIAGEWAY
AT INTERSECTION CROSS TRAFFIC SOUTHBOUND - WESTBOUND ON PATH HIT PARKED VEHICLE EASTBOUND
VEHICLES FROM SAME DIRECTION REAR END FRONT VEH TURNING RT S-E ON PATH HIT PARKED VEHICLE NORTHBOUND
AT INTERSECTION CROSS TRAFFIC NORTHBOUND - WESTBOUND
CURVE OFF C'WAY, RIGHT ON R.H.BEND INTO OBJECT/PKD VEH WESTBOUND CURVE OFF C'WAY, LEFT ON R.H.BEND INTO OBJECT/PKD VEH WESTBOUND VEHICLES FROM SAME DIRECTION REAR END FRONT VEH TURNING RT E-N STRAIGHT OFF CARRIAGEWAY TO LEFT INTO OBJECT/PARKED VEH SOUTHBOUND STRAIGHT OFF END OF ROAD/TEE INTERSECTION EASTBOUND
AT INTERSECTION RIGHT NEAR TURNING FROM S TO E AT INTERSECTION RIGHT NEAR TURNING FROM S TO E
STRAIGHT OFF CARRIAGEWAY TO LEFT INTO OBJECT/PARKED VEH WESTBOUND VEHICLES FROM SAME DIRECTION LANE CHANGE LEFT SOUTHBOUND
STRAIGHT OFF CARRIAGEWAY TO LEFT INTO OBJECT/PARKED VEH EASTBOUND CURVE OFF C'WAY, RIGHT ON L.H.BEND INTO OBJECT/PKD VEH EASTBOUND VEHICLES FROM OPPOSING DIRECTIONS RIGHT-TURN FROM E - STR FROM W VEHICLES FROM OPPOSING DIRECTIONS RIGHT-TURN FROM W - STR FROM E ENTERING PARKING COLLISION WITH WESTBOUND VEHICLE
AT INTERSECTION RIGHT NEAR TURNING FROM S TO E VEHICLES FROM SAME DIRECTION REAR END NORTHBOUND
Appendix E - Sample Speed Infringement Data Received from Qld Tranpsort
QPS District
QPS Station
Name Code Offence Description
TOOWO OMBA
CROWS
NEST 2540 EXCEED 50KMH (LOW DEFAULT SPD LT BUA)BY AT LEAST 13KMH NOT MORE 20KMH
TOOWO
OMBA DRAYTON 2540 EXCEED 50KMH (LOW DEFAULT SPD LT BUA)BY AT LEAST 13KMH NOT MORE 20KMH
TOOWO
OMBA DRAYTON 2541 EXCEED 50KMH(LOW DEFAULT SPD LT BUA)BY MORE THAN 20KMH NOT MORE 30KMH
TOOWO
OMBA GATTON 2540 EXCEED 50KMH (LOW DEFAULT SPD LT BUA)BY AT LEAST 13KMH NOT MORE 20KMH
TOOWO
OMBA GATTON 2541 EXCEED 50KMH(LOW DEFAULT SPD LT BUA)BY MORE THAN 20KMH NOT MORE 30KMH
TOOWO
OMBA GATTON 2543 EXCEED 50KM/H (LOWER DEFAULT SPEED LIMIT BUA) BY MORE THAN 40KM/H
TOOWO
OMBA HELIDON 2541 EXCEED 50KMH(LOW DEFAULT SPD LT BUA)BY MORE THAN 20KMH NOT MORE 30KMH
TOOWO
OMBA LAIDLEY 2540 EXCEED 50KMH (LOW DEFAULT SPD LT BUA)BY AT LEAST 13KMH NOT MORE 20KMH
TOOWO
OMBA OAKEY 2522 TRACTOR W/- S/CANE TRAIL EXCEED 50KMH BY MORE THAN 30KMH NOT MORE 40K
TOOWO
OMBA OAKEY 2540 EXCEED 50KMH (LOW DEFAULT SPD LT BUA)BY AT LEAST 13KMH NOT MORE 20KMH
TOOWO OMBA
PITTSWORT
H 2540 EXCEED 50KMH (LOW DEFAULT SPD LT BUA)BY AT LEAST 13KMH NOT MORE 20KMH
TOOWO OMBA
PITTSWORT
H 2541 EXCEED 50KMH(LOW DEFAULT SPD LT BUA)BY MORE THAN 20KMH NOT MORE 30KMH
TOOWO OMBA
TOOWOOM
BA 1702 EXCEED 50KM/H (LOWER DEFAULT SPEED LIMIT BUA)BY 15KM/H < 30KM/H
TOOWO OMBA
TOOWOOM
BA 2540 EXCEED 50KMH (LOW DEFAULT SPD LT BUA)BY AT LEAST 13KMH NOT MORE 20KMH
TOOWO OMBA
TOOWOOM
BA 2541 EXCEED 50KMH(LOW DEFAULT SPD LT BUA)BY MORE THAN 20KMH NOT MORE 30KMH
TOOWO OMBA
TOOWOOM
BA 2542 EXCEED 50KMH(LOW DEFAULT SPD LT BUA)BY MORE THAN 30KMH NOT MORE 40KMH
TOOWO OMBA
TOOWOOM BA
TACTICAL
BRANCH 2541 EXCEED 50KMH(LOW DEFAULT SPD LT BUA)BY MORE THAN 20KMH NOT MORE 30KMH
TOOWO OMBA
TRAFFIC BRANCH TOOWOOM
BA 1701 EXCEED 50KM/H (LOWER DEFAULT SPEED LIMIT BUA) BY LESS THAN 15 KM/H
TOOWO OMBA
TRAFFIC BRANCH TOOWOOM
BA 1702 EXCEED 50KM/H (LOWER DEFAULT SPEED LIMIT BUA)BY 15KM/H < 30KM/H
TOOWO OMBA
TRAFFIC BRANCH TOOWOOM
BA 2540 EXCEED 50KMH (LOW DEFAULT SPD LT BUA)BY AT LEAST 13KMH NOT MORE 20KMH
TOOWO OMBA
TRAFFIC BRANCH TOOWOOM
BA 2541 EXCEED 50KMH(LOW DEFAULT SPD LT BUA)BY MORE THAN 20KMH NOT MORE 30KMH
TOOWO OMBA
TRAFFIC BRANCH TOOWOOM
Appendix F
RUMCODE
1997 1998 1999 2000 2001 2002
Total 1999 - 2002
Pedestrian 50
00 2 8 9 3 3 1 16
01 2 2 5 1 8
02 4 4 2 6 6 5 19
03 1 0
04 1 1
05 1 1
06 1 1 2
07 1 1 1 1
09 1 1 1 2
Vehicles from Adjacent
Directions 127
10 24 32 24 25 25 18 92
11 2 1 3 1 1 2 7
13 4 10 2 2 10 7 21
14 1 2 3
15 1 1
16 1 2 3
Vehicles from Opposing
Directions 70
20 2 1 3 1 4
21 20 14 18 13 19 14 64
23 1 1
24 1 1
29 1 0
Vehicles from Same
Direction 105
30 6 5 11 3 12 6 32
31 2 3 2 1 7 10
32 9 9 11 6 19 13 49
33 1 1 1 1 1 4
34 1 1 3 4
35 1 1 1
36 1 2 3
37 1 1 1 1
38 1 1
39 0
Manoeuvring 23
40 1 1 1 1 3 2 7
41 1 0
42 1 1 2 1 4
45 1 1 1
47 2 1 1 2 3 2 8
48 1 1 2 3
Overtaking 8
53 1 1 3 2 3 8
On Path 17
60 1 1
61 1 3 5 4 1 1 11
65 1 1 2 1 4
66 1 1
68 0
Off Path On Straight 45
71 1 1
72 4 5 2 9 5 7 23
73 1 1
Off Path on Curve 11
82 2 1 1 2 4
83 1 1 2
84 1 1 2
85 0
86 2 2 0
88 2 2 2
89 1 1 1
Passengers and
Miscellaneous 5
90 1 2 1 1 1 3
92 1 1
Rumcode Analysis Page 3
2004 2005 2006 2007
Total 2004 - 2007
Percentage Increase or Decrease
29 -42.0
4 2 0 6 12 -25.0
2 2 1 2 7 -12.5
1 1 2 4 -78.9
0 0.0
2 2 100.0
0 -100.0
0 -100.0
1 1 0.0
1 1 1 3 50.0
137 7.9
25 23 19 29 96 4.3
1 3 2 6 -14.3
10 5 11 8 34 61.9
0 -100.0
1 1 0.0
2 1 3 0.0
55 -21.4
3 1 4 0.0
10 15 14 11 50 -21.9
0 -100.0
0 -100.0
1 1 100.0
107 1.9
5 5 6 8 24 -25.0
4 4 4 12 20.0
18 14 13 13 58 18.4
3 3 -25.0
1 1 2 -50.0
0 -100.0
2 1 2 5 66.7
1 1 2 100.0
0 -100.0
1 1 100.0
18 -21.7
2 2 3 2 9 28.6
0 0.0
1 1 -75.0
0 -100.0
1 4 2 1 8 0.0
0 -100.0
3 -62.5
0 -100.0
2 3 3 8 -27.3
1 2 1 2 6 50.0
0 -100.0
1 1 100.0
34 -24.4
0 -100.0
4 9 7 5 25 8.7
0 -100.0
1 2 2 5 -61.5
0 -100.0
1 1 1 1 4 -20.0
8 -27.3
1 1 -75.0
1 1 -50.0
1 1 -50.0
1 1 100.0
0 100.0
1 1 2 0.0
2 2 100.0
8 60.0
3 3 1 7 133.3
0 -100.0
1 1 0.0