March 2016
HC 901
BUDGET 2016
HC 901
Return to an order of the House of Commons
dated 16 March 2016
Copy of the Budget Report – March 2016 as
laid before the House of Commons by the
Chancellor of the Exchequer when opening
the Budget.
David Gauke
Her Majesty’s Treasury
16 March 2016
© Crown copyright 2016
This publication is licensed under the terms of the Open Government Licence v3.0 except where otherwise stated. To view this licence, visit nationalarchives.gov.uk/doc/open-government-licence/version/3 or write to the Information Policy Team, The National Archives, Kew, London TW9 4DU, or email: [email protected].
Where we have identified any third party copyright information you will need to obtain permission from the copyright holders concerned. This publication is available at www.gov.uk/government/publications Any enquiries regarding this publication should be sent to us at [email protected]
Print ISBN 9781474129572 Web ISBN 9781474129589 ID 29021615 54616 03/16 PU1910
Printed on paper containing 75% recycled fibre content minimum
Printed in the UK by the Williams Lea Group on behalf of the Controller of Her Majesty’s Stationery Office
Contents
Page
Executive Summary 1
Budget Report
Chapter 1 Budget Report 9
The UK economy and public finances 9
Support for working people 29
Backing business and enterprise 44
Opportunity across the UK 60
Chapter 2 Budget policy decisions 83
Annex A Financing 131
Office for Budget Responsibility: Budget forecast
Annex B Office for Budget Responsibility’s Economic and fiscal
outlook: selected tabless 135
List of abbreviations 141
List of tables 144
List of figures 144
Executive Summary
This is a Budget that puts the next generation first. In uncertain times and against a deteriorating global economic outlook, this Budget delivers security for working people. It takes the next bold steps in the government’s long-term economic plan. It reduces the deficit, achieves a surplus and makes the reforms needed so Britain is fit for the future.
The UK is forecast to grow faster than any other G7 economy this year, with employment at record highs, but with productivity growth weaker than forecast. So this Budget sets out long-term solutions to long-long-term problems and invests in the education, builds the infrastructure and supports the savings of the next generation.
In this Budget, the government will take action to:
•
make additional savings equivalent to 0.5% of total government spending, to ensure the nation lives within its means•
back business with a major overhaul of corporation tax reliefs, a lower corporation tax rate and a big reduction in small business rates•
boost enterprise with a reduction in Capital Gains Tax and tax for the self-employed•
accelerate education reforms and improve children’s health with a soft drinks industry levy•
support working people with a £11,500 personal allowance and a £45,000 higher ratethreshold
•
back savers with a new flexible Lifetime ISA for young people and a higher ISA limit for allThe UK economy and public finances
Britain is forecast by the Organisation for Economic Co-operation and Development (OECD) to be the fastest growing major advanced economy this year. With employment at a record rate of 74.1%. But the challenges the country faces are growing.
Since the Spending Review and Autumn Statement was published in November 2015, the outlook for the global economy has worsened and global growth has slowed, with the International Monetary Fund (IMF) predicting global growth of 3.4% in 2016, 0.2 percentage points lower than its October forecast. In advanced economies, there are growing concerns about productivity growth, high debt levels and deflationary risks. Productivity growth since the financial crisis of 2008 and 2009 has been weaker in all the major advanced economies, including the UK.
In emerging economies risks have also increased, with falling oil prices hitting commodity-exporting economies, Russia and Brazil in recession, and China’s rebalancing leading to lower growth in a number of countries.
the financial crisis is greater here in Britain than the Office for Budget Responsibility (OBR) had previously forecast.
This is precisely why the UK has been working through its long-term economic plan. Since 2010 the plan has been focussed on reducing the deficit, while delivering the supply side reforms necessary to improve long-term productivity growth. That has allowed an active monetary policy to support the economy while ensuring the fiscal position is sustainable in the long term.
As a result, the deficit at 3.8% is forecast to be down by almost two thirds from its peak, bank capital ratios have doubled and there are over 2 million new jobs since 2010. Had the government not taken action to reduce the structural deficit from its 2009-10 level, cumulative borrowing would have been £930 billion higher in 2019-20.
Eight years ago, the UK was one of the worst prepared to face the financial crisis. Today, in the face of a cocktail of global risks, the UK is one of the best prepared. The UK responds to lower productivity growth and a more difficult global economy by:
•
maintaining credible public finances and running a surplus in 2019-20•
cutting taxes for business and enterprise•
investing in infrastructure and devolving power•
improving education and healthcare•
supporting savings•
cutting taxes for working peopleThis is a Budget which acts now so that the country doesn’t pay later. It is a Budget that steers Britain through uncertain times, providing security now and opportunity for the next generation.
Economic and fiscal forecast
The OBR forecasts GDP growth of 2.0% in 2016, 2.2% in 2017 and 2.1% to the end of the forecast period. It forecasts employment to be 31.5 million in 2016, rising each year to 32.1 million in 2020. CPI is forecast to be below the 2.0% inflation target in 2016, returning gradually to 2.0% in 2018.
Public sector net borrowing is forecast to fall to 3.8% of GDP in 2015-16 and then to fall each year for the remainder of the forecast period. The OBR forecasts that the public finances will deliver a surplus of £10.4 billion in 2019-20 and £11.0 billion in 2020-21. Public sector net debt is forecast to fall to 74.7% of GDP in 2020-21.
Sound public finances
The government’s first duty to the next generation is to put the public finances on a sustainable footing. This provides the bedrock of security for working people. This Budget will ensure that the UK will meet its fiscal target of achieving a surplus in 2019-20. In addition to measures announced at the Spending Review and Autumn Statement, the government will:
•
conduct a departmental efficiency review, which will help deliver a further £3.5 billion of savings from public spending in 2019-20, while maintaining the protections set out at the Spending Review and Autumn Statement•
continue to spend 0.7% of gross national income on Official Development Assistance (ODA) adjusted in line with the latest economic forecastsSupport for working people
This Budget provides security for working people and opportunity for the next generation. The government will:
•
reduce tax on working people further by increasing the personal allowance to £11,500 and the higher rate threshold to £45,000 in 2017-18•
freeze fuel duty, saving the average driver £75 every year compared to pre-2010 fuel duty escalator plans•
recognise the role pubs play in local communities and support the Scotch whisky industry by freezing duty on beer, spirits and most ciders•
drive forward the radical devolution of power to school leaders, expecting all schools to become academies by 2020, or to have an academy order in place to convert by 2022•
introduce a new soft drinks industry levy to help tackle childhood obesity, by incentivisingcompanies to reduce the sugar in the drinks they sell, to fund a doubling of the primary schools sports premium to £320 million per year from September 2017
•
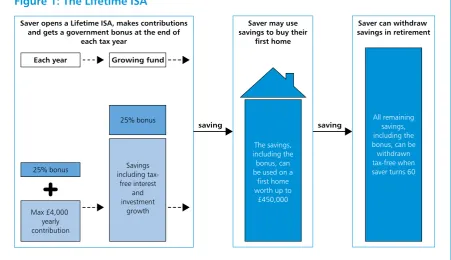
give the next generation choice and flexibility in their savings, by increasing the ISA limit to £20,000 and launching a new flexible Lifetime ISA for under 40s in which people can save up to £4,000 each year and receive an additional 25% bonus from government. Savings, including the government bonus, can be accessed to buy a first home and in retirement•
launch a new Help to Save scheme for people on low incomes, providing a 50% governmentbonus on up to £50 of monthly savings, benefiting up to 3.5 million people
Backing business and enterprise
This Budget backs business and enterprise to drive up productivity growth and create job opportunities. This Budget continues to lower taxes, with new support for small business and entrepreneurs, while also modernising the tax system and taking steps to ensure that taxes are fair and are paid.
The government will:
•
cut the rate of corporation tax to 17% in 2020, benefiting over one million companies, large and small•
cut business rates for all properties in England, with 600,000 small firms paying no rates so that the business rates burden will fall by £6.7 billion over the next five years•
cut the higher rate of Capital Gains Tax from 28% to 20% and the basic rate from 18% to 10% from April 2016 (except for residential property and carried interest), and extend entrepreneurs’ relief to long term investors in unlisted companies•
cut National Insurance contributions for 3.4 million self-employed people, by abolishing Class 2 National Insurance•
modernise the corporation tax rules on losses, making the system more flexible for•
reform Stamp Duty Land Tax on non-residential property transactions, cutting the tax for many small businesses purchasing property, with over 90% of non-residential transactions paying the same or less•
abolish the bureaucratic and burdensome Carbon Reduction Commitment energy efficiency scheme and replace it, in a revenue neutral way, with an increase in the Climate Change Levy from 2019•
support the oil and gas industry by permanently zero-rating Petroleum Revenue Tax, reducing the Supplementary Charge from 20% to 10% and introducing targeted measures toencourage investment in exploration, infrastructure and late-life assets
•
give large companies more time to prepare for a new corporation tax payments schedule, with a broadly neutral impact on the public financesOpportunity across the UK
To tackle the long term economic challenges in the UK, this Budget announces radical reforms that will drive future prosperity, investing in the infrastructure that will deliver economic growth for the next generation. The Budget drives forward the devolution revolution, giving local areas further control over the decisions that affect their communities.
Headline measures include:
•
strengthening city regions within Scotland and Wales by agreeing a City Deal for Cardiff and opening negotiations on deals for Swansea and Edinburgh•
agreeing new mayoral devolution deals with the West of England, East Anglia and Greater Lincolnshire as well as agreeing additional mayoral devolution deals with Greater Manchester and Liverpool City Region•
building the Northern Powerhouse, by giving the go ahead to High Speed 3 between Leeds and Manchester, aiming to bring down journey times from 50 minutes to around 30 minutes, investing an extra £161 million to accelerate the transformation of the M62, and £75 million to improve other road links across the North including the A66 and A69•
securing London’s future infrastructure by giving the green light for Crossrail 2 to proceed.The government will provide £80 million to develop the project with the aim of bringing forward a Hybrid Bill this Parliament
Budget decisions
Table 1: Budget 2016 policy decisions1
£ million
2016-17 2017-18 2018-19 2019-20 2020-21
Total tax policy decisions2 +645 -960 -470 +330 -2,760
Corporation Tax: defer bringing forward payment for large groups for two years
0 -6,000 -3,850 +5,965 +3,600
Total spending policy decisions -360 -590 -450 +7,620 +3,335
TOTAL POLICY DECISIONS +285 -7,550 -4,770 +13,915 +4,175
MEMO: TOTAL POLICY DECISIONS2 +285 -1,550 -920 +7,950 +575
1 Costings reflect the OBR’s latest economic and fiscal determinants.
2 This excludes the delay to the timing of corporation tax payments by larger groups. As it represents a cash-flow impact, the effect of this measure over the scorecard period is broadly neutral.
Government spending and revenue
Chart 1 shows public spending by main function. Total Managed Expenditure is expected to be around £772 billion in 2016-17.
Chart 1: Public sector spending 2016-17
Sources: Office for Budget Responsibility 2016-17 estimates. Illustrative allocations to functions are based on HMT analysis including capital consumption figures from the Office for National Statistics. Figures may not sum due to rounding.
Social protection £240bn
Personal social services £30bn
Health £145bn Transport £29bn
Education £102bn Defence £46bn Industry, agriculture and employment £24bn Housing and environment £34bn
Public order and safety £34bn Other including EU transactions £49bn
Chart 2 shows the different sources of government revenue. Public sector current receipts are expected to be around £716 billion in 2016-17.
Chart 2: Public sector receipts 2016-17
Source: Office for Budget Responsibility, 2016-17 forecast. Figures may not sum due to rounding.
Other (taxes) includes capital taxes, stamp duties, vehicle excise duties and other smaller tax receipts. Other (non-taxes) includes interest and dividends, gross operating surplus and other smaller non-tax receipts.
Income tax, £182 billion
National Insurance, £126 billion
Excise duties, £48 billion Corporation tax, £43 billion
VAT, £138 billion Business rates, £28 billion
Council tax, £30 billion
Other (non-taxes), £51 billion
Budget Report
1
The UK economy and public finances
Britain and the global economy
1.1 Britain is forecast to grow faster than any other major advanced economy in 2016.1 GDP in
Q4 2015 was 12.6% higher than it was in Q1 2010.2 But the challenges the country faces are
growing.
1.2 The global economic outlook has deteriorated since the Spending Review and Autumn Statement 2015. Both the International Monetary Fund (IMF) and the Organisation for Economic Cooperation and Development (OECD) have revised down their global forecasts for GDP in 2016. The IMF predicts global growth of 3.4% in 2016, 0.2 percentage points lower than its October forecast while the OECD forecasts growth of 3.0% in 2016, 0.3 percentage points below its November forecast.3, 4
1.3 These downgrades, which reflect a pattern of disappointing post-crisis growth in many countries, are partly driven by concerns over productivity growth. Christine Lagarde, Managing Director of the IMF, recently noted that weaker productivity growth – the rate the economy increases output per hour worked – and echoes of the financial crisis of 2008 and 2009, are still holding back global growth.5 Angel Gurria, Secretary-General of the OECD, said “Productivity
growth – a central ingredient in the pursuit of well-being – has been decelerating in a vast majority of countries”.6
1.4 All G7 economies have seen lower productivity growth since the financial crisis. The UK was hit hard by the financial crisis, and productivity fell 2.2% from its pre-crisis peak.7 Since 2012,
output per hour has grown each year and increased by 0.8% in 2015 to exceed its pre-crisis peak.
1.5 But as the Office for Budget Responsibility (OBR) says, with a period of weak productivity growth after the financial crisis continuing to lengthen, they have placed more weight on the post-financial crisis period as a guide to future prospects.
1 ‘Interim Assessment’, Organisation for Economic Co-operation and Development (OECD), February 2016.
2 All UK economy data from Office for National Statistics (ONS) unless otherwise stated. Further detail can be found in
‘Budget 2016 Data Sources’.
3 ‘World Economic Outlook Update’, International Monetary Fund (IMF), January 2016.
-0.5 0.0 0.5 1.0 1.5 2.0 2.5 3.0 3.5
2017 forecast 2016 forecast
2015 2014
UK US Canada Germany France Japan Italy
Chart 1.1: International comparison of GDP growth
Source: Organisation for Economic Co-operation and Development.
G7 annual growth, %
Global outlook
1.6 Prospects for key emerging markets have deteriorated recently. For 2016, the IMF forecasts growth in emerging markets to be 4.3%, compared to 4.7% a year ago.8 These economies face
a number of risks. As China rebalances towards domestic consumption, the emerging markets whose exports are geared to China’s previous manufacturing and investment-led growth are suffering. And after a decade of cheap debt, emerging markets are facing tighter credit conditions. Over $735 billion in capital flowed out of emerging markets last year.9
1.7 These concerns about growth prospects have been reflected in financial market volatility since the turn of the year. Global stock markets had their worst six-week start to the year for more than 45 years, with over $8 trillion wiped off world markets.10
1.8 Having fallen by 70% from June 2014 to December 2015, the price of oil fell further to $27 per barrel at the end of January 2016 and has averaged under $33 for the first two months of 2016.11 At the time of the Spending Review and Autumn Statement 2015, markets expected the
price of oil to rise gradually to $50 per barrel in early 2016. While a sustained fall in the oil price is a net benefit to oil importing economies like the UK, it impacts on particular sectors including the North Sea oil and gas industry. The speed and intensity of the falls in commodity prices in the last 18 months have increased financial stress and worsened the economic outlook for commodity exporters like Brazil, Russia and many countries in the Middle East.
1.9 The combination of lower global growth and cheaper oil has meant inflation has fallen across advanced economies, with every major central bank revising down its inflation forecast. As a result, market expectations of the timing of interest-rate rises have been pushed back.
8 ‘World Economic Outlook Update’, IMF, January 2016 and January 2015.
9 Capital Flows to Emerging Markets, Institute of International Finance, January 2016. 10 MSCI World Index and Bloomberg World Market Capitalisation Index.
1.10 Together, the prospects of weaker growth and inflation have reduced the outlook for GDP measured at current prices, i.e. nominal GDP. Global nominal GDP growth is estimated by the IMF to have been half the rate in 2015 that it was in 2007, making it harder to bring down debt-to-GDP ratios.12
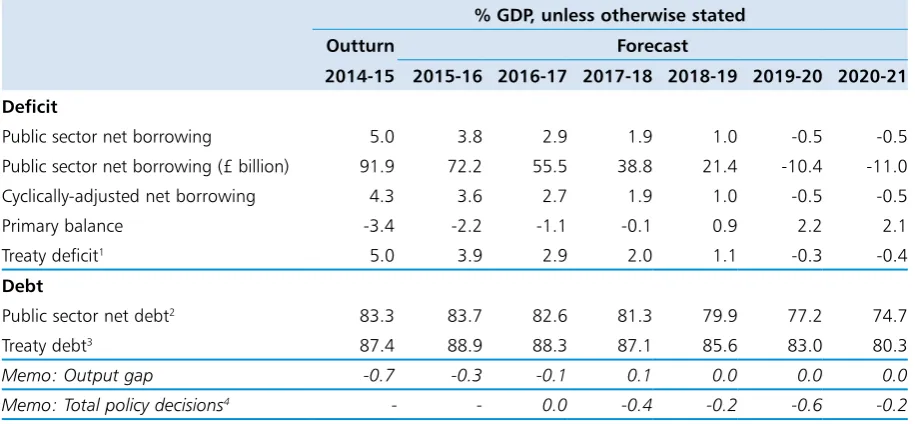
[image:14.595.79.524.170.397.2]OBR economic forecast
Table 1.1: Summary of the OBR’s central economic forecast1
Percentage change on a year earlier, unless otherwise stated Forecast
2015 2016 2017 2018 2019 2020
GDP growth 2.2 2.0 2.2 2.1 2.1 2.1
Main components of GDP
Household consumption2 2.9 2.4 2.2 2.1 2.0 1.9
General government consumption 1.7 0.2 0.6 0.5 0.2 0.7
Fixed investment 4.2 2.9 4.5 4.1 4.0 4.3
Business 4.7 2.6 6.1 5.8 5.5 4.4
General government3 2.2 0.2 1.9 -0.3 -0.2 6.5
Private dwellings3 3.4 5.1 2.8 3.0 3.0 2.9
Change in inventories4 -0.4 0.2 0.0 0.0 0.0 0.0
Net trade4 -0.5 -0.4 -0.1 -0.1 -0.1 -0.1
CPI inflation 0.0 0.7 1.6 2.0 2.1 2.0
Employment (millions) 31.2 31.6 31.7 31.9 32.0 32.1
LFS unemployment (% rate)5 5.4 5.0 5.0 5.2 5.3 5.3
1 All figures in this table are rounded to the nearest decimal place. This is not intended to convey a degree of unwarranted accuracy. Components may not sum to total due to rounding and the statistical discrepancy.
2 Includes households and non-profit institutions serving households. 3 Includes transfer costs of non-produced assets.
4 Contribution to GDP growth, percentage points. 5 Labour Force Survey.
Source: Office for Budget Responsibility, Office for National Statistics.
1.11 The UK is one of the most open trading economies in the world and is not immune to the weaker global outlook. And as in other major advanced economies, the UK’s productivity growth has been slower since the financial crisis. Combined, this means that the challenge of delivering a sustained rise in living standards following the financial crisis of 2008 and 2009 is greater here in the UK than the OBR previously forecast, with GDP growth, inflation and nominal GDP growth now forecast to be weaker than at the time of the Spending Review and Autumn Statement 2015.13
1.12 The OBR forecasts GDP growth to be 2.0% in 2016, rising to 2.2% in 2017 and 2.1% in 2018.
1.13 The main driver of the reduced GDP forecast is a lower forecast for potential productivity growth – the amount of output growth per hour worked the economy is capable of producing sustainably – with the OBR placing more weight on post-crisis weakness in productivity growth. Productivity is expected to grow by 1.0% in 2016 and 1.7% in 2017, before rising to 2.0% for the remainder of the forecast period.
12 ‘World Economic Outlook’, IMF, October 2015.
13 All forecasts refer to the Office for Budget Responsibility (OBR) ‘Economic and fiscal outlook’, March 2016, unless
1.14 Disappointing productivity growth is evident in many other major advanced economies in recent years, leading other forecasters to revise down their expectations. For example, Table 1.2 from the OBR ‘Economic and fiscal outlook’ March 2016, shows that OBR forecasts for potential productivity growth between 2010 and 2020 have been revised down by 7.5 percentage points. This is similar to the Congressional Budget Office (CBO) in the US which has reduced its forecast for potential productivity growth by 8.9 percentage points. The impact on potential GDP growth has been smaller in the UK, however, largely because the labour market participation rate has held up much more than in the US.
Table 1.2: Contributions to potential output growth between 2010 and 2020
Potential productivity1
Potential average hours
Potential participation rate2
Potential unemployment rate2,3
Potential population2
Potential output growth4 OBR estimates for the UK
June 2010 21.9 -2.0 -1.8 0.0 5.8 24.1
March 2016 14.4 -1.0 0.0 -0.2 6.7 20.6
Change -7.5 0.9 1.8 -0.2 0.9 -3.5
OBR calculations based on CBO estimates for the US
August 2010 24.3 -0.8 -3.0 0.0 9.5 30.8
January 2016 15.4 -0.6 -5.6 0.3 10.6 20.0
Change -8.9 0.2 -2.6 0.3 1.1 -10.8
1 Output per hour.
2 Corresponding to those aged 16 and over. 3 Percentage point growth between 2010 and 2020.
4 Changes may not sum due to rounding and interaction effects.
Note: Non-farm business employment forecasts are not available for the US, and so we have assumed that non-farm business employment grows at the same rate as whole economy employment.
Source: Office for Budget Responsibility.
1.15 The OBR predicts the UK’s strong labour market performance to continue. The OBR revised up its forecast for employment in 2016 from 31.5 million to 31.6 million, and in 2017 employment reaches 31.7 million. The OBR forecast employment to rise by 0.9 million by 2020, meaning that employment will have risen by 3 million since 2010. Wages and salaries are forecast to grow faster than inflation, rising by 3.6% in 2016, and thereafter by an average of 4.0% until 2020. The OBR forecasts CPI inflation to be below the 2.0% target in 2016 before returning to target in 2018.
Britain in a stronger position to face the challenge ahead
1.16 Since 2010, the government’s long-term economic plan has been focussed on ensuring sound public finances, while delivering the supply-side reforms necessary to improve long-term productivity. That has allowed active monetary policy to support the economy while ensuring the fiscal position is sustainable. As a result of the government’s action to date:
•
the public finances have improved. In 2010, the IMF forecast the UK to have the largest budget deficit in the G20, at 11.4% of GDP.14 As a result of the action that the governmenthas taken, the OBR forecast that the UK’s deficit as a share of GDP will be reduced by almost two-thirds to 3.8% of GDP in 2015-16
•
the financial sector is much more resilient. Since 2010, the government has legislated for the ring-fencing of large banks’ retail arms from their investment banking arms, insulating these core functions vital to households and SMEs, and put the Bank of England back in charge of bank prudential regulation. As the Governor of the Bank of England said, “UK banks are now significantly more resilient than before the global financial crisis. Capital requirements for the largest banks have risen ten-fold. Their holdings of liquid assets have increased four-fold. Their trading assets are down by a third, and inter-bank exposures have shrunk by two-thirds”15•
household finances are more robust. Debt-to-income ratios have fallen from 155% in Q1 2010 to 142% in Q3 2015. The share of households with very high mortgage debt-to-income ratios has been falling and is now back at levels seen in the 1990s.16 Interestpayments as a proportion of income were 4.8% in Q3 2015, the lowest on record and down from 6.3% in Q1 2010
1.17 The long-term economic plan has delivered considerable economic gains since 2010. The UK was the fastest growing major advanced economy in 2014, the second fastest in 2015 and the OECD forecast the UK to be the fastest growing in 2016.
Employment and earnings
Employment
1.18 Government action to reward work and reform benefits has delivered a stronger labour market in the UK, with an employment rate that has risen faster in the UK than in any other G7 country since 2010 making progress towards the government’s goal of full employment.17
The data for 2015 showed:
•
a record employment rate of 74.1% in Q4 2015•
the employment rate of women had risen to 69.1% by the end of 2015, a record high•
74% of the increase in employment in 2015 was driven by full-time workers•
high and medium skill occupations accounted for 92% of the growth in employment in the year to Q4 2015•
a strong demand for labour with 767,000 vacancies in Q4 2015, a record high•
the claimant count fell to a 40 year low in 2015•
working age inactivity fell by over 600,000 from 2010 to 201515 Mark Carney, Governor of Bank of England, Financial Stability Report Press Conference, December 2015. 16 Very high mortgage debt-to-income ratio is defined as a ratio greater than 500%. ‘Quarterly Bulletin 2015 Q4’,
Bank of England, December 2015.
Chart 1.2: International comparison of employment
-0.5 0.0 0.5 1.0 1.5 2.0 2.5 3.0 3.5 4.0
Percentage point change in rate, Q1 2010 to Q3 2015
Source: Organisation for Economic Co-operation and Development.
Italy France Canada US Germany Japan UK
Earnings
1.19 This strong employment performance has been accompanied by rising real wages (see Chart 1.2). Earnings growth picked up in much of 2015, with total annual pay rising 2.5% on the year in nominal terms, and 2.3% in real terms. This represents the highest annual growth in nominal and real earnings since 2008.
1.20 Wages had been rising above inflation for 15 consecutive months by the end of 2015. Living standards, as measured by real household disposable income (RHDI) per capita, are expected to have risen in 2015 at their fastest rate in 14 years, driven by rising earnings and low inflation.
1.21 The government has taken unprecedented action to support those on lower pay. From 1 April 2016, low wage workers aged 25 and above will see a pay rise as a result of the introduction of the National Living Wage (NLW). Initially set at £7.20, it will mean a £900 cash increase for a full-time worker on the current National Minimum Wage (NMW) – the largest annual increase in a minimum wage rate across any G7 country since 2009, in cash and real terms.18 2.9 million workers are expected to benefit directly, and the OBR estimated up to
6 million could see a pay rise as a result of a ripple effect causing pay to rise further up the earnings distribution.19
18 HMT calculations using OECD minimum wage statistics, 2016.
Source: Office for Budget Responsibility, Office for National Statistics. Chart 1.3: Real total pay growth
OBR forecast Real total pay growth outturn
3 month average, % year on year growth
-4 -3 -2 -1 0 1 2 3 4 5 6
2021 2020 2019 2018 2017 2016 2015 2014 2013 2012 2011 2010
Long-term solutions to long-term problems
1.22 Given the concerns over slowing growth in advanced economies, policymakers face a choice over how to respond. The OBR forecasts little spare capacity in the economy – as measured by the output gap – for the forecast period. This suggests that there is little benefit to policy increasing overall demand without taking measures to expand supply. Attempting to spend more than the country can afford would not address the challenges Britain faces.
1.23 In the UK, debt levels remain high. Short-term, discretionary fiscal stimulus would simply increase public debt without expanding supply.
1.24 Furthermore, the Monetary Policy Committee (MPC) forecasts inflation to return to the 2% target in the medium term. As the Governor of the Bank of England has recently said, “the G20 needs to use the time purchased by monetary policy to develop a coherent and urgent approach to supply-side policies”.20
1.25 The long-term solution is structural reform. These policies seek to make economies more efficient, competitive and productive. Both the IMF and OECD recognise that structural reform is needed to boost long-term growth.21 Their research shows that the most effective structural
reforms include lowering the rates of distortive taxes, ensuring that product markets are flexible and competitive, and cutting or simplifying business regulation.22 These policies are critical to
delivering sustainable growth for the next generation.
20 Mark Carney, Governor of the Bank of England, ‘Redeeming an unforgiving world’, G20 conference speech,
February 2016.
21 ‘World Economic Outlook’, IMF, October 2015; ‘Economic Outlook’, OECD, November 2015.
22 ‘Economic Growth and the Role of Taxation – Disaggregate Data’, OECD, 2009; ‘The New Normal: A Sector-Level
1.26 Since 2010 the government has acted to reform the supply side of the UK economy including by lowering taxes, cutting regulation, investing in infrastructure, and introducing the National Living Wage and Apprenticeship levy. The government set out comprehensive reforms to support productivity growth in ‘Fixing the Foundations: creating a more prosperous nation’.23
In October 2015 the National Infrastructure Commission was established to provide the government with expert independent advice on the country’s infrastructure needs.
1.27 This Budget announces further measures to drive productivity growth across the UK:
•
reducing distortive taxes by continuing to lower both income tax and business taxes•
improving education by accelerating fairer schools funding and committing to full academisation of schools in England•
promoting enterprise through business rate cuts for small businesses, cutting Capital Gains Tax and extending entrepreneurs’ relief to external investors in unlisted trading companies•
delivering long-term infrastructure improvements, by giving the green light to major projects recommended by the National Infrastructure Commission including Crossrail 2, and High Speed 3 between Leeds and Manchester•
improving economic decision-making by devolving power to cities and regions, including new devolution deals for the East and West of EnglandEconomic rebalancing
1.28 The financial crisis of 2008 and 2009 revealed an unstable and unbalanced model of economic growth in the UK. Since 2010 the government has taken steps to support more balanced growth across sectors and regions and to promote savings and investment.
Sector rebalancing
1.29 The UK is making progress in shifting towards high-value added sectors in both manufacturing and services. The manufacturing, construction and service sectors are now all larger than at the beginning of 2010. By the end of 2015, 62.6% of all employment growth since 2010 has been in high skilled occupations. Within manufacturing, aerospace production has grown by almost 30% and car production has increased by over 60% since the start of 2010. Between 2010 and 2014, 16,000 new jobs in car production have been created and in 2015 car manufacturing exports reached a record high.
1.30 Within services, output has been strong across different high-value added sectors. Scientific research and development has grown by 24.4% and architecture and engineering activities have grown by 42.5% since 2010. Rebalancing within the services sector has been particularly strong.
Chart 1.4: Rebalancing within the services sector
Source: Office for National Statistics.
Total service sector output Financial and insurance output
Professional, scientific and administrative output
2000 2002 2004 2006 2008 2010 2012 2014
Level indexed to 100 at Q1 2010
60 70 80 90 100 110 120 130 140 150
1.31 Investment in productive assets, from plant and machinery to software and patents, is vital for a thriving economy. During the financial crisis investment was hit hard in the UK, falling by 24%. Since then it has picked up, and investment grew faster than in any other major advanced economy in 2015 and is forecast by the OECD to continue to increase at the fastest rate in 2016 and 2017.24 Business investment has continued to pick up as the economy has recovered,
increasing by 25.8% since Q1 2010, more than twice as fast as household consumption. In 2015, business investment increased by 4.7% and it is now 4.2% higher than its pre-crisis peak.
Regional rebalancing
1.32 Regional economic disparities have long been a problem, with London and the South East having higher growth than the UK average for decades. The government is determined to rebalance the economy by building the Northern Powerhouse and the government’s devolution revolution is creating powerful elected mayors, allowing local governments to reduce and retain business rates, and giving local leaders across the country new powers and rewards for driving local growth.
1.33 Since 2010, unemployment in the North of England has fallen by a third and the median earnings of full-time employees grew faster in all regions of the North than they did in London.25
In 2015, employment grew faster in the North than the South and by the end of 2015, the employment rate in the North was at its highest on record, at 72.2%.
24 ‘Economic Outlook No 98’, OECD, November 2015.
25 The North is defined as the North East, North West, and the Yorkshire and the Humber regions. The South is defined
1.34 Between 2010 and 2015, labour markets in the regions have performed strongly. Unemployment fell and employment rose in every region, with two-thirds of the increase in employment from outside London and the South East. Labour markets in the regions strengthened in 2015, with every region reaching a record number of people in work.26 1.35 In 2015 there were over half a million more businesses outside London and the South East compared to 2010, including nearly 160,000 more businesses in the North and over 95,000 more businesses in the Midlands.27, 28 The South West has had the fastest rate of
business growth outside of London.
External rebalancing
1.36 The outlook for world trade continues to be revised down, reflecting both cyclical and structural factors. This weighs on the outlook for UK trade, as the external demand for UK exports is expected to be weaker. In 2015, the sum of UK exports and imports amounted to 57% of GDP, twice the US level. As an open economy, the UK is not immune to developments in the global economy. The OBR have revised down their outlook for UK export markets compared to their November forecast as the inevitable result of lower global growth.
1.37 The UK’s current account deficit has narrowed, falling to -3.7% in Q3 2015, but it remains high. This has been driven by a deterioration in the UK’s net investment income. This likely reflects the relatively strong performance of the UK economy compared to its trading partners, which has meant that the income earned on the UK’s overseas assets has been relatively weaker. The current account deficit is forecast to narrow gradually over the forecast period.
The UK and the EU
1.38 On 23 June, the British people will be asked whether they think the UK should remain a member of the EU or leave, in the first referendum on the UK’s membership of the EU since 1975. The government position is to recommend that Britain remains in a reformed EU.
Economic opportunities and risks linked to the UK’s membership of the
European Union
Membership of the EU has increased the UK’s openness to trade and investment, reinforcing the dynamism of the economy. The Treasury has highlighted openness as a key driver of productivity, wages and living standards.29 The UK’s full access to the single market, through
its EU membership, clearly increases the openness of the British economy, creating jobs and supporting livelihoods.
At the February 2016 European Council, the Prime Minister secured a new settlement for the UK in a reformed EU. The agreement covered four key areas: economic governance; competitiveness; sovereignty; and welfare and free movement. Together, the new settlement and the UK’s existing opt-outs from the single currency and common border-free area give the UK a special status in the EU.30
Voting to leave the EU would create a profound economic shock and years of economic uncertainty.31 Such a vote would be the start of a series of lengthy, interlocking negotiations
with the EU and with other international partners. The associated uncertainty would have a material effect on jobs, the economy and the public finances. Some of the concerns related to such an outcome are already becoming apparent in financial markets. In their discussion of external analysis of the impact of an exit from the EU the OBR conclude that “Leaving aside the debate over the long-term impact of ‘Brexit’, there appears to be a greater consensus that a vote to leave would result in a period of potentially disruptive uncertainty while the precise details of the UK’s new relationship with the EU were negotiated”.32
The UK’s current full access to the single market cannot be matched by any existing
alternative. UK firms and consumers enjoy tariff-free trade and reductions in non-tariff barriers across the EU. The UK is also inside the customs union, eliminating the need for customs compliance for trade between EU member states. None of the alternative arrangements with the EU would provide the same level of access, particularly for services, which accounts for 79% of the UK economy. A new relationship which gives the UK the access to the single market that it needs would involve contributing financially to the EU, accepting the free movement of people and adopting EU rules without having any say over them.
In their discussion of current risks and uncertainties the OBR highlight that “whatever the long-term pros and cons of the UK’s membership of the European Union, a vote to leave in the forthcoming referendum could usher in an extended period of uncertainty regarding the precise terms of the UK’s future relationship with the EU. This could have negative implications for activity via business and consumer confidence and might result in greater volatility in financial and other asset markets”.33 The OBR note that, reflecting their statutory
remit to prepare forecasts based on current government policy, it is not for them to judge at this stage what the impact of leaving the EU might be on the economy and public finances. Remaining in a reformed EU will make the UK stronger, safer and better off. It will allow a reformed EU to continue supporting UK productivity. And it will offer certainty for UK businesses and consumers and those foreign firms investing in the UK. As Christine Lagarde, the Managing Director of the IMF has made clear, a vote to leave the EU would create uncertainty in the UK: “no economic player likes uncertainty. They don’t invest, they don’t hire, they don’t make decisions in times of uncertainty.”34
29 ‘Fixing the foundations: creating a more prosperous nation’, HM Treasury, July 2015.
30 ‘The best of both worlds: the United Kingdom’s special status in a reformed European Union’, HM Government,
February 2016.
31 ‘The process for withdrawing from the European Union’, HM Government, February 2016. 32 ‘Economic and fiscal outlook’, OBR, March 2016.
33 ‘Economic and fiscal outlook’, OBR, March 2016.
1.39 The Treasury will set out a comprehensive assessment of the costs and benefits of membership of a reformed EU in the coming months.
Monetary policy and credit easing
1.40 The steps taken by the government to fix the public finances and put banks and household finances on a surer footing have allowed monetary policy to play an active role in supporting the recovery.
1.41 The MPC has full operational independence to set policy to meet the inflation target.
Budget 2016 reaffirms the inflation target of 2.0% for the 12-month increase in the CPI, which applies at all times.This target is symmetric, meaning deviations below the target are treated the same way as deviations above the target. Symmetric targets help to ensure that inflation expectations remain anchored and that monetary policy can play its role fully. The government also confirms the Asset Purchase Facility (APF) will remain in place for the financial year 2016-17.
1.42 Inflation was 0.3% in January, well below the 2.0% target. In February, as required by the MPC remit, the Governor of the Bank of England wrote to the Chancellor a fifth open letter setting out that the current low level of inflation predominantly reflects the effect of external inflationary pressure, citing falling food, energy and other goods prices as explaining ‘the vast majority of the deviation of inflation from the target’.35
1.43 Some measures of banks’ funding costs, in particular the price that banks pay in wholesale markets to fund lending to the wider economy, have increased in recent months. However, they remain much lower than at the time of the launch of the Funding for Lending Scheme (FLS) in 2012. The FLS will continue to support lending to small and medium-sized enterprises (SMEs) until 2018. Annual growth in the stock of lending to SMEs continues to improve, and reached 1.4% in January. This is up from a low of -4.5% in August 2012.36 Net lending to SMEs by
participants in the FLS extension was also positive for the fourth quarter in a row, at £0.6bn in Q4 2015.37
1.44 The government fundamentally restructured the UK’s system of financial regulation in 2013. As part of this, the government created the Financial Policy Committee (FPC) as the UK’s macroprudential authority, within the independent Bank of England. This macroprudential role did not feature in the regulatory architecture before the government took action. The FPC is responsible for identifying, monitoring and addressing risks to the system as a whole. In 2014 and 2015, the FPC undertook stress tests of the UK banking system. The FPC concluded that the UK’s banking system has become more resilient and has the capacity to maintain its core functions, including lending capacity, in these stress scenarios.38
35 Open letter from the Governor of the Bank of England to the Chancellor of the Exchequer, February 2016.
The government’s fiscal plan
1.45 Significant progress has been made since 2010 in fixing the public finances. In 2009-10, the government borrowed around £1 in every £4 it spent. In 2015-16 the government is forecast to borrow around £1 in every £10 it spends and this is expected to reduce to around £1 in every £14 in 2016-17.39
1.46 The deficit as a share of GDP is forecast to be cut by almost two thirds from its 2009-10 post-war peak and will reach 3.8% of GDP in 2015-16.40 The government has addressed the
rapid rise in public sector net debt (PSND) which more than doubled as a share of GDP between 2007-08 and 2011-12. Net debt as a share of GDP is forecast to fall over this Parliament, reaching 77.2% of GDP by the end of 2019-20.41
1.47 The public finances would be in a much worse position had the government not undertaken the fiscal consolidation that has occurred since 2010. Analysis in Chart 1.5 shows that the government would have borrowed an additional £930 billion over the period 2010-11 to 2019-20 compared to the outturn and the OBR forecast.42 This is calculated as the path
of public sector net borrowing if cyclically adjusted public sector net borrowing (the structural deficit) had been fixed as a share of GDP since 2009-10 at its 2009-10 level. The chart shows the cyclical improvement in the economy since 2009-10 which would have reduced public sector net borrowing from its post war peak of 10.3% of GDP. However, the persistence of the structural deficit means that borrowing would have been higher in every year from 2010-11.
Chart 1.5: Public sector net borrowing (PSNB) with and without fiscal consolidation
Outturn series (2009-10 to 2014-15) is published ONS data. Forecast series (2015-16 to 2019-20) is from OBR March 2016 Economic and Fiscal Outlook. PSNB without fiscal consolidation series (2009-10 to 2019-20) is HMT analysis which calculates the path of PSNB if cyclically-adjusted PSNB had been fixed as a share of GDP since 2009-10 at its 2009-10 level. GDP reflects ONS outturn data and OBR forecasts. Indirect effects of fiscal consolidation are not calculated.
Source: Office for National Statistics, Office for Budget Responsibility, HM Treasury analysis.
2009-10 2010-11 2014-15 2016-17 2018-19 2019-20
-2 0 2 4 6 8 10 12
2012-13
2011-12 2013-14 2015-16 2017-18
PSNB Outturn PSNB OBR forecast PSNB without fiscal consolidation
% GDP
39 ‘Public Sector Finances’, ONS, January 2016; ‘Economic and fiscal outlook’, OBR, March 2016. 40 ‘Public Sector Finances’, ONS, January 2016; ‘Economic and fiscal outlook’, OBR, March 2016. 41 ‘Public Sector Finances’, ONS, January 2016; ‘Economic and fiscal outlook’, OBR, March 2016.
42 ‘Public Sector Finances’, ONS, January 2016; ‘Economic and fiscal outlook’, OBR, March 2016 and HM Treasury
1.48 However more work needs to be done – the deficit and debt levels are still too high. The government remains committed to continuing the job of returning the public finances to surplus by 2019-20 and running a surplus thereafter in normal times so Britain bears down on its debt and is better placed to withstand future economic shocks. In a low inflationary environment, with the risk of economic shocks, the only reliable way to bring debt down as a share of GDP is to run a surplus.
1.49 This Budget sets out the action the government is taking to meet the fiscal mandate, achieving an overall surplus of £10.4 billion on the headline measure of public sector net borrowing in 2019-20 and a surplus of £11.0 billion in 2020-21.
1.50 Table 1.3 sets out the OBR forecast of the key fiscal aggregates at March Budget 2016.
1.51 At the Summer Budget 2015 and Spending Review and Autumn Statement 2015, the government set out detailed measures to secure a surplus in 2019-20. As a result of the revision in the OBR’s fiscal forecast, the government is taking action to ensure a surplus is still achieved in 2019-20. Table 2.1 shows £14 billion of new measures by 2019-20.
1.52 The government is maintaining a balanced pace of deficit reduction, with public sector net borrowing forecast to fall as a share of GDP at the same average annual rate over 2015-16 to 2019-20 as was achieved over 2010-11 to 2014-15.43
Fixing the public finances and achieving a surplus
Public spending
1.53 The government will build on the measures set out at Spending Review 2015 to deliver a surplus and ensure the sustainability of the public finances. Over the last five years government expenditure was reduced from the unsustainable level of 45% of GDP in 2010-11.44 Spending
[image:25.595.75.525.223.477.2]43 ‘Public Sector Finances’, ONS, January 2016, ‘Economic and fiscal outlook’, OBR, March 2016. 44 ‘Public Sector Finances’, ONS, January 2016.
Table 1.3: Comparison of key fiscal aggregates between Budget 2016 and Autumn Statement 2015
Outturn Forecast
2014-15 2015-16 2016-17 2017-18 2018-19 2019-20 2020-21 Public sector net borrowing (£ billion)
Budget 2016 91.9 72.2 55.5 38.8 21.4 -10.4 -11.0 Autumn Statement 20151 94.7 73.5 49.9 24.8 4.6 -10.1 -14.7
Change compared to Autumn Statement 2015
-2.8 -1.3 5.5 14.0 16.8 -0.3 3.7
Public sector net borrowing (% GDP)
Budget 2016 5.0 3.8 2.9 1.9 1.0 -0.5 -0.5
Autumn Statement 20151 5.2 3.9 2.5 1.2 0.2 -0.5 -0.6
Change compared to Autumn Statement 2015
-0.2 0.0 0.3 0.7 0.8 0.0 0.1
Public sector net debt (% GDP)2
Budget 2016 83.3 83.7 82.6 81.3 79.9 77.2 74.7 Autumn Statement 20151 83.1 82.5 81.7 79.9 77.3 74.3 71.3
Change compared to Autumn Statement 2015
0.2 1.3 0.9 1.4 2.6 2.9 3.4
1 Outturn figures for Autumn Statement are given as estimated at Autumn Statement. 2 Debt at end March. GDP centred on end March.
Review 2015 set out savings of £21.5 billion, of which £9.5 billion was reinvested in the government’s priorities. This Budget sets out that the government is adjusting those plans and will find a further £3.5 billion of savings from public spending in 2019-20, in line with continuing action to ensure maximum efficiency from every pound of public spending. This is equivalent to less than 0.5% of total spending, in 2019-20.
1.54 Total Managed Expenditure (TME) as a share of GDP will be 37.0% in 2019-20 and 36.9% in 2020-21.45 After the public finances move into surplus in 2019-20, total departmental
resource spending will grow in line with inflation from 2019-20 to 2020-21. Departmental spending will fall in real terms by an average of 0.9% per annum from 2015-16 to 2019-20, compared to 1.7% from 2010-11 to 2015-16.46
1.55 The government has already shown that savings can be delivered from spending while protecting core services and that a well-run state can do more for less – crime has fallen by more than a quarter since 2010, there are more young people going to study full time at university than ever before and record numbers of children are now taught in good or outstanding schools.47
Delivering further efficiency savings
1.56 The Chief Secretary to the Treasury, with the support of the Paymaster General, will lead an efficiency review, which will report in 2018. This will review the efficiency of all departmental spending to inform future expenditure decisions.
1.57 The government’s spending priorities remain unchanged. As set out in Spending Review 2015, the defence and overseas aid commitments, the real-terms protections for the NHS in England, schools funding in England, the police and science will be maintained. The NHS has an ambitious programme of work underway to deliver £22 billion of efficiency savings and this is unchanged.
Sound financial management
1.58 The government’s policy is to review the discount rate used to set employer contributions to the unfunded public service pension schemes every 5 years. The discount rate is based on the OBR’s long term projections of GDP growth. Budget 2016 sets out that the recent assessment has resulted in a reduction in the discount rate which will increase the contributions employers pay to the schemes from 2019-20 onward. This will ensure that the costs of providing pension benefits in the future are fairly reflected in the contributions paid by employers, and that the pension promises made today are on a sustainable basis to ensure fairness to future tax payers.
1.59 As set out in the Spending Review, the government will continue to meet the
commitment to spend 0.7% of Gross National Income (GNI) on Official Development Assistance (ODA) in every year of the Parliament. In line with the commitment, the ODA budget will be adjusted to reflect the latest economic forecasts, taking existing plans into account. The ODA budget will therefore be reduced by £650 million in 2019-20.
1.60 At Spending Round 2013, the government announced a control total to limit payments under PFI and PF2 contracts in nominal terms in each future Parliament. The control total is set at £70 billion and the Treasury is on track to meet this target, with forecast cumulative
45 ‘Economic and fiscal outlook’, OBR, March 2016.
46 HM Treasury analysis based on OBR Budget 2016 forecasts.
47 Crime Survey for England and Wales, ONS, April 2014.
spending from 2015-16 to 2019-20 for payments on all PFI and PF2 contracts funded by central government standing at £51.7 billion.48
Capital investment
1.61 The Spending Review prioritised long term investment over day-to-day spending. This Budget accelerates its commitment to invest £100 billion in infrastructure by 2020-21. The government is now accelerating its investment plans in priority areas to deliver around £1.5 billion investment in areas such as housing, schools and transport over the next three years that would otherwise have taken place at the end of the decade. This will include bringing forward funding for the Highways Maintenance Challenge Fund and the Pothole Action Fund, and enabling the delivery of thirteen thousand shared ownership homes two years early. As set out in Spending Review 2015, capital budgets will be £12 billion higher than planned at Summer Budget 2015.
Overview of the OBR central fiscal forecast
1.62 As a result of the measures the government is taking, the OBR forecast a surplus of £10.4 billion will be achieved in 2019-20. Table 1.4 sets out the OBR forecasts for key fiscal aggregates.
Performance against the government’s fiscal targets
1.63 The Charter for Budget Responsibility was approved by the House of Commons on 14 October 2015.49 It defines the government’s fiscal mandate as a surplus on the headline
measure of Public Sector Net Borrowing (PSNB) by 2019-20, maintaining a surplus in normal times thereafter. This is supplemented by a target for debt as a share of GDP to be falling in each year until 2019-20. The simplicity and clarity of the metrics ensure that governments will be held to account for their fiscal policy when the economy is performing well.
[image:27.595.70.528.342.554.2]48 ‘Private Finance Initiative and Private Finance 2 projects: 2015 summary data’, HM Treasury, March 2016. 49 ‘Charter for Budget Responsibility: autumn 2015 update’, HM Treasury, October 2015.
Table 1.4: Overview of the OBR’s central fiscal forecast
% GDP, unless otherwise stated
Outturn Forecast
2014-15 2015-16 2016-17 2017-18 2018-19 2019-20 2020-21 Deficit
Public sector net borrowing 5.0 3.8 2.9 1.9 1.0 -0.5 -0.5 Public sector net borrowing (£ billion) 91.9 72.2 55.5 38.8 21.4 -10.4 -11.0 Cyclically-adjusted net borrowing 4.3 3.6 2.7 1.9 1.0 -0.5 -0.5 Primary balance -3.4 -2.2 -1.1 -0.1 0.9 2.2 2.1 Treaty deficit1 5.0 3.9 2.9 2.0 1.1 -0.3 -0.4
Debt
Public sector net debt2 83.3 83.7 82.6 81.3 79.9 77.2 74.7
Treaty debt3 87.4 88.9 88.3 87.1 85.6 83.0 80.3
Memo: Output gap -0.7 -0.3 -0.1 0.1 0.0 0.0 0.0
Memo: Total policy decisions4 - - 0.0 -0.4 -0.2 -0.6 -0.2
1 General government net borrowing on a Maastricht basis. 2 Debt at end March; GDP centred on end March. 3 General government gross debt on a Maastricht basis. 4 Equivalent to the ‘Total policy decisions’ line in Table 2.1.
1.64 Under the updated Charter, the surplus rule will be suspended if the economy is hit by a significant negative shock (defined as 4 quarter-on-4 quarter GDP growth below 1%). This provides flexibility to allow the automatic stabilisers to operate freely when needed. Following a shock, the government of the day will be required to set a plan to return to surplus, including appropriate fiscal targets. The framework does not prescribe what the targets should be, allowing the government of the day to respond to the circumstances. However, the targets will be voted on by the House of Commons and assessed by the OBR.
1.65 The OBR’s March 2016 ‘Economic and fiscal outlook’ provides an assessment of the government’s performance against its fiscal targets. It confirms the government is on track to meet its fiscal mandate, achieving a surplus of £10.4 billion on the measure of public sector net borrowing in the target year of 2019-20 and to maintain a surplus in the following year, 2020-21.50 The OBR’s judgement is that the government’s policies are more likely than not to achieve
the mandate in 2019-20.51
Chart 1.6: Public sector net borrowing (PSNB)
Source: Office for National Statistics and Office for Budget Responsibility.
% GDP
-2 0 2 4 6 8 10 12
2009-10 2010-11 2011-12 2012-13 2013-14 2014-15 2015-16 2016-17 2017-18 2018-19 2019-20 2020-21
PSNB OBR forecast PSNB outturn
1.66 The fiscal mandate is supplemented by a target for public sector net debt to be falling as a share of GDP in each year to 2019-20. Chart 1.7 shows PSND as a percentage of GDP. Public sector net debt is forecast to fall from 2016-17 to the end of the Parliament, reaching 77.2% of GDP by the end of 2019-20.52 The OBR forecasts that the level of cash debt at the end of
2015-16 will be £1591 billion, down from £1599 billion in its November forecast. Debt as a share of GDP is forecast to rise to 83.7% of GDP at the end of 2015-16 because the economy is smaller in nominal terms in 2015-16 than forecast in November, largely due to lower inflation. The government has also delayed the sale of the remaining shares in Lloyds Banking Group as a result of market conditions.53
60 65 70 75 80 85 90
Chart 1.7: Public sector net debt (PSND)
Source: Office for National Statistics and Office for Budget Responsibility.
PSND OBR forecast PSND outturn
% GDP
2009-10 2010-11 2011-12 2012-13 2013-14 2014-15 2015-16 2016-17 2017-18 2018-19 2019-20 2020-21
1.67 The government remains committed to bringing the UK’s Treaty deficit in line with the 3% target set out in the Stability and Growth Pact. The OBR’s forecast indicates that this target will be met in 2016-17.
Welfare Cap
1.68 The government introduced the Welfare Cap at Budget 2014 to strengthen control of welfare spending, support fiscal consolidation and improve Parliamentary accountability for the level of welfare spending. The cap applies to welfare spending in Annually Managed Expenditure (AME) with the exception of the state pension and the automatic stabilisers. It is assessed at Autumn Statements.
1.69 Summer Budget 2015 and Autumn Statement 2015 announced reforms to ensure that the welfare system is both fair and sustainable. The Welfare Reform and Work Bill legislates for the majority of these reforms. As announced by the Secretary of State for Work and Pensions, the Department for Work and Pensions (DWP) will continue to deliver Personal Independence Payments (PIP) in line with their original intention of supporting claimants with the greatest need in helping them meet the extra costs of their disability or long-term health condition. Spending in 2015-16 on PIP and its predecessor, the Disability Living Allowance, is expected to be over £3 billion higher in real terms than in 2009-10.54 Spending on these benefits is forecast to be
higher in real terms in 2019-20 than in 2009-10.
1.70 The government’s intention is for the cap to be met by the end of the Parliament when the OBR conducts its next assessment at Autumn Statement 2016.
54 ‘DWP Benefit Expenditure and caseload tables for Autumn Statement 2015, ‘Economic and fiscal outlook’ OBR,
1.71 The Charter for Budget Responsibility requires the Treasury to set out the level of the welfare cap in the Budget Report. This is in Table 1.5. OBR forecasts of the level of welfare spending are set out in the ‘Economic and fiscal outlook’, March 2016.
Table 1.5: The welfare cap
£ billion
2016-17 2017-18 2018-19 2019-20 2020-21
Welfare cap set at Summer Budget 2015 115.2 114.6 114.0 113.5 114.9
Forecast Margin (2%) 2.3 2.3 2.3 2.3 2.3
Source: HM Treasury
Financial sector and other state-owned asset sales
1.72 The government is committed to returning the financial sector assets acquired in 2008-09 to the private sector. As there is no longer a policy need for the government to hold these assets, it will seek to dispose of them, reducing PSND while maximising value for taxpayers.
1.73 Since 2010, the government has recovered over £75 billion, including further progress in 2015-16 in getting taxpayers’ money back.55 This included:
•
£2.1 billion from an initial sale of Royal Bank of Scotland (RBS) shares in August 201556•
approximately £7.5 billion through the continuation of the Lloyds Banking Group tradingplan57
•
receipt of the final payment of £740 million from the Landsbanki estate in Iceland58 and•
a further £5.1 billion in payments received from our holdings in UK Asset Resolution(UKAR).59
1.74 Decisions on disposals will be made taking into account market conditions and value for money.
1.75 The government is committed to launching a retail sale of Lloyds Banking Group shares and to fully returning its stake to the private sector in 2016-17.UK taxpayers’ money was used to bail out the banks, so it is right to give the public the opportunity to invest in Lloyds Banking Group. The government will shortly receive the final payment from RBS of £1.2 billion for the retirement of the Dividend Access Share (DAS), and it continues to seek further opportunities to dispose of its holding in RBS.60 From both the DAS and share disposals, the
government expects to raise up to £25 billion from RBS by the end of 2019-20.
1.76 Following the recent successful sale of £13 billion of former Northern Rock mortgages, the Treasury, UK Financial Investments (UKFI) and UKAR have been exploring further sales of UKAR mortgages: in particular, a programme of sales designed to raise sufficient proceeds for Bradford & Bingley (B&B) to repay the £15.65 billion debt to the Financial Services Compensation
Scheme (FSCS) and, in turn, the corresponding loan from the Treasury.61 It is expected that this
programme of sales will have concluded in full before the end of 2017-18.
55 ‘Economic and fiscal outlook’, OBR, March 2016.
56 ‘Government begins sale of its shares in the Royal Bank of Scotland’, HM Treasury, 4 August 2015, available on
www.gov.uk
57 ‘Chancellor extends Lloyds trading plan’, HM Treasury, 4 December 2015, available on www.gov.uk.
58 ‘UK authorities receive final payment from Icesave’, HM Treasury, 15 January 2016, available on www.gov.uk. 59 ‘Economic and fiscal outlook’, OBR, March 2016.
60 ‘Economic and fiscal outlook’, OBR, March 2016.
61 HMT, UKFI and UKAR have received ‘highly confident’ letters from a consortium of the main Financial Services
1.77 The government is making progress towards achieving a further £5 billion of corporate and financial asset sales by March 2020. The process to transfer the Green Investment Bank to private ownership has begun and the government will shortly consult on options to move the operations of the Land Registry to the private sector. In addition, the government is continuing to pursue the sale of the pre-2012 income contingent repayment student loan book, with a first sale in 2016-17.
Debt and reserves management
1.78 The Official Reserves, which include the government’s foreign currency assets, were $134 billion in February 2016, almost 90% larger than in June 2010.62 This reflects a total of
£42 billion of additional financing provided for the reserves since 2010 and changes in the market prices of the assets held. The government will provide £6 billion of sterling financing for the Official Reserves in 2016-17.
1.79 The government’s financing plans for 2016-17 are summarised in Annex A. They are set out in full in the ‘Debt management report 2016-17’, published alongside the Budget.
Support for working people
1.80 The Budget puts the next generation first, providing security and opportunity from childhood to working age and through to retirement. This means building an economy based on lower taxes, so that people can take home more of what they earn. It also means investing in education to equip the next generation for the future, tackling childhood obesity and investing in school sports. It means building the housing Britain needs and it means providing the next generation with better incentives to save, and more choice and flexibility as they do so. It means delivering on the government’s aim to reach full employment, increasing wages so that more people are in work and earning more.
1.81 The Budget continues to reform public services in a way that is fair. The policies of this government mean that the richest are paying an increasing share of taxes, with those lower down the income distribution continuing to pay less. Distributional analysis published today confirms that half of public spending continues to go to the poorest 40% of households, and that the richest 20% will pay over half of taxes in 2019-20.63 In addition, the richest 1% paid
over 28% of all income tax revenue in 2013-14 – a higher proportion than in any year of the last two decades.64
Lower tax society: cutting tax for working people
1.82 The government is determined to support those in work by continuing to cut taxes and has committed to raise the personal allowance to £12,500, and the higher rate threshold to £50,000 by the end of this parliament.
1.83 The personal allowance will be 70% higher in April of this year than in 2010-11.65 At Budget 2016, the government takes another significant step towards this commitment, by increasing the personal allowance from £11,000 in 2016-17 to £11,500 in 2017-18. This continues to ensure that no-one working 30 hours per week on the National Minimum Wage (NMW) will pay income tax in 2017-18, and will bring the total number of taxpayers taken out of income tax since the start of this parliament to 1.3 million.66
As a result, a typical basic rate taxpayer will pay over £1,000 less income tax in 2017-18 than in 2010-11.67
1.84 The government also wants to ensure that the tax system encourages individuals to progress. At Summer Budget 2015 the government announced that the higher rate threshold would rise from £42,385 in 2015-16, to £43,000 in April this year.
1.85 This Budget goes further. The government will increase the higher rate threshold by £2,000 to £45,000 in 2017-18. This will be the biggest above inflation cash increase to this threshold since it was introduced by Lord Lawson in 1989.68 This delivers the government’s
ambition to reverse the trend whereby an increasing number of individuals are faced with paying the higher rate. In 2017-18, there will be 585,000 fewer higher rate taxpayers than at the start of the parliament.69
63 Impact on Households: distributional analysis to accompany Budget 2016, available at gov.uk. 64 HMRC Personal Income Statistics, 2013-14.
65 HM Treasury analysis based on personal tax parameters, ONS CPI series, HMRC analysis based on Survey of Personal
Incomes (SPI) 2013-14 data and Budget 2016 OBR forecasts.
66 HM Treasury analysis based on personal tax parameters, ONS CPI series, HMRC analysis based on Survey of Personal
Incomes (SPI) 2013-14 data and Budget 2016 OBR forecasts.
67 HM Treasury analysis based on perso