DISSERTATION ON
A STUDY ON THE PREVALENCE OF METABOLIC
SYNDROME AND ITS VASCULAR COMPLICATIONS IN
ELDERLY WITH METABOLIC SYNDROME WITH
OR WITHOUT DIABETES
Submitted in partial fulfilment of
Requirements for
M.D. DEGREE BRANCH I GENERAL MEDICINE
Of
THE TAMILNADU DR.M.G.R. MEDICAL UNIVERSITY, CHENNAI
MADRAS MEDICAL COLLEGE
CHENNAI – 600 003.
CERTIFICATE
This is to certify that this dissertation entitled “A STUDY ON
THE PREVALENCE OF METABOLIC SYNDROME AND ITS
VASCULAR COMPLICATIONS IN ELDERLY WITH
METABOLIC SYNDROME WITH OR WITHOUT DIABETES”
submitted by Dr. ARAVINDH, M. appearing for Part II M.D.
Branch I General Medicine Degree examination in September 2006
is a bonafide record of work done by him under my direct audience
and supervision in partial fulfillment of regulations of the Tamil
Nadu Dr. M.G.R. Medical University, Chennai. I forward this to the
Tamil Nadu Dr.M.G.R. Medical University, Chennai, Tamil Nadu,
India.
Director (I/C)
Institute of Internal Medicine,
Government General Hospital,
Dean,
Madras Medical College,
Government General Hospital,
Unit Chief,
DECLARATION
I solemnly declare that the dissertation titled “A STUDY ON THE
PREVALENCE OF METABOLIC SYNDROME AND ITS VASCULAR
COMPLICATIONS IN ELDERLY WITH METABOLIC SYNDROME
WITH OR WITHOUT DIABETES” is done by me at Madras Medical
College & Govt. General Hospital, Chennai under the guidance and
supervision of Prof. V. Sundaravadivelu, M.D
The dissertation is submitted to The Tamilnadu Dr. M.G.R.
Medical University towards the partial fulfilment of requirements for
the award of M.D. Degree (Branch I) in General Medicine.
Place:
Date:
Dr. ARAVINDH, M. M.D. General Medicine Postgraduate Student
ACKNOWLEDGEMENT
With extreme gratitude, I express my indebtedness to my
beloved chief and Director-in charge, Institute of Internal Medicine,
Prof. V. Sundaravadivelu, M.D., for his motivation, advice and
valuable criticism, which enabled me to complete this work.
I express my sincere thanks to our beloved Dean Dr. Kalavathy
ponniraivan M.D., Madras Medical College and Government General
Hospital for permitting me to initiate this study and rendering
constant support throughout the study.
I am extremely thankful to Assistant Professors of Medicine
Dr. K. Siva Subramanian, M.D., and Dr. G. subburagavalu, M.D., for
their co-operation and guidance
I thank Dr. Mary Ramola M.D., Assistant Professor, Institute
of Social and Preventive medicine, Madras Medical College for her
I thank all Professors, Assistant Professors, and Post-graduates
of Institute of Biochemistry for their valuable support in biochemical
analysis.
I would always remember with extreme sense of thankfulness
for the co-operation and criticism shown by my Postgraduate
colleagues.
I am immensely grateful to the generosity shown by the
patients who participated in this study. If at all, this study could
contribute a little to relieve them from their suffering I feel that I
CONTENTS
Sl. No. Title Page No.
1. Introduction 1
2. Objectives of the study 3
3. Review of Literature 4
4. Materials and Methods 41
5. Statistical analysis 47
6. Observations 48
7. Charts
8. Discussion 54
9. Conclusion 59
10. Scope for future studies 61
11. Proforma
12. Master chart
13. Abbreviations
INTRODUCTION
The concept of the metabolic syndrome has existed for at least
80 years.1 Initially constellation of risk factors like hypertension,
hyperglycemia, and gout were included as a component of metabolic
cardiovascular risk factor by Kylin in 1920.2 Later, in 1947, Vague found
that upper body (android) adiposity was associated with metabolic
abnormalities associated with type 2 diabetes and cardiovascular disease.3
Later constellation of metabolic abnormalities includes glucose
intolerance (type 2 diabetes, impaired glucose tolerance, or impaired
fasting glycaemia), insulin resistance, central obesity, dyslipidaemia,
and hypertension as a component of metabolic syndrome, which is also
known as syndrome X,4 or Insulin resistance syndrome.5
Subsequently, the National Cholesterol Education Program
Adult Treatment Panel 3 have formulated definition of metabolic
syndrome includes the essential components-glucose intolerance,
obesity, hypertension, and dyslipidaemia which provide a tool for
Both metabolic syndrome and diabetes are associated with
increased prevalence of cardiovascular disease when they co-exist. We
examined the role of metabolic syndrome alone without diabetes as a
THE OBJECTIVES OF THE STUDY
1. To estimate the prevalence of metabolic syndrome in the elderly
2. To estimate the prevalence of vascular diseases (coronary heart
disease/ stroke/ peripheral arterial disease) in elderly with the
metabolic syndrome with or without diabetes when compared with
subjects without metabolic syndrome.
3. To estimate whether metabolic syndrome alone without diabetes is
an independent risk factor for vascular diseases in elderly.
4. To find the strength of correlation of metabolic syndrome
REVIEW OF LITERATURE
METABOLIC SYNDROME
The concept of metabolic syndrome is the most significant
development in the management of CV disease for the past two
decades. There is clearly an association of insulin resistance (IR) and
hyperinsulinemia with metabolic risk factors that are involved in the
etiology of atherosclerotic disease.
IR syndrome provides an important concept for screening and
aggressively treating patients for multiple CV risk factors with a
variety of drugs some of which are efficacious in the treatment of
insulin resistance itself.
Insulin resistance represents a major underlying abnormality
driving cardiovascular disease, the major cause of morbidity and
mortality globally. Previously physicians often treated co-existing
considering the impact of treatment for one on the other. Gerald
Reaven drew attention to a constellation of features associated with
coronary heart disease.7
Currently, insulin resistance is defined clinically as the inability
of a known quantity of exogenous or endogenous insulin to increase
glucose uptake and utilization in an individual as such as it does in a
normal population.
Components of metabolic syndrome
:Resistance to insulin-stimulated glucose uptake
Glucose intolerance
Hyperinsulinemia
Increased VLDL triglyceride
Decreased HDL cholesterol
Hypertension
Central obesity
Microalbuminuria
Hyperleptinemia
Hyperuricemia
Insulin resistance and Diabetes
Genes and the environment play a role in the development of
type 2 diabetes. The early prediabetic phase begins in young adulthood
and can be identified as insulin resistance in peripheral tissues.
Initially, insulin levels are elevated in response to the resistance, but as
glucose desensitization develops, insulin secretion decreases. This
eventually leads to clinical non-insulin— dependent diabetes.
Both the insulin resistance and the decreased insulin secretion
are genetically programmed. This program is modified by a variety of
environmental factors, especially diet and activity.8 overt diabetes will
develop when insulin cannot be increased to overcome insulin
resistance. In comparison with thin patients, many obese patients
without diabetes produce 5 to 8 times more insulin (500 U/day) to
Insulin resistance and Obesity
Several large studies provide convincing evidence of the link
between obesity per se and coronary heart disease. More recently, in the
analysis of the Nurses’ study, a body mass index of 25— 28.9 was
associated with a twofold increase in CV disease; the risk rose to almost
fourfold once the BMI exceeded 29.9 Strong evidence now links obesity
with left ventricular hypertrophy, hypertension, alterations in haemostatic
factors, and alteration in lipid profiles.10 Visceral adiposity plays a greater
role in the development of diabetes, IGT, and atherosclerosis than
generalized obesity. Regional adiposity is closely associated with
morbidity and mortality than general obesity.
San Antonio Heart Study
A combination of three or more risk factors for CHD in the same
cardiac patient was more prevalent than either one factor alone or two
factors in combination. Hyperinsulinemia might provide the common
etiologic link. This forms one of the epidemiological evidence of
Clinical diagnosis of metabolic syndrome
Risk Factor Defining Level
Abdominal Obesity (waist circumference)
Men >102 cm (40 inch)
Women > 88 cm (32 inch)
Triglycerides ≥150mg/dl (1.7mmol/L)
HDL cholesterol Men
< 40 mg/dl (1.0 mmol/L)
HDL cholesterol Women
< 50 mg/dl (1.1 mmol/L)
Blood Pressure ≥130 / 85 mmHg
Fasting Plasma glucose ≥110 mg/dl Diagnosis is established when >3 of these
risk factors are present
International Association for the study of obesity and the
International Obesity Task Force redefined overweight as BMI >23
and obesity as BMI >25 in Asians. Central obesity was defined as >80
METABOLIC SYNDROME AND DIABETES
Today, India has a primary position in the global diabetes
epidemiology map as it is the home of nearly 33 million diabetic
subjects which is the highest number in the world. This is both, due to
a rising prevalence of the disease and the large population in the
country. Initially study conducted by the ICMR showed prevalence
was 3%. But there was gradual increase in prevalence of diabetes.
A recent study in Southern India showed that the prevalence had
increased from 2.1% to 6.3%12.This increase in mainly contributed by
the urban population which has undergone significant changes in the
lifestyle pattern.
The preclinical stages of diabetes, impaired fasting glucose
(IFG) and impaired glucose tolerance (IGT) are also steadily
increasing. It indicates the potential for a future increase in diabetes as
these conditions deteriorate when the environmental factors are
The major risk factors associated with diabetes are positive
family history, age, obesity, especially upper body adiposity, physical
inactivity and insulin resistance. Urban environment increases obesity,
physical inactivity and causes unhealthy diet habits all of which lead to
increased insulin resistance. Indians have a racial predisposition and a
high familial aggregation of diabetes, effect of which is precipitated by
the above environmental factor.
A series of studies have indicated that Indians have several
peculiar features such as low risk thresholds for susceptibility for
diabetes. These include a young age at onset, low normal range for
body adiposity < 23.0 kg/m2, presence of central adiposity despite
having normal and high insulin resistance.
Indian have a high genetic susceptibility for diabetes and the
above factors act adversely in such individuals. Because of the above
facts screening for the metabolic syndrome is essential in preventing
Dysglycemia is commonly associated with the metabolic
syndrome, characterized by the clustering of CHD risk factors like
obesity, hypertension and dyslipidaemia in a single individual. These
risk factors increase the risk of development of type 2 diabetes and
also have a multiplicative effect on the risk for development of CHD.
Recognition and treatment of the metabolic syndrome would help in
prevention of type 2 diabetes and CHD.
The normal values proposed by the American diabetes
association is as follows
Category Fasting Plasma Glucose
(mg/dl)
2hr Post Glucose Plasma glucose (mg/dl)
Normal < 110 < 140
IFG 110 - 125 < 140
IGT < 110 140-199
Impaired fasting glucose
The IFG denotes an abnormally high fasting glucose
concentration which falls short of diagnosis of diabetes (plasma
glucose 110-125 mg/dl.13 The defects in insulin action in glucose
metabolism include deficiencies in the ability of the hormone to
suppress glucose production by the liver and kidney, and to mediate
glucose uptake and metabolism in insulin sensitive tissues (i.e., muscle
and adipose tissue).
The relation between impaired fasting glucose or impaired
glucose tolerance and insulin resistance is well supported by human,
non-human primate, and rodent studies to compensate for defects in
insulin action, insulin secretion and/or clearance must be modified to
sustain euglycaemia. If this compensation fails, a defect in insulin
secretion predominates.
Insulin resistance in pancreatic islet beta cells implies that,
signals that generate glucose-dependent insulin secretion have been
free fatty acids can stimulate insulin secretion; increasing and
prolonged exposure to excessive concentrations results in fall in
insulin secretion.14 The mechanism for this alteration has been
attributed to lipotoxicity through several potential different
mechanisms.15
IGT and IFG are not synonymous in terms of pathophysiology
and in the development of the long term complications. The term
prediabetes is a practical and convenient term for impaired fasting
glucose and impaired glucose tolerance, which places individuals at
risk of developing diabetes and its complications. Both IGT and IFG
appear well before type 2 diabetes is diagnosed thereby presenting an
opportunity for intervention to reduce the future burden of diabetes.
Not all individuals with prediabetes will necessarily progress to
diabetes. A significant proportion of people who are diagnosed with
IGT will revert to normoglycemia. IFG and IGT are associated with
the metabolic syndrome which includes obesity, dyslipidaemia of the
Identifying people with prediabetes particularly in the context of
the metabolic syndrome indicates those who would benefit from
cardiovascular risk modification. While people with isolated IFG/IGT
do not have risk for micro vascular disease, they have a higher risk for
the development of diabetes and cardiovascular disease.
IGT is more strongly associated with CHD outcomes. However,
individuals identified as having both IFG and IGT are at higher risk for
diabetes as well as CHD. Lifestyle interventions have been shown to
be highly effective in delaying or preventing the onset of diabetes in
people with IGT.
In the NHANES III data, it was found that impaired fasting
glucose had twice the prevalence of CHD compared with normal
glucose levels and diabetes had three times the prevalence.16
In a recent study from North India the prevalence of IFG was
found to be 11.7% in the population. Individuals with IFG had a
clustering of cardiovascular risk factors and the prevalence of the
group with IFG compared with 16% in those with normoglycemia
(p<0.001).17
The major risk factors (cigarette smoking, hypertension and
dyslipidaemia) contribute to the cardiovascular risk in diabetic
populations. For each CHD risk factor analyzed in the MRFIT trial the
risk of CHD was approximately three-fold greater in the diabetic than
in the non-diabetic population.18
METABOLIC SYNDROME AND DYSLIPIDAEMIA
NATIONAL CHOLESTEROL EDUCATION GUIDLINE classify the
lipids and their normal values are
Classification of plasma lipids
Total cholesterol (mg/dl)
< 200 - Desirable
200 – 239 - Borderline high
HDL cholesterol (mg/dl)
< 40 - Low (<50 for Females)
> 60 - High
LDL cholesterol (mg/dl)
< 100 - Optimal
100 – 129 - Near optimal
130 – 259 - Borderline high
160 – 189 - High
≥ 190 - Very high
Triglycerides (mg/dl)
< 150 - Normal
150 – 199 - Borderline high
200 – 499 - High
≥ 500 - Very high
In general, with increases in free fatty acid flux to the liver,
increased production of apo B containing triglyceride rich VLDL
of insulin resistance, increased flux of free fatty acids to the liver
increases hepatic triglyceride synthesis; but under physiological
conditions, insulin inhibit VLDL secretion into systemic circulation.20
This response in part is an effect of insulin on the degradation of apo
B. Yet insulin is also lipogenic, increasing transcription of many genes
related to triglyceride biosynthesis.
Additionally, insulin resistance could also reduce the
concentration of lipoprotein lipase in peripheral tissues (i.e. in adipose
tissue more than muscle).21 This alteration in lipoprotein lipase,
however contribute less to the hypertriglyceridemia than does the
overproduction of VLDL. Nevertheless hypertriglyceridemia is an
excellent reflection of insulin resistant condition and is an important
diagnostic criterion for metabolic syndrome.
The other major lipoprotein disturbance in the metabolic
syndrome is a reduction in HDL cholesterol. This reduction is a
consequence of changes in HDL composition and metabolism. In the
presence of hypertriglyceridemia, a decrease in the cholesterol content
lipoprotein core with variable increases in triglyceride making the
particle small and dense, a function in part of cholesteryl ester transfer
protein.22 This change in lipoprotein composition also results in an
increased clearance of HDL from the circulation.23 The relation of
these changes in HDL to insulin resistance is probably indirect, arising
in concert with the changes in triglyceride-rich lipoprotein metabolism.
In addition to HDL, the composition of LDL is also modified in
similar way. In fact, with fasting serum triglycerides > 2 mmol/l,
almost all patients have a predominance of small dense LDL.24 This
change in LDL composition is attributable to relative depletion of
unesterified and esterified cholesterol, and phospholipids with either
no change or an increase in LDL triglyceride.25
Small dense LDL is more atherogenic than buoyant LDL
because it is more toxic to the endothelium; it is more able to transit
through the endothelial basement membrane; it adhere well to
glycosaminoglycans; it has increased susceptibility to oxidation; it is
In some studies this alteration is an independent risk factor for
cardiovascular disease.27 However most of the time it is related to
concomitant changes in other lipoproteins and other risk factors.28
Dyslipidaemia is present in over 50% of the diabetic population
and constitutes a major risk factor for CHD, particularly as it persists
despite the treatment of hyperglycemia. Diabetic dyslipidaemia is
characterized by moderate hypertriglyceridemia and low levels of HDL
cholesterol. The levels of total cholesterol and LDL cholesterol are
similar to that in the non-diabetic population. However, the
distribution of LDL particles in diabetic subjects is shifted towards
smaller denser particles that are thought to be particularly atherogenic.
Hypertriglyceridemia is a major determinant of the distribution
of LDL particles - the higher the fasting triglyceride level, the greater
the preponderance of the small dense LDL in the total LDL
Triglycerides are also associated with increased concentration
of important procoagulant factors such as plasminogen activator
inhibitor- 1. Thus elevated triglyceride levels directly influence the
thrombus formation.
Non-HDL cholesterol (Total cholesterol- HDL cholesterol) is a
secondary goal of therapy in patients with triglycerides > 200 mg/dl
and therapeutic cutoff point for non-HDL cholesterol are 30mg/dl
more than for LDL cholesterol.
.
METABOLIC SYNDROME AND HYPERTENSION
The relation between insulin resistance and hypertension is well
established,30 And relates to several different mechanisms. First, it is
important to note that insulin is a vasodilator when given intravenously
to people of normal weight,31 with secondary effects on sodium
reabsorption in the kidney.32 Evidence indicates that sodium
reabsorption is increased in white people but not Africans or Asians
vasodilator effect of insulin can be lost, 34 but the renal effect on
sodium reabsorption preserved.35
Fatty acids themselves can mediate relative vasoconstriction.36
Insulin also increases the activity of the sympathetic nervous system,37
an effect that might also be preserved in the setting of the insulin
resistance.38 However, when assessed by concentration of fasting
insulin, HOMA or the HOMA insulin resistance index (HOMA-IR),39
insulin resistance contributes only modestly to the increased
prevalence of hypertension in the metabolic syndrome.40 When blood
pressure measures > 130/85 mm Hg, it forms one of the clinical
diagnostic criteria for metabolic syndrome under NCEP ATP 3
guidelines.
Metabolic syndrome and obesity
Obesity is an important modifiable risk factor for cardiovascular
disease, including diabetes type 2, hypertension, hypercholesterolemia,
coronary heart disease, and stroke.41 The rising prevalence of type 2
to be mainly related to the increasing number of overweight and obese
individual all over the world.42 Accordingly, both World Health
Organization and the National Heart, Lung and Blood Institute has
defined obesity as a body mass index of more than 30 kg/ m2 and BMI
value between 25 and 30 is defined as over weight or pre obese.
Classification of overweight in Adults (WHO)
Classification BMI Risk of
co-morbidities
Asia Pacific Guidelines
Underweight < 18.5 low < 18.5
Normal range 18.5- 24.9 average 18.5- 23 Overweight > 25
Pre-obese 25- 29.9 increased 23-24.9 Obese class 1 30- 34.9 moderate 25- 30 Obese class 2 35-39.9 severe > 30 Obese class 3 > 40
Obesity is defined as the presence of abnormally large amount of
Measurement of adipose tissue is done by clinically as follows 43
1. BMI: It is a measure of the ratio between weight (kg) and height
(m2). It clearly relates body fat independent of height. The only
pitfall in BMI calculation, that it does not take musculature and
differential adipose tissue into account.
2. Skin-fold thickness: It is used to measure fat distribution.
Disadvantages are observer’s error and failure to accommodate
the fat contour.
3. Measurement of body circumference: Waist- hip ratio higher than
0.72 are abnormal. The only pitfall is to evolve standards for a
particular ethnic group.
4. Waist circumference: It is used to identify body weight component
of metabolic syndrome. It is measured at 1 cm above navel at
minimal respiration. Waist circumference greater than 102 cm for
male and greater than 88 cm for female is used as one of clinical
5. Because ATP 3 criteria for Waist circumference might not be
appropriate for Asian population, the cutoff value for metabolic
syndrome is changed to more than 90 cm for men and more than 80
cm for women.44
For several definition of the metabolic syndrome, waist
circumference is included. Mechanistically, a distinction between a
large waist due to increases in subcutaneous adipose tissue versus
visceral fat is debated. This distinction can be made with computed
tomography or magnetic resonance imaging.45
With increases in intra-abdominal or visceral adipose tissue, a
higher rate of flux of adipose tissue-derived free fatty acids to the liver
through the splanchnic circulation would be expected, whereas
increases in abdominal subcutaneous fat would release lipolysis
products into the systemic circulation and avoid more direct effects on
hepatic metabolism (i.e., glucose production, lipid synthesis, and
secretion of prothrombotic proteins such as fibrinogen and
Despite these potential differences in mechanisms related to
excessive abdominal adipose tissue distribution, the clinical diagnosis
of the metabolic syndrome does not distinguish between increases in
subcutaneous and visceral fat.
Yet, perhaps by a mechanism related to free fatty acid flux and
metabolism, the relative predominance of visceral rather than
subcutaneous adipose tissue with increasing waist circumference in
Asians and Asian Indians47 renders the relative prevalence of the
syndrome higher than in African- American men in whom
subcutaneous fat predominates.48
However, there is evidence that the elevated postprandial free
fatty acid release in upper body obese women originates from the non-
splanchnic upper body fat, and not from the visceral depot.49 These
results suggest that visceral fat might be a marker for, but not the
VASCULAR ENDOTHLIAL DYSFUNCTION
Endothelial dysfunction occurs very early in the process of
atherogenesis, which impairs normal vasodilator response. Endothelial
dysfunction is therefore an important factor not only in atherosclerosis
but also in hypertensive heart disease; Dysfunction allows platelets to
adhere to the vessel wall and in turn causes contraction by thromboxane
A2 and serotonin. Platelet-derived growth factor induces migration of
smooth muscle cells. Endothelial cells produce growth promoters and
inhibitors. The balance between them is maintained in normal endothelial
function, under conditions of dysfunction the smooth muscle cells
proliferate and migrate.50
Some vascular trees are more prone to the development of
endothelial dysfunction like coronary arteries and aorta branches while
some are relatively protected like the internal mammary artery and the
brachial artery. The recognized known cardiac risk factors including age,
gender, hypertension, hyperlipidaemia, diabetes mellitus, smoking,
endothelial dysfunction. Some of the above mentioned risk factors are
component of metabolic syndrome.
It is well known endothelial dysfunction can be detected well
before the development of angiographically significant atherosclerotic
plaque.51 Abnormalities in peripheral endothelial function correlate with
the presence of coronary vasomotor dysfunction.
The correlation in endothelial function in both the coronary and the
peripheral vasculature suggests that a common pathway contributed to
endothelial dysfunction in both vascular beds.52
METABOLIC SYNDROME AND CORONARY ARTERY DISEASE
The twin epidemics of diabetes mellitus and heart disease are a
major threat to the well-being as. It is believed that a combination of
factors, genetic and environmental including newer risk factors like the
metabolic syndrome and hypercoagulability in addition to traditional risk
factors like smoking, hypertension and hypercholesterolemia is the
in DM is not only 2-4 times more frequent than non-diabetics and also
has a worse prognosis.
Many patients have sub clinical or asymptomatic CAD which can
have devastating consequences. Tight glycaemic control alone only has
a marginal effect in controlling CAD. This can be treated by a
multifactorial approach which includes not only adequate glycaemic
control but also control of dyslipidemia, hypertension which form part of
metabolic syndrome.53
The unprecedented increase in diabetes and cardiovascular disease
(CVD) prevalence is evident from the report of WHO which shows that
India tops the world with the largest number of subjects. According to
recent WHO reports presently India has 32 million diabetic subjects
and this is projected to increase to 100 million i.e. a rise by 250 % by the
year 2035; in addition there is also a growing incidence of metabolic
syndrome. This syndrome is a deadly combination of hypertension,
diabetes mellitus, and dyslipidemia with abdominal obesity and often
The cause of this is both bad genes and defective environmental
influences. Hence, in the coming decades the burden of CVD related to
DM will increase significantly. Most diabetic’s die of CVD and
atherosclerosis accounts for almost 80% of all diabetic mortality.54
Presence of DM increases the risk of cardiovascular disease (CVD) 2-4
folds. Type 2 DM represents more than 90% of the diabetic population.
However type 1 DM also have an independently higher risk of CVD and
their disease develops at younger age.
All the manifestations of CAD are at least two-fold more common
in patients with DM than in nondiabetic individuals. Conversely, the
prevalence of DM in CAD is approximately 20%.55 There is evidence
from Indian data as well that CAD is more common in diabetic subjects.
Studies conducted in south India by Mohan et al and Ramchandran et al
in Chennai showed a prevalence of diabetes varying from 12-16%.
In a study done at MV Diabetes Centre, Madras; the prevalence of
CAD was assessed in a large cohort of 6597 NIDDM patients.56 Overall
17.8% of patients had CAD. Its prevalence was not significantly different
reported that overall CAD prevalence was 11%. 12% of this population
was diabetic. Among these 21.4% had CAD, more than the double that of
non-diabetics. All these data suggest that the epidemic of type 2 DM and
CAD has already assumed alarming proportions.
Cardiovascular risk factors
Diabetes mellitus and coronary artery disease share many common
risk factors. According to Reaven, diabetes and CAD are constituents
of the metabolic syndrome in which insulin resistance plays a
contributory role. There is a clustering of several metabolic disorders
like dyslipidemia, HTN, hyperglycemia and central abdominal obesity.
In addition, a number of other risk factors for CAD such as
atherothrombotic factors, fibrinolytic factors, coagulation factors
inflammatory markers have also been described in diabetic patients.
Risk factors more common in Asians
1. Decreased physical activity
3. Hyperinsulinemia and increased insulin resistance
4. Decreased beta cell function
5. Increased prevalence of NIDDM
6. Increased lipoprotein (a)
7. Increased TG
8. Decreased HDL
The metabolic syndrome is a constellation of abnormalities
including glucose intolerance, hyperinsulinemia, dyslipidemia, obesity
[central or generalized], hypertension and Microalbuminuria, often
combined with haemostatic and fibrinolytic abnormalities.
The WHO definition of this syndrome includes 57
1. Impaired glucose regulation or diabetes
2. Insulin resistance
3. Raised arterial pressure > 160/90
4. Raised plasma triglyceride > 150 mg/dl and/or low HDL
Cholesterol <35 mg/dl in men and <39 mg/dl in women.
5. Central obesity (males waist to hip ratio > 0.9 females waist to
6. Microalbuminuria
To satisfy the criterion of metabolic syndrome a patient needed to
have either criterion (1) or (2) positive along with at least 2 of the 4
remaining criteria.
Two major studies on the metabolic syndrome include a recent
population-based study by Isomaa and Coworkers in Finland and Sweden
concluded that the metabolic syndrome was present in 10% of subjects
with normal glucose tolerance, 50% of subjects with impaired fasting
glucose or impaired glucose tolerance and 80% of subjects with type 2
diabetes. The risk of coronary artery disease and stroke was markedly
increased (nearly three-fold) in those with the syndrome.
It is clear that an excess of established risk factors for heart disease
in not the only explanation for the increased CAD among Asians.
Perhaps a constellation of cardiovascular risk factors typical of these
triglycerides, decreased HDL, hyperinsulinemia, central obesity and a
high prevalence of type 2 diabetes (as part of the metabolic syndrome or
independently).
Recent findings suggest that part of this risk is inherited, probably
linked to lipoprotein (a) and genetic polymorphism. This when combined
with environmental influence of westernization including obesity,
decreased physical activity, dietary changes, increased LDL cholesterol
and diabetes can be transformed into very potent risk factor for IHD. This
may be mediated through an increased thrombotic tendency related to
increased plasminogen activator inhibitor-1 (PAl-1) and reduced tissue
plasminogen levels.
Treadmill test is most widely used for both diagnosing ischemic
heart disease and as well as estimating their prognosis by using 12 lead
electrocardiography. It predicts the likelihood of coronary artery disease
in 98% of persons with typical angina. The positive response to ischemia
last longer than 0.08s. Negative test does not exclude the coronary artery
disease although it makes the three-vessel (or) left main coronary artery
disease unlikely.
METABOLIC SYNDROME AND STROKE
Stroke is the second leading cause of death worldwide.58 In India
community surveys have shown a crude prevalence rate for hemiplegia in
range of 200 per 100000 persons nearly 1.5% of all medical and around
20% of neurological cases.59 In India, peak year of occurrence of stroke
between 55-65 years.60
Risk factors for stroke
1. Systemic arterial hypertension
2. Diabetes
3. Hyperlipidaemia (particularly, low HDL and high LDL)
4. Smoking
6. Family history of thrombotic stroke are proven atherosclerosis
risk factors for ischemic stroke
Of these above mentioned risk factors, first three forms the
components of the metabolic syndrome. Among this hypertension is the
most significant risk factor for ischemic stoke.61 So all hypertensive
patients to be treated. Whether or not tight control of blood sugar in
patients with diabetes lowers stroke risk is uncertain.62
But one Meta analysis of incidence of stroke in Asian population
showed a positive relation between increasing cholesterol levels and non-
hemorrhagic stroke63 and several trials have confirmed that statin drugs
reduce the risk of stroke even in patients without elevated LDL or low
PERIPHERAL ARTERIAL DISEASE
The term peripheral arterial disease generally refers to atherosclerosis
when it obstructs the blood supply to the lower or upper extremities. It is
an important manifestation of systemic atherosclerosis, and is a strong
marker for risk of major cardiovascular and cerebrovascular events,
The risk factor most correlated with the onset and progression of
peripheral arterial disease is cigarette smoking, followed by diabetes
mellitus. Abnormalities in lipid metabolism are also associated with an
increased prevalence of peripheral arterial disease; Relative risk for
peripheral arterial disease is about 1.1 for each 10 mg /dl increase in total
cholesterol with similar increases for development of claudication.65
Peripheral Vascular Disease of the lower extremity is an important cause
Unique Features of Peripheral Vascular Disease in Indians
1. Presentation at younger age (mean age 45 years)
2. Increased association of diabetes and presence of typical
Diabetic Peripheral Vascular Disease
3. Strongest correlation with presence of Coronary Artery Disease
(CAD) and Cerebrovascular Disease (CVD).
Peripheral vascular disease in diabetes
Diabetes Mellitus is an important risk factor of lower extremity
arterial disease (LEAD) in India. Smoking and insulin resistance are
frequently present in patients with diabetes and contribute an additional
risk for vascular disease.
In population based and epidemiology based studies, 67 It is
estimated that 20-30% of diabetic patients over 65 years of age have
peripheral arterial disease. In 75% cases peripheral vascular disease is
asymptomatic, in 25% cases peripheral vascular disease is symptomatic
with intermittent claudication, coldness and numbness of feet, weakness
Clinical presentation of lower limb vasculardisorders
1. Intermittent Claudication
It is characterized by pain or fatigue in the affected leg on walking
and relieved by rest. It occurs when the oxygen demand of the skeletal
muscle exceeds the blood supply during exercise and is due to activation
of local receptors by accumulated lactic acid. Claudication has been
graded using different classifications. The commonly used classification
is
Fontaine classification 68
Stage Symptoms
I Asymptomatic
II Intermittent claudication
II a Pain free, claudication on walking > 200 meters
II b Pain free, claudication on walking < 200 meters
III Rest and nocturnal pain
IV Necrosis, gangrene
Clinical Methods
1. Palpation of peripheral pulses
Absence of peripheral pulses is an important finding. Absent
posterior tibial, popliteal or femoral pulses with / without bruits indicate
significant occlusive peripheral vascular diseases especially if associated
with symptoms like claudication. Physical examination often reveals
decreased pulsations. Capillary refilling, increased venous filling time
(>20 seconds), atrophic changes, loss of hair, discoloration of skin and
decreased temperature are common clinical findings.
2. Ankle brachial index
It is the ratio of the systolic blood pressure measurement of the
ankle to that of the brachial artery.
a) A normal ABI should be less or equal to 1.1
b) An index of < 0.9 is abnormal and indicates occlusive PVD, especially
in presence of absent peripheral pulses.
c) ABI less than or equal to 0.8 indicates PVD regardless of symptoms.
the compression of the calcified vessel, diabetics present a challenge to
the sensitivity of this method.
Duplex Imaging
Gray scale and color flow imaging are useful in localizing the
diseased segment while spectral imaging is used to assess the severity of
the lesion. A two fold or greater increase in peak systolic velocity at the
site of stenosis indicates 50% or more stenosis. Doppler signals are
absent if artery is totally occluded.
MATERIALS AND METHODS
A sample of 120 cases of elderly (60 years & above) men and
women were selected by systematic sampling methods from our medical
out patients department, Government General Hospital, 20 cases were
excluded since they had hemorrhagic stroke and selected cases were
analyzed for the presence of metabolic syndrome and vascular
complications present in that group.
The patients having three or more of the following criteria
(according to the National Cholesterol Education Guidelines Adult
Treatment Panel (ATP) 3 report) were defined as having the metabolic
syndrome:
1. Waist circumference > 102 cm in men and > 88 cm in women
2. Hypertriglyceridemia: ≥ 150 mg/dl (≥ 1.7 mmol/l).
3. Low HDL: < 40 mg/dl in men (<1.0 mmol/l)
5. High blood pressure: ≥ 130/85 mmHg or use of antihypertensive
medication.
6. High fasting plasma venous glucose: ≥ 110 mg/dl (≥ 6.1 mmol/l) or
treatment for diabetes.
Because the ATP 3 criteria for HDL cholesterol and waist
circumference might not be appropriate for Asian population, additional
calculations for the prevalence of the metabolic syndrome were done
based on a recommended regional cutoff for HDL cholesterol of less than
40 mg/dl (1.0 mmol/l) for both men and women and waist circumference
greater than 90 cm for men and greater than 80 cm for women.69
The 1997 American Diabetes Association criteria were used to
define diabetes.70 we considered a subject to have diabetes when the
fasting plasma venous glucose was ≥ 126 mg/dl (≥ 7mmol/l) in two
For each enrolled subject, the personal and family medical
histories were obtained. On the study day, height and weight were
measured twice during the examination. Weight was measured to the
nearest 100 g with bare foot. Height was measured to the nearest mm
with a stadiometer. Body mass index (BMI) was calculated by the
formula
BMI = Weight (kg) / Height (m) 2
Overweight was defined as a BMI of 23 kg/m2 or greater,
according to Asia Pacific guidelines. Blood pressure was measured was
measured with patient in the sitting position after a 5 min rest, with
mercury sphygmomanometer (cuff size 12.5
×
40 cm). The
systolic BPand diastolic BP were read to the nearest 2 mmHg. Disappearance of
Korotkoff’s sounds (phase 5) was the criterion for diastolic BP. Standard
12 lead ECG was obtained from each patients. Echocardiogram was
circumference was measured at 1 cm above the navel at minimal
respiration.71
The definition of vascular disease included coronary heart disease,
stroke, and/ or peripheral arterial disease. The presence of vascular
disease was established based on physical examination and personal
medical history. Prevalent coronary heart disease was diagnosed by the
presence of history of hospitalization for myocardial infarction, coronary
bypass artery grafting, or percutaneous transluminal angioplasty, or by
the presence of stable angina, positive exercise tolerance test (The
development of 0.10 mV (1 mm) or greater of J point depression
measured from PQ segment with a flat ST segment depression of 0.10
mV or greater at 80 m sec after J point in three consequent beats is the
evidence of ischemia) or coronary angiography with at least one
substantial coronary artery stenosis.
Subjects were considered to have a stroke if they had been
confirmation of a non-hemorrhagic stroke by a CT scan were included.
Peripheral arterial disease was established by physical examination and
the presence of intermittent claudication, and Duplex imaging. If a
subject had more than one vascular disease manifestation he/she was
considered only once (adjustment for overlap).
The study groups were classified into four groups i.e.) metabolic
syndrome with diabetes, metabolic syndrome without diabetes, no
metabolic syndrome with diabetes, no metabolic syndrome without
diabetes. Initially prevalence of metabolic syndrome in the study group
was assessed, and then vascular disease prevalence was assessed by
comparing with non-metabolic syndrome group.
STUDY DESIGN:
To evaluate the presence of metabolic syndrome and assess the
prevalence of vascular diseases in elderly with the metabolic syndrome
with or without diabetes when compared with subjects without metabolic
Laboratory methods
Overnight fasting (at least 10 hours) blood specimen were obtained
for measurement of serum lipids and plasma glucose. Concentration of
total cholesterol, HDL- cholesterol, and triglycerides were assessed
enzymatically with commercially available reagents. Concentration of
LDL- cholesterol was calculated by use of the Friedewald equation for
participants who had triglycerides (< 400 mg/dl)
LDL = TC – HDL-c – TGL/5
Serum creatinine, blood urea, serum electrolytes, and other biochemical
evaluation were performed according to routine standards, at biochemical
STATISTICAL ANALYSIS
Statistical analysis was carried out for 100 subjects [45 metabolic
syndrome, 55 no metabolic syndrome] after categorizing each variable.
Base line data was collected from patients with vascular disease and
metabolic syndrome and without metabolic syndrome. Age, sex, lipid
profile, non HDL cholesterol, components of the metabolic syndrome
such as waist circumference, systemic BP > 130/85, fasting glucose >
110, Triglycerides >150, Low HDL < 40 mg/dl were analyzed.
The significance of difference in means between two groups and
the significance of difference in proportions were analyzed by Z test. The
prevalence of vascular disease in the metabolic syndrome were analyzed
and compared with non-metabolic syndrome group. Statistical
significance was taken when two-sided p value < 0.05. Statistical analysis
was carried out using standard formulae by Microsoft Excel 2003. The
correlation between metabolic syndrome components and vascular
Observations
Table 1
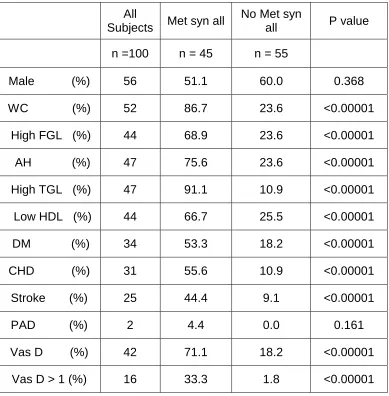
Prevalence of vascular diseases in Total met syn group
All
Subjects Met syn all
No Met syn
all P value
n =100 n = 45 n = 55
Male (%) 56 51.1 60.0 0.368
WC (%) 52 86.7 23.6 <0.00001
High FGL (%) 44 68.9 23.6 <0.00001
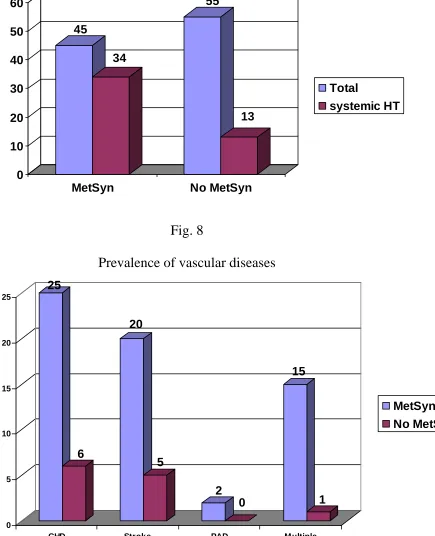
AH (%) 47 75.6 23.6 <0.00001
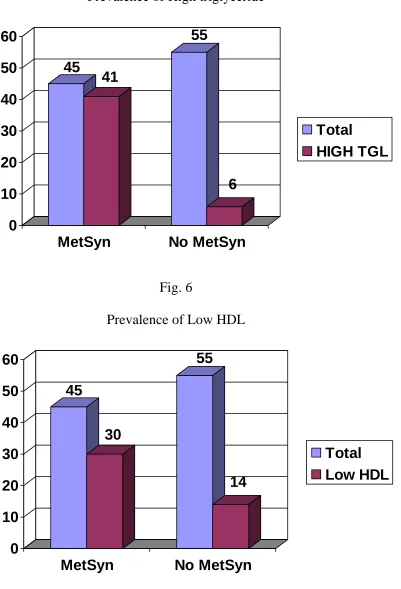
High TGL (%) 47 91.1 10.9 <0.00001
Low HDL (%) 44 66.7 25.5 <0.00001
DM (%) 34 53.3 18.2 <0.00001
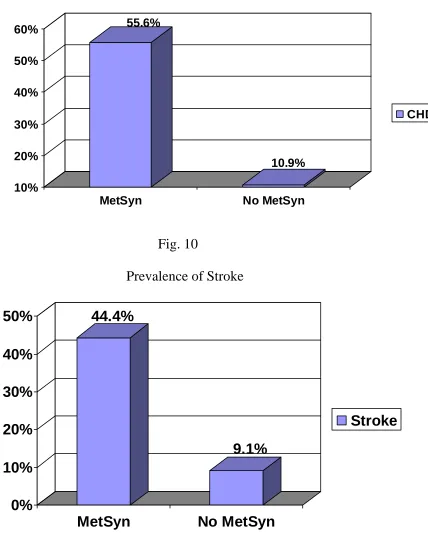
CHD (%) 31 55.6 10.9 <0.00001
Stroke (%) 25 44.4 9.1 <0.00001
PAD (%) 2 4.4 0.0 0.161
Vas D (%) 42 71.1 18.2 <0.00001
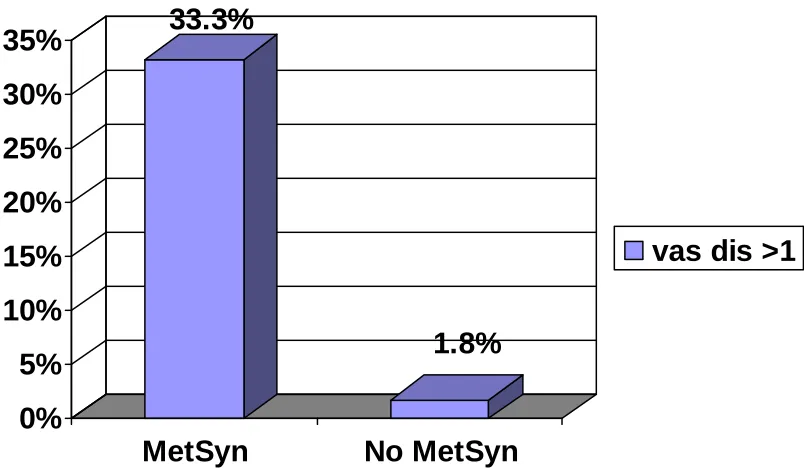
Vas D > 1 (%) 16 33.3 1.8 <0.00001
Table 2
Prevalence of vascular diseases in met syn with DM group
All Subject Met syn + DM No Met syn +DM P value
n =100 n = 24 n = 10
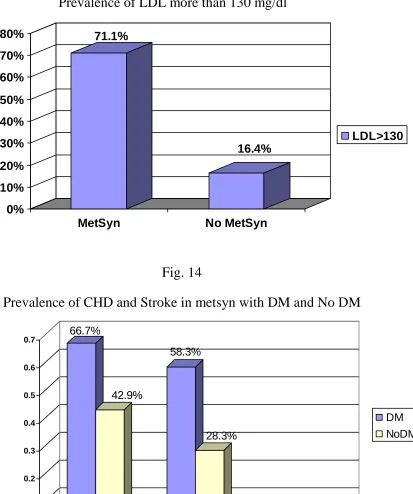
CHD (%) 31 66.7 30.0 <0.034
Stroke (%) 25 58.3 30.0 <0.108
PAD (%) 2 4.2 0.0 <0.316
Vas D (%) 42 87.5 50.0 <0.026
Vas D > 1 (%) 16 41.7 10.0 <0.020
[image:55.612.108.559.161.343.2]
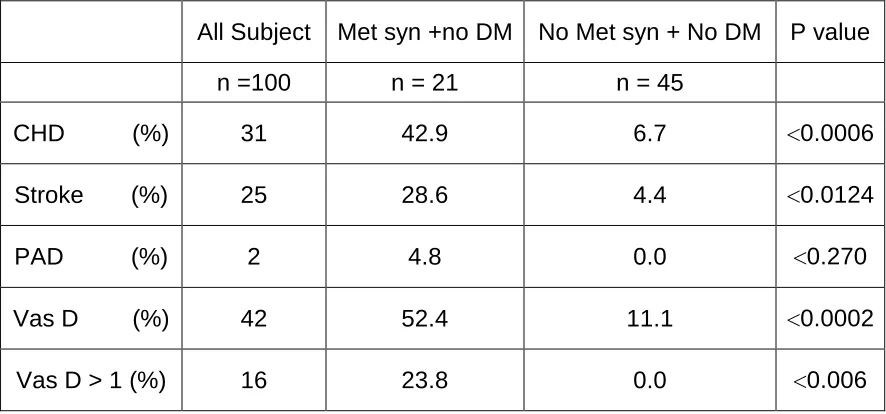
Table 3
Prevalence of vascular diseases in met syn without DM group
All Subject Met syn +no DM No Met syn + No DM P value
n =100 n = 21 n = 45
CHD (%) 31 42.9 6.7 <0.0006
Stroke (%) 25 28.6 4.4 <0.0124
PAD (%) 2 4.8 0.0 <0.270
Vas D (%) 42 52.4 11.1 <0.0002
[image:55.612.107.550.506.713.2]
Table 4
Lipid profile in met syn and no met syn group
Lipid fraction Met syn No met syn P value
Total cholesterol 214.07± 18.24 195.09± 11.19 <0.0001
HDL 39.27± 4.29 42.05± 4.13 <0.0008
Triglycerides 177.53± 22.89 147.47± 11.77 <0.0001 LDL 139.29± 17.82 123.54± 13.63 <0.0001
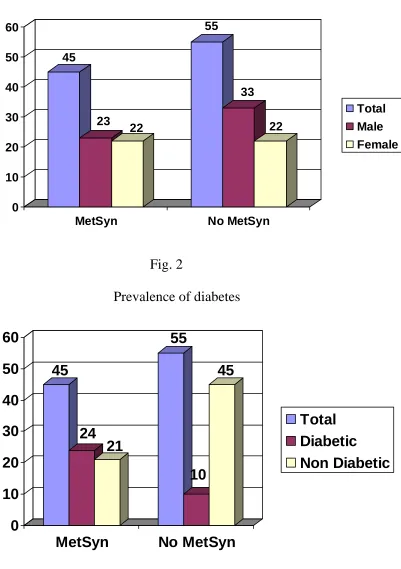
The prevalence of metabolic syndrome in our study group was
45%. The prevalence of metabolic syndrome in men was 51.1%. The
prevalence of metabolic syndrome in women was 48.9%. Both genders
had same prevalence of metabolic syndrome (p = 0.5) and was not
statistically significant.
The overlap adjusted prevalence of vascular disease in all
=45) had a vascular disease prevalence of 71.1%, significantly higher
than that of people (n = 55) without metabolic syndrome (18.2%, p <
0.0001).
Participants without both the metabolic syndrome and DM (n =
45) had the lowest vascular disease prevalence (11.1%), while subjects
with DM but without the metabolic syndrome (n = 10) had a vascular
disease prevalence of 50% (p < 0.05). This was nearly similar to that
of people (n = 21) with the metabolic syndrome without DM (52.4%),
but significantly lower than that of participants (n = 24) with both the
metabolic syndrome and DM (87.5%, p < 0.05).
The concomitant presence of CHD, stroke and PAD in the
metabolic syndrome group, with or without DM, (33.3%) was higher
than in those without the metabolic syndrome (1.8%). Thus, the sum
total of CHD, stroke and PAD was higher in the metabolic syndrome
group than in those without the metabolic syndrome. In the metabolic
syndrome group, having more than one of CHD, stroke or PAD, the
stroke and/or PAD was 71.1%. In contrast, this figure was 18.2% for
those without the metabolic syndrome.
All the lipid values of subjects with the metabolic syndrome
were significantly different from those of subjects without the
metabolic syndrome. A substantial percentage (71.1%) of patients with
the metabolic syndrome had high LDL-C levels > 130 mg/dl (> 3.4
mmol/l) and even more (82.2%) had a non- HDL-C > 160mg/dl (>
4.1mmol/l).
The prevalence of vascular disease in the metabolic syndrome
group was 71.1%. Among the vascular diseases coronary artery disease
had the highest prevalence; PAD had least prevalence and stroke
prevalence in between.
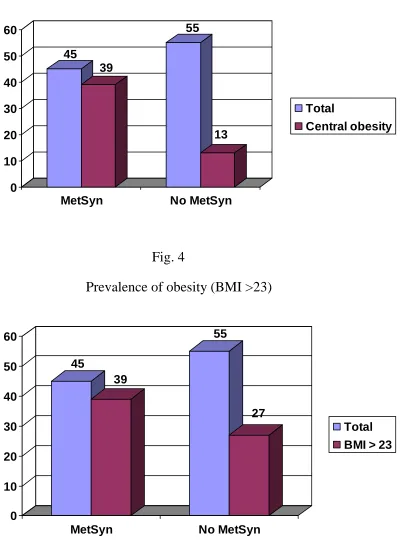
Among the component factors of metabolic syndrome, waist
circumference (> 90 cm in male, >80 cm in female) had the highest
prevalence than other factors. Highest BMI was prevalent in the
metabolic syndrome with diabetes group.
The prevalence of vascular disease in the metabolic syndrome
alone group without diabetes was significantly (p <0.0002) higher than
that of group without metabolic syndrome and no DM but similar to
that of group without metabolic syndrome and with DM. Thus the
presence of metabolic syndrome alone without DM has increased the
risk of developing vascular diseases.
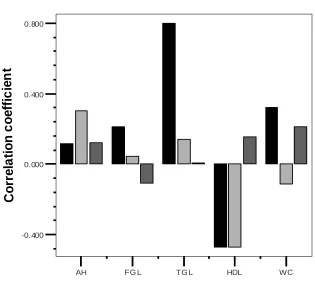
We assessed the strength of correlation of the metabolic
syndrome components with the vascular diseases. We found that waist
circumference, fasting glucose, triglyceride, arterial hypertension were
positively correlating with vascular events, and HDL was inversely
correlated with vascular events. Arterial hypertension strongly
correlated with stroke, TGL strongly correlated with CHD and HDL
Fig.1 Sex distribution 45 23 22 55 33 22 0 10 20 30 40 50 60
MetSyn No MetSyn
[image:60.612.138.539.121.690.2]Total Male Female
Fig. 2
Prevalence of diabetes
45
24
21
55
10
45
0
10
20
30
40
50
60
MetSyn
No MetSyn
Fig. 3
Prevalence of Central obesity
45 39 55 13 0 10 20 30 40 50 60
MetSyn No MetSyn
Total
[image:61.612.138.537.450.669.2]Central obesity
Fig. 4
Prevalence of obesity (BMI >23)
45 39 55 27 0 10 20 30 40 50 60
MetSyn No MetSyn
Fig. 5
Prevalence of High triglyceride
45
41
55
6
0
10
20
30
40
50
60
MetSyn
No MetSyn
Total
[image:62.612.139.540.116.705.2]HIGH TGL
Fig. 6
Prevalence of Low HDL
45
30
55
14
0
10
20
30
40
50
60
MetSyn
No MetSyn
Fig. 7
Prevalence of systemic hypertension
45 34 55 13 0 10 20 30 40 50 60
MetSyn No MetSyn
Total
systemic HT
Fig. 8
Prevalence of vascular diseases
25 6 20 5 2 0 15 1 0 5 10 15 20 25
CHD Stroke PAD Multiple
[image:63.612.130.490.402.688.2]Fig. 9
Prevalence of CHD
55.6% 10.9% 10% 20% 30% 40% 50% 60%
MetSyn No MetSyn
[image:64.612.130.558.138.676.2]CHD
Fig. 10
Prevalence of Stroke
44.4%
9.1%
0%
10%
20%
30%
40%
50%
MetSyn
No MetSyn
Fig. 11
Prevalence of Peripheral arterial disease (PAD)
4.4% 0.0% 2% 4% 6% 8% 10%
MetSyn No MetSyn
[image:65.612.130.532.456.692.2]PAD
Fig. 12
Prevalence of more than 1 vascular disease
33.3%
1.8%
0%
5%
10%
15%
20%
25%
30%
35%
MetSyn
No MetSyn
Fig. 13
Prevalence of LDL more than 130 mg/dl
71.1% 16.4% 0% 10% 20% 30% 40% 50% 60% 70% 80%
MetSyn No MetSyn
LDL>130
Fig. 14
Prevalence of CHD and Stroke in metsyn with DM and No DM
[image:66.612.153.554.327.657.2]Fig. 15
Correlation of vascular events with MetSyn components
CHD
Stroke PAD
AH FG L TG L HDL WC
-0.400 0.000 0.400 0.800 C o rr e la ti o n c o e ff ic ie n t
Corr e lations Type : Spearman's rho
Statistics : Correlation Coef f icient
AH-Arterial hypertension
FGL- Fasting glucose
TGL- Triglycerides
HDL- High density lipoprotein
WC- Waist circumference
PAD- Peripheral arterial disease
2D DOPPLER
DISCUSSION
Our results suggest that in our study population, the metabolic
syndrome prevalence in the elderly was 45%; in contrast with the
population (adult) based METS-GREECE Multicenter study which had
a prevalence of 23.6%. This was due to the clustering of the metabolic
syndrome in the elderly group and increasing prevalence of metabolic
syndrome with age. In accordance with METS-GREECE Multicenter
study, our study identifies a substantial additional vascular risk
(CHD/stroke/PAD) in men and women, even in those without diabetes.
Furthermore, the overlap adjusted prevalent vascular disease in
those with the metabolic syndrome but no diabetes were significantly
greater than that of those in the non-metabolic syndrome group,
underlining the high risk associated with the Metsyn. These findings in
accordance with METS-GREECE Multicenter study, suggest that the
metabolic syndrome should probably be added to the list of coronary
The prevalence of increased vascular disease in subjects with the
metabolic syndrome may be explained by the components that define
the metabolic syndrome in association with other, not routinely
measured factors. For example, impaired fibrinolysis, oxidative stress
hypercoagulability, high LDL-C levels, increased small dense LDL
particles, inflammation and hyperinsulinemia. It was also reported that
the Metsyn is associated with higher levels of oxidized LDL-C,
apolipoprotein-B, urate, leptin, fibrinogen, leucocytes, erythrocyte
sedimentation rate and soluble endothelial adhesion molecule and
lower apolipoprotein-A concentrations.
Apart from the five components of the metabolic syndrome,
other two factors play an important role for coronary heart disease risk.
This was partly due to increased levels of LDL-C, small dense LDL
particles and elevated non-HDL cholesterol. All these parameters
cannot be assessed in each patient in everyday clinical practice.
However, LDL-C and non-HDL-C (total cholesterol minus HDL-C)
Although LDL-C is not considered as a component of the
metabolic syndrome, many of patients have raised levels of LDL-C. In
our study, 71.1% of the subjects with the metabolic syndrome had a
LDL-C > 130 mg/dl (> 3.4 mmol/l), this finding more in accordance
with METS-GREECE Multicenter study which had 64% of the
subjects with LDL-C > 130 mg/dl and the importance of LDL-C is that
it forms primary treatment target in the management of dyslipidemia.
The contribution of high LDL-C levels to vascular disease risk
in subjects with the Metsyn was highlighted by retrospective analysis
of the landmark statin trails. The placebo data from the Scandinavian
Simvastatin Survival Study (4s) and the Air Force/Texas Coronary
Atherosclerosis Prevention Study (AFCAPS/Tex-CAPS) showed that
the relative risk of major coronary events associated with the
metabolic syndrome, after excluding DM was 1.5 (95% CI = 1.2-1.8)
and 1.4 (95% CI = 1.04-1.9) respectively, in comparison to subjects
without the metabolic syndrome.
These data demonstrate that the metabolic syndrome is
patients with CHD in 4s and in those with average LDL-C levels and
low HDL-C but without CHD in AFCAPS/TexCAPS. This argues for
whether elevated LDL-C might be considered modifying components
of the metabolic syndrome, especially in the presence of elevated
triglycerides (indicating small dense LDL particles with increased
atherogenicity).
In individuals with triglycerides >200 mg/dl (> 2.3 mmol/l),
probably the majority of subjects with the metabolic syndrome,
non-HDL is a secondary treatment target. Non-non-HDL-C includes cholesterol
in LDL and triglyceride-rich lipoproteins. In our study, 82.2% of
subjects with the metabolic syndrome had a non-HDL-C level >160
mg/dl (>4.1 mmol/l), in accordance with METS-GREECE Multicenter
study which had 69% of subjects with non-HDL-C level >160 mg/dl.
In the Lipid Research Clinics follow-up study, non-HDL-C level
was a better predictor of CHD death than LDL-C. In the GREACE
study, non-HDL-C level was a better predictor of risk for clinical
vascular events in untreated patients than LDL-C, in these instances
non-HDL-C may be incorporated in the definition of the metabolic
syndrome.
Several studies including METS-GREECE Multicenter study
and data from our study group suggest that the metabolic syndrome,
even in the absence of diabetes, is associated with an increased
vascular risk. This will reset the LDL-C and non-HDL-C treatment
targets and may result in additional clinical benefit in these subjects.
Study limitations
The study is a hospital based study and may not be
representative of general population. As a cross-sectional study, the
present analysis is limited in its ability to elucidate causal relationships
between risk factors and outcome. Some subgroups like no Metsyn but
with diabetes are small in number.
CONCLUSIONS
1. The prevalence of metabolic syndrome in our study group was
45% and vascular disease (coronary artery disease/stroke)
prevalence was markedly increased in the presence of the
metabolic syndrome in the elderly.
2. Those with both the metabolic syndrome and diabetes had the
highest prevalence of coronary artery disease and stroke,
followed by those with the metabolic syndrome but without
diabetes in the elderly.
3. The metabolic syndrome is significantly associated with vascular
disease risk, even in the absence of diabetes in the elderly;
probably metabolic syndrome alone without diabetes can be
considered as a coronary heart disease-risk equivalent in future