“ASSESSMENT OF PULMONARY FUNCTION TESTS IN TYPE 2 DM (SPIROMETRY BASED)”
Dissertation submitted in partial fulfillment of the Requirement for the award of the Degree
of
DOCTOR OF MEDICINE BRANCH I - GENERAL MEDICINE
APRIL 2012
THE TAMILNADU
CERTIFICATE
This is to certify that the dissertation entitled “ASSESSMENT OF PULMONARY FUNCTION TESTS IN TYPE 2 DM (SPIROMETRY BASED)” is a bonafide work of Dr.A.THANGADHURAI, in partial fulfillment of the university regulations of the Tamil Nadu Dr. M.G.R. Medical University,
Chennai, for M.D General Medicine Branch I examination to be held in April 2012.
Dr. MOSES.K.DANIEL M.D Dr.M.NATARAJAN M.D
Professor and HOD, Professor, Department of General Medicine, Department of General Medicine,
Government Rajaji Hospital, Government Rajaji Hospital, Madurai Medical College, Madurai Medical College,
DECLARATION
I, Dr. A.THANGADHURAI , solemnly declare that, this dissertation “ASSESSMENT OF PULMONARY FUNCTION TESTS IN TYPE 2 DM (SPIROMETRY BASED)” is a bonafide record of work done by me at the Department of General Medicine, Government Rajaji Hospital, Madurai, under the
guidance of Dr.M.NATARAJAN M.D., Professor, Department of General Medicine, Madurai Medical college, Madurai.
This dissertation is submitted to The Tamil Nadu Dr. M.G.R. Medical
University, Chennai in partial fulfillment of the rules and regulations for the award
of Degree of Doctor of Medicine (M.D.), General Medicine Branch-I, examination
to be held in April 2012.
Place: Madurai
Date:
ACKNOWLEDGEMENT
I would like to thank Dr.EDWIN JOE, M.D., Dean, Madurai Medical College, for permitting me to utilise the hospital facilities for the dissertation.
I also extend my sincere thanks to Prof.Dr.MOSES .K.DANIEL M.D,
Head of the Department and Professor of Medicine for his constant support during
the study.
I would like to express my deep sense of gratitude and thanks to my Unit
Chief, my guide and Professor of Medicine,Dr.M.NATARAJAN M.D., for his valuable suggestions and excellent guidance during the study.
I express my sincere thanks to Dr.RAMESH, M.D.(TB&Chest diseases)
Professor & HOD,Dept.of Pulmonology for permitting me to utilise the facilities
of the Department for the purpose of this study and guiding me with enthusiasm
through out the study period.
I thank the Assistant Professors of my Unit Dr.G.SELVARANI M.D., D.H.Sc (Echo) and Dr.K.MURALIDHARAN, M.D. and Assistant Professor of Department of Pulmonology Dr.S.VIVEKANANDHAN, M.D,D.T.C.D., for their valid comments, guidance and suggestions.
I wish to acknowledge all those, including my Post graduate colleagues,
my parents and my wife who have directly or indirectly helped me complete this
work with great success.
Last but definitely not the least, I thank all the patients who participated in
CONTENTS
S.NO. TITLE PAGE PAGE.NO.
1. NEED FOR THE STUDY 1
2. INTRODUCTION 4
3. REVIEW OF LITERATURE 28
4. AIM OF THE STUDY 39
5. MATERIALS AND METHODS 40
6. OBSERVATIONS AND RESULTS 44
6. DISCUSSION 70
7. CONCLUSION 73
8. LIMITATIONS OF THE STUDY 75
BIBLIOGRAPHY PROFORMA MASTER CHART ABBREVATIONS
LIST OF TABLES
TABLE
NO
TABLES
PAGE NO
1 Age distribution 44
2 Sex distribution 46
3 Physiological variables 47
4 Blood Sugar levels 49
5 Duration of Diabetic cases 49
6 Observed Spirometric results 51
7 % Predicted values of PFT 52
8 Duration and Observed Spirometric results 54
9 Duration and% Predicted values of PFT 55
10 FBS Level and Observed Spirometric results 58
11 FBS level and% Predicted values of PFT 59
12 PPBS Level and Observed Spirometric results 62
13 PPBS level and% Predicted values of PFT 63
14 HbA1c Level and Observed Spirometric results 66
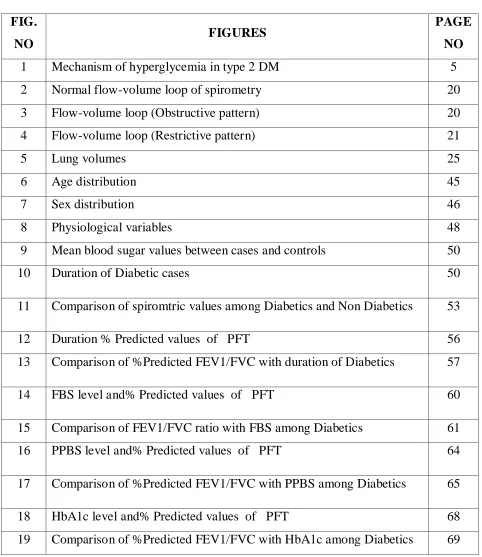
LIST OF FIGURES
FIG.
NO FIGURES
PAGE
NO
1 Mechanism of hyperglycemia in type 2 DM 5
2 Normal flow-volume loop of spirometry 20
3 Flow-volume loop (Obstructive pattern) 20
4 Flow-volume loop (Restrictive pattern) 21
5 Lung volumes 25
6 Age distribution 45
7 Sex distribution 46
8 Physiological variables 48
9 Mean blood sugar values between cases and controls 50
10 Duration of Diabetic cases 50
11 Comparison of spiromtric values among Diabetics and Non Diabetics 53
12 Duration % Predicted values of PFT 56
13 Comparison of %Predicted FEV1/FVC with duration of Diabetics 57
14 FBS level and% Predicted values of PFT 60
15 Comparison of FEV1/FVC ratio with FBS among Diabetics 61
16 PPBS level and% Predicted values of PFT 64
[image:7.612.64.546.128.685.2]1
NEED FOR THE STUDY
We are today witnessing an epidemic of diabetes mellitus(DM), globally
nationally. DM and its complications have become the most important
contemporary and challenging health problem. There are 170 million diabetics
worldwide. In india more than 5 crores have been affected. India has become
the diabetic capital of world.
Practically every system is affected by complications of DM .Attention
is usually paid to micro and macro angiopathy,retinopathy and nephropathy,but
one of the system most neglected in DM is the respiratory system,except for
the recognition of increased infection prevalence like tuberculosis.
Normal lung function has three components,which contribute to gas exchange
• Ventilation – Movements of gas in and out of lung.
• Perfusion – The perfusion of venous blood from right ventricle to
ventilated alveoli.
• Diffusion – The diffusion of gases across the alveolar capillary
2
Ventilation has two processes Inspiration and Expiration. Inspiration is
an active process occurring on contraction of intercostal muscles and
diaphragm normally, Expiration is essentially passive due to elastic recoil of
chest wall and lungs.
Several changes occur in DM, including:
1. Non-enzymatic glycosylation of connective tissue,especially
collagen,which might be responsible for end organ damage causing
diabetic neuropathy, diabetic nephropathy, diabetic retinopathy and lung
changes. (diabetic pulmonopathy)
2. Diabetic myopathy
3. Micro vascular angiopathy
These changes could lead to
Loss of elasticity.
Altered perfusion characteristics.
Weakness of the respiratory muscles responsible for ventilation.
Ventilation may be affected by myopathy and altered elastic recoil of
lung tissue. Perfusion may be affected by changes in basement membrane and
micro vascular angiopathy.
All may contribute to altered lung function, there are studies, which
3
This study will help add to the growing literature on changes in lung function
in diabetes mellitus.
There is increasing interest in this area and few publications. However
the total number of studies with respect to lung function in type 2 DM is still
very small and involved very small patients. Hence this study was performed to
4
INTRODUCTION
Diabetes mellitus is a heterogeneous group of metabolic disorders
characterized by chronic hyperglycemia resulting from defects in insulin
secretion, action or both. Based on etiopathogenic categories, it is classified as
Type-1 and Type-2 diabetes mellitus. In Type-1 there is absolute deficiency of
insulin secretion. In Type-2 there is a combination of resistance to insulin
action and inadequate compensatory insulin secretory response. Diabetes
mellitus is accompanied by wide spread biochemical, morphological and
functional abnormalities which may precipitate certain complications that
affect the renal, cardio-vascular, neural systems and also skin, liver, collagen
and elastic fibres. Thus diabetes is a multisystem disorder that affect many
organs of the body.
[1]
ADA-Criteria for the Diagnosis of Diabetes Mellitus.[2]
• Symptoms of diabetes plus random blood glucose concentration -11.1
mmol/L (200 mg/dL)aor
• Fasting plasma glucose -7.0 mmol/L (126 mg/dL)bor
• Two-hour plasma glucose -11.1 mmol/L (200 mg/dL) during an oral
5 TYPE 2 DIABETES MELLITUS
Type 2 diabetes is characterized by the combination of peripheral
insulin resistance and inadequate insulin secretion by pancreatic beta cells.
Insulin resistance, which has been attributed to elevated levels of free fatty
acids in plasma,[3] leads to decreased glucose transport into muscle cells,
[image:12.612.115.496.319.631.2]elevated hepatic glucose production, and increased breakdown of fat.
Fig 1: Mechanism of hyperglycemia in type 2 DM
For type 2 diabetes mellitus to occur, both defects must exist. For example, all
6
those who cannot increase insulin secretion sufficiently to compensate for their
insulin resistance. Their insulin concentrations may be high, yet
inappropriately low for the level of glycemia.
Beta cell dysfunction is a major factor across the spectrum of
pre-diabetes to pre-diabetes. A study of obese adolescents by Bacha et al confirms what
is increasingly being stressed in adults as well: Beta cell function happens early
in the pathological process and does not necessarily follow stage of insulin
resistance. [4] Singular focus on insulin resistance as the "be all and end all" is
gradually shifting, and hopefully better treatment options that focus on the beta
cell pathology will emerge to treat the disorder early.
In the progression from normal glucose tolerance to abnormal glucose
tolerance, postprandial blood glucose levels increase first; eventually, fasting
hyperglycemia develops as suppression of hepatic gluconeogenesis fails.
During the induction of insulin resistance, such as is seen after
high-calorie diet, steroid administration, or physical inactivity, increased glucagon
levels and increased glucose-dependent insulinotropic polypeptide (GIP) levels
accompany glucose intolerance; however, postprandial glucagonlike peptide-1
(GLP-1) response is unaltered.[5]This has physiologic implications; for
example, if the GLP-1 level is unaltered, GLP-1 may be a target of therapy in
7
Major risk factors for type 2 diabetes mellitus are the following:
• Age greater than 45 years (though, as noted above, type 2 diabetes mellitus is
occurring with increasing frequency in young individuals)
• Weight greater than 120% of desirable body weight
• Family history of type 2 diabetes in a first-degree relative (eg, parent or
sibling)
• Hispanic, Native American, African American, Asian American, or Pacific
Islander descent
• History of previous impaired glucose tolerance (IGT) or impaired fasting
glucose (IFG)
• Hypertension (>140/90 mm Hg) or dyslipidemia (high-density lipoprotein
[HDL] cholesterol level < 40 mg/dL or triglyceride level >150 mg/dL) .[8]
• History of gestational diabetes mellitus or of delivering a baby with a birth
weight of >9 lb
• Polycystic ovarian syndrome (which results in insulin resistance)
Type 2 DM has a strong genetic component. The concordance of type 2
DM in identical twins is between 70 and 90%. Individuals with a parent with
type 2 DM have an increased risk of diabetes; if both parents have type 2 DM,
8
glucose utilization in skeletal muscle, is present in many nondiabetic,
first-degree relatives of individuals with type 2 DM. The disease is polygenic and
multifactorial since in addition to genetic susceptibility, environmental factors
(such as obesity, nutrition, and physical activity) modulate the phenotype. The
genes that predispose to type 2 DM are incompletely identified, but recent
genome-wide association studies have identified several genes that convey a
relatively small risk for type 2 DM (relative risk of 1.1-1.5).
Most prominent is a variant of the transcription factor 7-like 2 (TCF7L2) gene that has been associated with type 2 diabetes in several populations and
with impaired glucose tolerance in one population at high risk for diabetes.
TCF7L2 is a transcription factor and key component of the Wnt signaling pathway, and it is involved in the development of a wide variety of cell
lineages and organs. [9] Potential mechanisms through which TCF7L2 variants influence type 2 diabetes include its role in adipogenesis, myogenesis, and
pancreatic islet development, as well as in beta-cell survival and insulin
secretory granule function.[10,11] It is also involved in the transcriptional
regulation of the genes for proglucagon and the glucagon-like peptides GLP-1
and GLP-2; these peptides play a role in postprandial insulin secretion.[12]
9
on pancreatic islet beta cells.[13,14] Indeed, dysregulation of glucose
metabolism, decreased processing of proinsulin, and elevated levels of gastric
inhibitory peptide and glycated haemoglobin (HbA1c) can be observed in
normoglycemic individuals with TCF7L2 polymorphisms before the onset of type 2 diabetes.[15,16] Thus, while the specific mechanism driving the
development of type 2 diabetes remains unclear, there is sufficient evidence to
demonstrate that TCF7L2 variants strongly predict the development of type 2diabetes and/or the progression to diabetes from impaired glucose
tolerance.[14, 17]
Although genetic tests for TCF7L2 could help predict the incidence and the rate of onset of type 2 diabetes,[18] the strongest predictors continue to be
positive family history, increased body mass index, increased blood pressure,
and increased serum levels of triglycerides, apolipoprotein A-1, and liver
enzymes, all of which precede inception of metabolic syndrome.[19] In fact, the
predictive power of TCF7L2 variants disappears with lifestyle modifications or metformin treatment, while the improved insulin sensitivity resulting from
10
determined by TCF7L2 variants might prove an actionable indicator for early intervention and disease prevention.[17]
The incidence of Type-2 diabetes has been steadily increasing in urban
areas to 8.4% the rapid urbanization, change in the lifestyle coupled with
ethnic susceptibility has increased the incidence of diabetes mellitus. This
globally important condition needs to be understood with a proper perspective
to deliver effective strategies to the individual and also the population.
The chronic complications of DM affect many organ systems and are
responsible for the majority of morbidity and mortality associated with the
disease. Chronic complications can be divided into vascular and nonvascular
complications . The vascular complications of DM are further subdivided into
microvascular (retinopathy, neuropathy, nephropathy) and macrovascular
complications [coronary artery disease (CAD), peripheral arterial disease
(PAD), cerebrovascular disease]. Nonvascular complications include problems
such as gastro paresis, infections, and skin changes. Long-standing diabetes
may be associated with hearing loss.[41] Whether type 2 DM in elderly
individuals is associated with impaired mental function is not clear.
PATHOGENESIS OF COMPLICATIONS
Although chronic hyperglycemia is an important etiologic factor
11
diverse cellular and organ dysfunction is unknown. Four prominent theories,
which are not mutually exclusive, have been proposed to explain how
hyperglycemia might lead to the chronic complications of DM. [33]
One theory is that increased intracellular glucose leads to the formation of
advanced glycosylation end products (AGEs) via the nonenzymatic
glycosylation of intra- and extracellular proteins. Nonenzymatic glycosylation
results from the interaction of glucose with amino groups on proteins. AGEs
have been shown to cross-link proteins (e.g., collagen, extracellular matrix
proteins), accelerate atherosclerosis, promote glomerular dysfunction, reduce
nitric oxide synthesis, induce endothelial dysfunction, and alter extracellular
matrix composition and structure. The serum level of AGEs correlates with the
level of glycemia, and these products accumulate as glomerular filtration rate
declines.[44]
A second theory is based on the observation that hyperglycemia increases
glucose metabolism via the sorbitol pathway. Intracellular glucose is
predominantly metabolized by phosphorylation and subsequent glycolysis, but
when increased, some glucose is converted to sorbitol by the enzyme aldose
reductase. Increased sorbitol concentration alters redox potential, increases
cellular osmolality, generates reactive oxygen species, and likely leads to other
12
aldose reductase inhibitors, has not demonstrated significant beneficial effects
on clinical endpoints of retinopathy, neuropathy, or nephropathy.
Third hypothesis proposes that hyperglycemia increases the formation of
diacylglycerol leading to activation of protein kinase C (PKC). [34]
Among other actions, PKC alters the transcription of genes for fibronectin,
type IV collagen, contractile proteins, and extracellular matrix proteins in
endothelial cells and neurons. Inhibitors of PKC are being studied in clinical
trials.
And the fourth theory proposes that hyperglycemia increases the flux
through the hexosamine pathway, which generates fructose-6-phosphate, a
substrate for O-linked glycosylation and proteoglycan production. The
hexosamine pathway may alter function by glycosylation of proteins such as
endothelial nitric oxide synthase or by changes in gene expression of
transforming growth factor (TGF-β) or plasminogen activator inhibitor-1
(PAI - 1).
Growth factors appear to play an important role in DM-related
complications, and their production is increased by most of these proposed
pathways. Vascular endothelial growth factor A (VEGF-A) is increased locally
in diabetic proliferative retinopathy and decreases after laser photocoagulation.
13
membrane production of collagen and fibronectin by mesangial cells. Other
growth factors, such as platelet-derived growth factor, epidermal growth factor,
insulin-like growth factor I, growth hormone, basic fibroblast growth factor,
and even insulin, have been suggested to play a role in DM-related
complications.[43]
The micro vascular complications appear early, within 5 to 10yrs and
macro vascular complications appear within 15 to 20yrs from the onset of
diabetes. If diabetes is detected early and adequate steps are taken,it may be
possible to significantly delay the occurrence of complications and thereafter
the progression.
DIABETES AND LUNG
There are histopathological changes seen in lungs of diabetics such as
thickened alveolar epithelial and pulmonary capillary basal lamina leading to
reduced pulmonary elastic recoil and lung volume. There is impaired diffusion
due to reduced pulmonary capillary blood volume and thickening of the
basement membrane. The underlying mechanism seem to be microangiopathy
brought in by the nonenzymatic glycosylation of various scleroproteins in
lungs and elsewhere. Since collagen is the most abundant tissue protein in
major bronchi, vessels and interstitium, the alterations in pulmonary functions
14
by keeping the blood sugar levels in the normal range. Similar changes have
been observed with advancing age though progression & intensity of changes
are less marked than seen in patients with DM .[21] Non-enzymatic
glycoslyation induced alteration of lung connective tissue is the most likely
mechanism underlying the mechanical pulmonary dysfunction in diabetic
subjects. This suggests that lung should also be considered as target organ.[22] The review of research work in this field shows two conflicting schools
of thought, each one either expounding involvement or non-involvement of
respiratory system in Type-2 DM. The pulmonary function in diabetes of this
cross section of population is not extensively documented. The present study is
undertaken to evaluate the impact of Type-2 DM and pulmonary function in
this cross section of population and thereby resolve the conflict between two
schools of thought.
RESPIRATORY FUNCTION
The principal function of the lung is to efficiently exchange oxygen in the
distal air spaces with carbon dioxide in the blood. Ventilation-perfusion
matching is accomplished by structural attributes that create an enormous
capillary surface area and exceedingly thin diffusion barrier for gas. The
airways, forming the connection between the outside world and the terminal
15
function in health and disease. Intrapulmonary airways are divided into three
major groups: bronchi, membranous bronchioles and respiratory
bronchioles/gasexchange ducts . Bronchi, by definition, have cartilage in their
wall. Respiratory bronchioles serve a dual function as airways and as part of
the alveolar volume (gas exchange).[42]
Secondary functions of the lung also are important, such as surfactant
synthesis, secretion, and recycling, mucociliary clearance, immunomodulation,
neuroendocrine signaling, and synthesis and secretion of a myriad of molecules
by its epithelial and endothelial cells. The diversity of secondary functions
emphasizes the importance of the lung in homeostasis.
SPIROMETRY
Spirometry is the most basic and frequently performed pulmonary
function test. Pulmonary function testing measures how well you are breathing.
There are different types of breathing tests that can be done during pulmonary
function testing. These tests include spirometry, Peak flow meter, lung
volumes and diffusing capacity. Lung volumes measure different parts of the
breath to determine how much air you can breathe in and out. Some of the
volumes are: total lung capacity, vital capacity and functional residual capacity.
The diffusing capacity of the lungs (DLCO) measures how well gases such as
16
measure the DLCO is the ten second single-breath-hold technique. Spirometry
is a simple test to measure how much (volume) and how fast (flow) you can
move air into and out of your lungs. Spirometry is a non-invasive and
completely painless procedure, like the measurement of blood pressure it is a
useful screen of general health.[42]
NEED FOR SPIROMETRY
Diagnostic
• To evaluate symptoms, signs or abnormal laboratory tests: Symptoms:
shortness of breath, wheezing, cough, phlegm. Signs: diminished breath
sounds, cyanosis.
• To screen individuals at risk of having pulmonary disease: Smokers,
occupational exposure
• Assess preoperative risk
• Assess prognosis (lung transplants)
Monitoring
• To assess therapeutic interventions: Bronchodilator therapy Steroid
treatment for asthmatics, interstitial lung disease, etc Management of
17
• To describe the course of diseases affecting lung function: Pulmonary
diseases (Obstructive or interstitial diseases) Cardiac diseases (congestive heart
failure) Neuromuscular disease
• To monitor persons in occupations with exposure to injurious agents
Disability/Impairment Evaluations
• To assess patients as part of a rehabilitation program: Medical,
Industrial,Vocational
• To assess risks as part of an insurance evaluation
Contraindications
• Hemoptysis of unknown origin
• Pneumothorax
• Unstable cardiovascular status
• Thoracic/abdominal/cerebral aneurysm
• Recent thoracic surgery
• Nausea or vomiting
Types of Spirometers
Spirometers use different methods of measuring patient’s lung values. The
most common type of device is called a “pneumotach”. This device has been
18
flow where particles of gas are accelerated, creating a pressure gradient to
measure flow and calculate a volume of gas (essentially it measures a drop
in pressure).
Anemonometer, this type of flowmeter consists of a thin platinum wire,
electrically heated to constant temperature, and centrally located in a tube. As
gas passes through the meter the wire cools off requiring electrical energy to
maintain its temperature. The extra electrical energy is a measure of energy.
This system is very vulnerable to damage and needs to be handled with extra
care. The flowmeters are also not reliable due to the inability to know the
direction of the patient’s flow to measure inspiration and expiration.
Ultrasonic spirometers utilize transducers located on either side of the flow
sensor and receive sound in alternating directions. When the gas flow moves
through the tube, the pulse that travels against the flow is slowed down and
takes a longer time to reach the opposite transducer. The pulse traveling with
the flow is sped up and takes a shorter time to reach the opposite transducer.
The gas flow in the flow sensor is then calculated from upstream and
downstream times. This calculation is independent of gas composition,
pressure, temperature and humidity.
Turbine spirometers use an infrared light to measure inspiratory and
19
These rotations are measured by an infrared beam. They do not need to be
calibrated or corrected for BTPS and are not influenced by pressure changes or
air temperature.
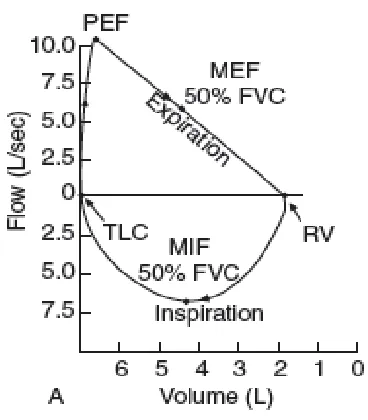
Flow Volume Loop
The Flow Volume Loop is the most important curve in spirometry. It
shows the relationship between flow (how fast air moves) and volume (how big
of a breath). The normal flow volume is the graphic display of the FVC and is
used to evaluate the patient’s effort and test technique. A normal flow volume
loop starts with a hard expiration to the peak expiratory flow (PEF). After the
PEF the patient’s flow decreases as more air is expired. [46] The Forced Expiratory Flow (FEF 25) measures the point were 25% of the volume is
expired. The (FEF 50) and (FEF 75) are where 50% and 75% of the volume is
expired. The (FEF 25-75) is the mean flow between the FEF 25 and FEF 75.
This measurement is used in the diagnoses of many respiratory diseases.
(A)Normal. Inspiratory limb of loop is symmetric and convex. Expiratory
limb is linear. Flow rates at the midpoint of the inspiratory and
expiratory capacity are often measured. Maximal inspiratory flow at
50% of forced vital capacity (MIF 50%FVC) is greater than maximal
expiratory flow at 50% FVC (MEF 50%FVC) because dynamic
20
Fig 2: Normal flow-volume loop of spirometry
(B) Obstructive disease (eg, emphysema, asthma). Although all flow rates
are diminished, expiratoryprolongation predominates, and MEF < MIF.
Peak expiratory flow is sometimes used to estimate degree of airway
obstruction but is dependent on patient effort. [50]
Fig 3:Flow-volume loop (Obstructive pattern)
21
Fig 4: Flow-volume loop (Restrictive pattern)
(C) Restrictive disease (eg, interstitial lung disease, kyphoscoliosis). The
loop is narrowed because of diminished lung volumes, but the shape is
generally the same as in normal volume. Flow rates are greater than
normal at comparable lung volume because the increased elastic recoil
of lungs holds the airways open.
Interpretation
Interpretation of spirometry results should begin with an assessment of test
quality. Failure to meet performance standards can result in unreliable test
results. The American Thoracic Society (ATS) defines acceptable spirometry
as an expiratory effort that shows (1) minimal hesitation at the start of the
forced expiration (extrapolated volume (EV) £5% of the FVC or 0.15 L,
22
(3) meets 1 of 3 criteria that define a valid end-of-test: (a) smooth curvilinear
rise of the volume-time tracing to a plateau of at least 1-second duration; (b) if
a test fails to exhibit an expiratory plateau, a forced expiratory time (FET) of
15 seconds; or (c) when the patient cannot or should not continue forced
exhalation for valid medical reasons.[25]
In patients that have significant loss of lung elastic recoil (pulmonary
emphysema), spirometry may show "negative effort dependence of forced
expiratory flow." In other words, the effort that has the highest peak expiratory
effort may produce a lower FEV1 because of dynamic compression of the
larger airways. In this circumstance, the effort with the highest FEV1produced
by a submaximal effort should not be reported. Although not yet a standard, it
appears that selecting only efforts that have a time to peak flow (TPEF) less than
or equal to 0.12 seconds helps eliminate this effect.[46,47]
Additionally, the 2 largest values for FVC and the 2 largest values for
FEV1 in the same testing session should vary by no more than 0.15 L (0.1 L if
the largest value is < 1 L). A recent study has shown start-of-test problems
(affecting FEV1 measurements) to be relatively uncommon (2% prevalence in
one series) and end-of-test problems (affecting FVC quality) being very
23
after 3-4 seconds of forced exhalation has been shown to greatly enhance the
ability of patients with airflow obstruction to satisfy end-of-test criteria. [51]
Inspection of the volume-time tracing aids in identification of early
termination of expiration by evaluating the presence of an expiratory plateau.
In the absence of an expiratory plateau, a 12- to 15-second expiratory time
ensures the quality of the FVC. Inspection of the start of the volume-time
tracing can identify a hesitant start, which can result in a falsely low FEV1.
Reproducibility of the FVC and the FEV1 helps ensure that the results truly
represent the patient's lung function. Attention should be focused on 3 key
parameters: FVC, FEV1, and the FEV1 -to-FVC ratio. [45]
In the United States, normal values and lower limits of normal defined by
Hankinson et al.[26] (the National Health and Nutrition Examination Survey [NHANES] III predicted set) should be used. These provide specific equations
for whites, African Americans and Mexican Americans. If the patient belongs
to another ethnic group, the predicted values and lower limits of normal
provided for whites by Hankinson et al should be reduced by 12% by
multiplying the predicted value by 0.88 before comparison with the patient's
24
Disproportionate reduction in the FEV1 as compared to the FVC (and
therefore the FEV1 -to-FVC ratio) is the hallmark of obstructive lung diseases.
This physiologic category of lung diseases includes but is not limited to
asthma, acute and chronic bronchitis, emphysema, bronchiectasis, cystic
fibrosis, pneumonia, alpha1-antitrypsin deficiency, and bronchiolitis. The
expiratory flow at any given expiratory volume is reduced. The mechanism
responsible for the reduction in airflow can be bronchial spasm, airway
inflammation, increased intraluminal secretions, and/or reduction in
parenchymal support of the airways due to loss of lung elastic recoil.[52]
The use of a fixed lower limit of normal for the FEV1/FVC ratio as
proposed by the Global Initiative for Obstructive Lung Disease (GOLD) lacks
a scientific basis and results in misclassifying patients at either end of the age
spectrum. Young patients are classified as "normal" when airflow obstruction
is present, and older patients are classified as showing obstruction when no
airflow obstruction is present. The use of the GOLD threshold in clinical
practice should be discouraged.[39]
Reduction in the FVC with a normal or elevated FEV1 -to-FVC ratio
should trigger further diagnostic workup to rule out restrictive lung disease.
Because the FEV1 is a fraction of the FVC, it also is reduced, but the FEV1
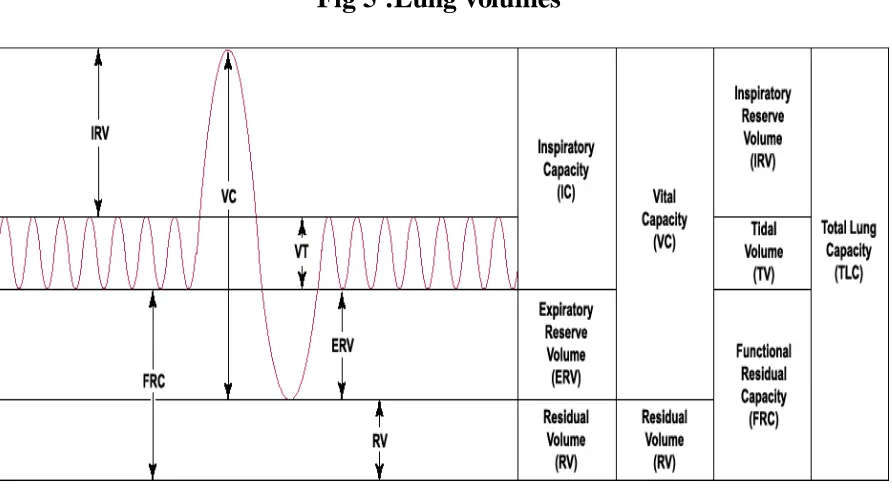
25 LUNG VOLUMES
Fig 5 :Lung volumes
FVC
Forced vital capacity, volume change between a full inspiration to total lung
capacity and a maximal expiration to residual volume.
FEV1
Forced expiratory volume at 1 second, volume of air that can be expired in 1
second after a maximal inspiration.
FEV1/FVC
26 FEV1/FEV6
Ratio between FEV1 and FEV6. This is a test that is used in the primary care
or physicians office setting because it is easier to perform and obtain from the
patient.
FEF 25-75%
The average expired flow over the middle half of the FVC and is regarded as a
more sensitive measure of small airways narrowing than the FEV1.
PEF
Peak expiratory flow, maximum flow generated during expiration performed
with maximal force and started after a full inspiration.
FRC
Functional Residual CapacitJy, volume of gas contained in the lung after a
normal expiration.
IVC
Inspiratory Vital Capacity, the volume change between a maximal expiration to
residual volume and a full inspiration to total lung capacity.
MVV
Maximal Voluntary Ventilation, a measure of the maximum amount of air that
27 RV
Residual Volume, volume that remains in the lungs after a maximal expiration,
cannot be measured by spirometry.
TLC
Total Lung Capacity, the volume of gas contained in the lung after a full
inhalation, cannot be performed by spirometry because it includes the residual
volume.
VC (Vital Capacity)
28
REVIEW OF LITERATURE
1) Hiroshi Mori et al examined the possible association between the
vascular complications of diabetes and changes in pulmonary function, they
performed pulmonary function tests including assessment of the diffusing
capacity (%DLco) in 80 patients with non-insulin dependent diabetes mellitus
(45 males and 35 females) without overt lung or heart disease was performed.
The mean age of the subjects was 57.9 years and the mean duration of diabetes
was 10.8 years. The %DLco decresed significantly as the duration of diabetes
increased (r=-0.38, p<0.01), and the same relationship was also observed in
non-smoking individuals (n=37) ,The reduction in %DLco was greater in
patients with diabetic microangiopathy (especially nephropathy) and in those
treated with insulin. Other spirometric functions showed no relationship to the
duration of DM, the degree of microangiopathy or the type of treatment. These
results suggest that diabetic microangiopathy play on important role in the
decrease of %DLco. [36]
In this study, %DLco was found to correlate negatively with
duration of diabetes. Asanuma et al, and Sandler at al have reported that as the
duration of diabetes increase, the pulmonary diffusion capacity is decreased.
Uchida et al in a study of ventilation-perfusion scintigrams in diabetics,
29
defect. As these patients had a longer duration of diabetes and a higher
incidence of retinopathy, pulmonary microangiopathy was suggested. [36]
2) Walter.E.Robert, Alexa Beiser, Rachel J, Givelber,George T,
O’Connor, et al. studied “Association between glycemic state and lung
function”.
This study was conducted to analyze the relationship of diabetes
and of fasting blood sugar to level of Pulmonary function test by Spirometric
assessment in 87 members of Framingham and pulmonary function FEV1,
FVC & FEV1/FVC ratio was detorating Collins survey 11 Spirometer and the
predicted pulmonary function test was determined by the coefficients of
regression of pulmonary function test on age, sex and body habitus.
Results :
The diabetes and a higher levels of FBS were associated with lower
pulmonary function-The FVC was lower by 109 ml, FEV1 was lower by 27 ml
and FEV1/FVC% was higher by 1.5% in the diabetics compared to non
diabetics.[27]
3) Lange P. et al Studied- the possible association between diabetes
30
expiratory volume in 1 second in 11,763 subjects of 20yrs or older
284 of the participants were with diabetes mellitus.
Results:
There was a slight impairment of lung function it was more prominent
in subjects treated with insulin than those taking oral hypoglycemic
agents and/or diet, FVC was reduced by 334ml and FEV1 239ml in
subjects treated with insulin and FVC was reduced by 184ml and
FEV1 117ml in subjects treated with oral hypoglycemic agents and/or
diet compared to controls. [28]
4) SCHNAPF et al found that there was reduction of lung volumes
in IDDM patients when the patients also had decreased joint mobility.
Consequently, it has been suggested that non-enzymatic glycosylation of
connective tissue, especially the collagen, might be responsible for both lung
and jont abnormalities. Their findings of an association between raised values
of plasma glucose and lung function impairment are in accordance with this
hypothesis. [38]
The prevalence of self reported DM in their study sample was 2.5%, which
is slightly higher than the estimated prevalence of DM of 1-1.5% in the Danish
31
resulting in the bulk of the participants in the age group being between 40-70
years, in whom the prevalence of NIDDM can be as high as 4.5%. However
the age distribution and the treatment regimes strongly suggests that the great
majority of the diabetic subjects investigated had NIDDM. This means that
some of the subjects in the DM1 group, especially the ones older than 60 years
of age were suffering from NIDDM in spite of treatment with insulin.
Due to small number of diabetic subjects in many of the subgroups, the
study does not allow detailed analysis of the impact of DM on ventilator
function in the different age group. Even so, the slight lung function
impairment in the diabetic subjects was present in all age groups and there was
no significant interaction between age and DM in the regression analysis.
Many confounding factors might lead to reduction of both FEV1 and
FVC in diabetic subjects. Two of them are obesity and cardiac failure. As
many subjects with NIDDM are obese, the reduction of FEV1 and FVC in
NIDDM might therefore be the result of being overweight rather than the result
of NIDDM. However since they included BMI in the regression model, obesity
was unlikely to be an explanation for observed lung function impairment. In
addition, the most pronounced lung function impairment was in the DM1
group. Although none of the diabetic subjects had manifest heart failure during
32
congestion was present in some of the diabetic subjects, as ischemic heart
disease is more prevalent in subjects with DM than in normals. [38]
5) Davis A Wendy, Matthew Knuiman, Peter Kendell, Valerie Grange,
Timothy M.E.Davis et al Studied- Glycemic exposure is associated with
reduced pulmonary function test in Type 2 diabetes.
In this study 495 patients with Type-2 DM who had no history of
pulmonary disease was studied between 1993 and 1994 by community –based
cohort study and 125 patient was restudied 7 years later for FVC, FEV1, VC &
PEF corrected for BTPS and were expressed as absolute terms or as percentage
predicted for age, sex and height.
Results:
There was a decrease in mean percentage-predicted values of each
Spirometric measure to 10% in the whole cohort study at baseline and absolute
measures continued to decline at an annual rate of 68ml, 71ml and 84ml/year
and 17 l/min for FVC, FEV1, VC and PEF [29] respectively in the study group
6) Malcolm sander et al Studied-Is lung a ‘target organ’ in diabetes mellitus.
There is a histopathological evidence of lung involvement in subjects
with diabetes mellitus by thickened alveolar epithelial and pulmonary capillary
basal laminae suggestive of pulmonary microangiopathy. Abnormal pulmonary
33
reduced pulmonary elastic recoil in diabetes, impaired diffusion due to a
reduced pulmonary capillary blood volume and nonenzymatic
glycosylation-induced alteration in the lung connective tissue is the most likely pathogenesis
mechanism underlying the mechanical pulmonary dysfunction[21] in diabetic
subjects.
7) Spomenka Ljubic et al study showed a reduction of diffusion capacity
for carbon monoxide in DM patients. Diabetes can cause the development of
pulmonary complications due to collagen and elastin changes, as well as
microangiopathy. This study demonstrates the relationship between pulmonary
complications and other chronic complications of diabetes. 27 patients with
diabetes, aged 21 to 62 years, who had the disease from 3-32 years, were
included in this study. The protein excretion rate(PER) and the diffusion
capacity of the lung for carbon monoxide (DLco) were included as parameters
of the severity of complications. PER was determined by Biuret method. DLco
was measured by single breath method and was corrected by the measurement
of alveolar volume (V/A). [23] The values of DLco as corrected by V/A (DLco/VA) were included in the statistical evaluation of the results. The
variations of age, duration of DM, and complication parameters were included
in a multiple regression model with forward, stepwise selection to asses their
34
predictors of DLco/VA (R2=0.46, R2=0.32, p<0.022). However, proteinuria
was the only significant independent predictor of DLco / VA. This finding
indicates that both renal and pulmonary complications of diabetes share a
similar microangiopathic background.
8) Davis Timothy M. E, Matthew Knuiman, Peter Kendell, Hien Vu,
Wendy A. Davis et al Studied – Reduced pulmonary function is associated in
Type-2-Diabetes mellitus.
The study was conducted on 421 subjects. Detailed demographic and
diabetic specific-data were collected, spirometry was performed and FVC,
FEV1, VC and PEF were measured and were expressed as percentage of
prediction values for age, sex and height the means of all Spirometric measures
were reduced by 9.5%. HbA1c was not associated with any measure of lung
function but the diabetes duration was significantly associated with FEV1%
prediction and PEF % prediction had borderline associations with FVC%
prediction and VC% prediction.[30] Pulmonary function is reduced in type 2
DM and diabetes duration has more influence on pulmonary function than the
glycemic control.
9) Sreeja C.K, Elzabeth Samuel, C.Kesava chandran, Shankar Shashidaran.
35
Lung function tests were carried out in20 Type2Diabetes mellitus and
20 Type1 Diabetes mellitus and 40 subjects as controls. There was a significant
reduction in FEV1/FVC% in both diabetes mellitus groups compared with
controls. The decrease in FEV1/FVC% in both the groups may be related to the
poor mechanical properties of lung. Viz lung compliance and elastic recoil of
lungs, TLC was lower in diabetes mellitus group because of alteration in
collagen and elastin by loss of elastic recoil and low lung volumes and
abnormal pressure volume relationship may be due to the respiratory muscle
weakness. [31,40]
10) SK Rajan et al study of spirometric evaluation of type 1 DM, was a
cross sectional study of 30 patients (group1) who are on insulin therapy. Group
2 consisted of age matched, non-smoking healthy volunteers who acted as
controls. Spirometric revealed normal findings in 10 patients (33%), and
abnormal findings in 20 patients (67%). Among these 20 patients with
abnormal findings obstructive pattern in 8 patients, restrictive pattern was
present in 9 patients and mixed pattern was observed in 7 patients. This study
showed that the lung has to be considered as one of the target organs in type 1
DM. In view of the possibility pneumopathy in asymptomatic type1DM, all
persons with long –standing type1DM should undergo regular assessment of
36
DM is associated with widespread hormonal, metabolic and micro vascular
abnormality, as well as with disturbances of the function of many organ
systems. The kidneys. Eyes, cardio vascular system and respiratory system can
be damaged. The aim of the study was to investigate lung function in DM and
renal complications. The development of these complications could be
explained by the biochemical alteration of connective tissue constituents,
particularly collagen and elastin, as well as micro angiopathy due to a
non-enzymatic glycosylation of proteins induced by chronic hyperglycemia.
Collagen is an abundant structural protein found in the previously
mentioned organic systems, so the disturbance of the function of those systems
can be expected. The kidneys, eyes and lungs of patients with diabetes are
affected consequently, and the patient develops obstructive and restrictive
disorders. As a result of alveolar capillary membrane thickenings due to
collagen and elastin alterations and microangiopathy, the capacity for the
diffusion of carbon monoxide is reduced.
An altered rate urinary protein excretion due to glomerular capillary injury
also can be found. The aim of this study was to assess the presence of
pulmonary complications. The values the proteins excretion rate and the
diffusion capacity for carbon monoxide (DLco) corrected by alveolar volume
37
retinopathy and its connection with the previously mentioned renal and
pulmonary complications, because it is believed that they share a similar
etiopathogenic mechanism.
11) Benbassat Carlos A, Ervin Stern, Mordechai Kramer, Joseph Lebzelter,
Ilana Blum, Gershon Fink et al Studied -pulmonary function in patients with
Diabetes mellitus.
Pulmonary complications of diabetes mellitus have been poorly
characterized. Some have reported normal pulmonary function test others have
found abnormal lung volumes, pulmonary mechanics and diffusing capacity.
The study was conducted in patients with DM using a combined
cardiopulmonary exercise test in 27 patients with DM aged 48 ± 13 years. The
FVC, FEV1 and FEF, MEF were within the predicted values, but the residual
volumes and TLC ratio was slightly elevated. Comparison by diabetes type
showed no significant differences in FEV1 and FEF, MEF, residual volumes
and TLC ratio was significantly elevated in Type-1 DM compared with
Type2-Diabetes mellitus. There was no correlation between the pulmonary function
test and duration of disease, presence of microangiopathy or glycemic
control.[32]
12) Dr.Mohankumar and Dr.S.Arulmozhi et al Studied –Pulmonary
38
lung volume and lung compliance are reduced, the central and peripheral
airflows are reduced, and acceleration of aging process in pulmonary
connective tissue are seen. There is interference with connective tissue
cross-links and the presence of increased non-enzymatic glycosylation, and
modification of alveolar surfactant action. The diffusing capacity for carbon
monoxide is reduced because of pulmonary microangiopathy in diabetes
39
AIM OF THE STUDY
To study the ventilatory function of individuals with type 2
diabetes mellitus by performing spirometry.
To record the pulmonary function test in Type-2 diabetes mellitus
and control group.
To evaluate the impact of Type-2 DM on pulmonary functions by
comparing with control groups.
To correlate the spirometric values and variables(duration,FBS,
40
MATERIALS AND METHODS
A case-control study, descriptive, prospective study of the lung function
of diabetics compared with age and sex-matched non-diabetic controls.
Sample size:
The sample used in this study consisted of 100 subjects – 50 Diabetics, 50
Healthy Non-Diabetics.
Sampling procedure:
50 Diabetic individuals were recruited from those attending outpatient
departments of Government Rajaji Hospital, Madurai. 50 Healthy
Non-Diabetic individuals from the general population were taken as controls.
Ethical clearance:
Ethical clearance was obtained from Government Rajaji Hospital ethical
committee for human research to conduct the study.
Inclusion criteria:
Type 2 diabetes mellitus of more than 5 years duration
able to give informed consent.
41
Present or past history of respiratory illness that might affect lung
function such as asthms, COPD, tuberculosis, bronchiectasis, interstitial
lung disease.
History of occupational exposure to any substance that could affect lung
function.
Individuals with current or recent upper respiratory or lower respiratory
infection, that could predispose to heightened airway reactivity.
Individuals with unacceptable spirometric technique. An unacceptable
spirometry was that in which FEV1 or FVC could not be correctly
measured due to
Cough
Obstruction of teeth or toungue
Sub-maximal effort
Air escape
Effort sustained for less than 6 seconds duration
Lack of understanding of the procedure
Recent thoracic and abdominal surgery
Materials
42 Methodology
Diabetics and controls were selected as per the criteria laid down. Their written
consent was taken. The screening of diabetic subjects and control group was
done for exclusion criteria. The history was elicited. Age, height, weight, BMI
were recorded. Each subject was instructed to visit cardio respiratory
laboratory with 6 hrs of fasting on a specific date, the blood samples [3ml
volume] was drawn for estimation of FBS and glycated hemoglobin.
Performance of PFT by a patient
The performance of the pulmonary function test was demonstrated. The
43
MICRO MEDICAL computerized Spirometer, for three times at every 15
minutes interval. The FVC, FEV1, PEF, FEV1/FVC% and FEF25-75% were
recorded. And the best of the three was taken into account. The subject was
asked to take breakfast and blood sample was drawn 2 hrs later for PPBS
estimation.
The anthropometric, respiratory, blood glucose parameters and glycated
Hb levels were recorded in their respective proforma.
Statistical Tools
The information collected regarding all the selected cases were recorded
in a Master Chart. Data analysis was done with the help of computer using
Epidemiological Information Package (EPI 2010) developed by Centre for Disease Control, Atlanta.
Using this software range, frequencies, percentages, means, standard
deviations, chi square and 'p' values were calculated. Kruskul Wallis
chi-square test was used to test the significance of difference between quantitative
variables and Yate’s chi square test for qualitative variables. A 'p' value less
44
OBSERVATION AND RESULTS
A total number of 100 subjects were suitable for analysis. There were 50
diabetics (CASES) and 50 non-diabetic group (CONTROL)
A : PROFILE OF CASES STUDIED
Table 1 : Age distribution
Age group
Cases group
Control group
No % No %
Upto 40 years 2 4 6 12
41-50 years 35 70 28 56
51-60 years 13 26 16 32
Total 50 100 50 100
Range 39-58 years 36-57 years
Mean 46.6 years 47.48 years
SD 5.01 years 5.21 years
‘p’
0.6123
Not significant
The Diabetes group had an age of 46.6 +5.01 years and the Control group 47.48
45
Fig 6 : Age distribution
0
5 10 15 20 25 30 35
<40 41-50 >51
2
35
13
6
28
16
AGE IN YEARS
46
Table 2 : Sex distribution
Sex
DM Cases group
Control group
No % No %
Male 27 54 28 56
Female 23 46 22 44
Total 50 100 40 100
‘p’
0.9193
Not significant
Sex distribution of the study group and control group did not have any
significant difference ( p = 0.9193).
Fig 7 : Sex distribution
0 5 10 15 20 25 30
Males Females
27
23 28
22
47
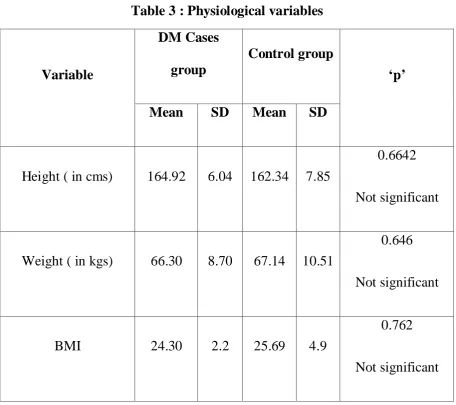
Table 3 : Physiological variables
Variable
DM Cases group
Control group
‘p’
Mean SD Mean SD
Height ( in cms) 164.92 6.04 162.34 7.85
0.6642
Not significant
Weight ( in kgs) 66.30 8.70 67.14 10.51
0.646
Not significant
BMI 24.30 2.2 25.69 4.9
0.762
Not significant
Height ,weight and BMI of the control and Diabetic cases studied did not have
48
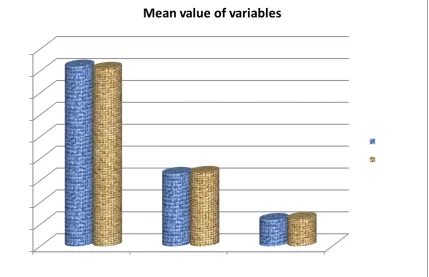
Fig 8 : Physiological variables
0 20 40 60 80 100 120 140 160 180
Height weight BMI
Mean value of variables
49
Table 4 : Blood Sugar levels
Blood Sugar
DM Cases
group Control group ‘p’
Mean SD Mean SD
Fasting 193.12 53.70 88.00 10.12
0.0001 Significant
Post prandial 267.16 63.28 125.74 11.31
0.0001 Significant
The P value for the basic characters FBS and PPBS is <0.0001 is significant.
Table 5 : Duration of Diabetic cases
Duration in years No.of cases % of cases
5-6 14 28%
7-8 17 34%
9-10 14 28%
50
Fig 9 : Mean blood sugar values between cases and controls
Fig 10 : Duration of Diabetic cases 0
50 100 150 200 250 300
Cases
Controls 194
88 267
125
FBS PPBS
28%
34% 28%
10%
DURATION IN YEARS
51
The pulmonary function test was conducted on 50 Type-2 diabetics with a
history of diabetes for more than 5 yrs duration and 50 healthy individuals. An
attempt was made to evaluate the effect of Type-2 DM on pulmonary functions.
The effect of extent of diabetes status as reflected by FBS, PPBS, HB1Ac and
duration on pulmonary function was also evaluated. The pulmonary function
tests recorded were FVC, FEV1, FEV1/FVC%, PEF and FEF25%-75%.
The basic character’s Age, sex, height, weight, BMI, FBS and PPBS of
cases and controls, are shown in the table 3&4. The P value for the basic
characters FBS and PPBS is <0.05 which is significant, however the basic
character’s age, sex, ht, wt, BMI and P value is >0.05 which is not significant.
B : Effect of Type-2 diabetes mellitus on pulmonary function test Table 6: Observed Spirometric results
Pulmonary function test
DM Cases group (n=50)
Control group
(n=50) P
Value
Significance
Mean SD Mean SD
FVC 2.67 0.48 3.25 0.24 0.0001 Significant
FEV1 1.68 0.37 2.32 0.38 0.0001 Significant FEV1/FVC
52
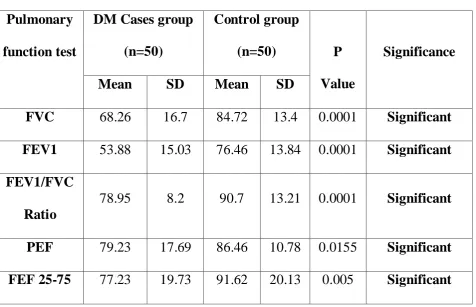
Table 7 : % Predicted values of PFT Pulmonary
function test
DM Cases group (n=50)
Control group
(n=50) P
Value
Significance
Mean SD Mean SD
FVC 68.26 16.7 84.72 13.4 0.0001 Significant
FEV1 53.88 15.03 76.46 13.84 0.0001 Significant FEV1/FVC
Ratio
78.95 8.2 90.7 13.21 0.0001 Significant
PEF 79.23 17.69 86.46 10.78 0.0155 Significant FEF 25-75 77.23 19.73 91.62 20.13 0.005 Significant
Spirometric values were consistently lower in Diabetic case groups than control
groups. However, the differences were statistically highly significant for
FVC,FEV1 &FEV1/FVC ratio (p=0.0001) and moderately significant for PEF
53
Fig11:Comparison of spiromtric values among Diabetics and Non Diabetics
Mean %predicted spirometricvalues among Diabetics and Non-Diabetics 0
10 20 30 40 50 60 70 80 90 100
FVC FEV1 FEV1/FVC PEF FEF 25-75
68.26
53.88
78.95 79.23 77.23
84.72
76.46
90.7
86.46
91.62
54
C: Relationship between spirometricvalues and other variables in Diabetics
[image:61.595.39.526.197.442.2]PFT and DURATION
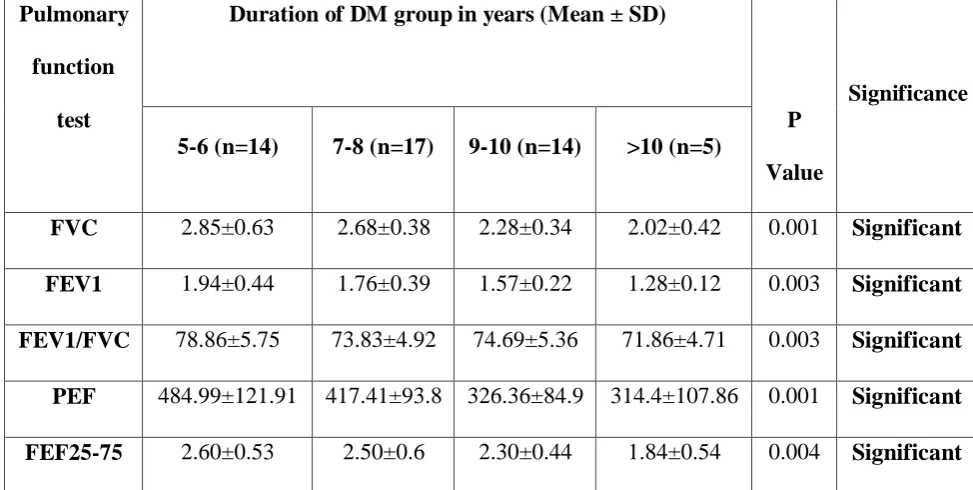
Table 8 : Duration and Observed Spirometric results
Observed spirometric values were inversely related to the duration of diabetes.
as the duration increases the spirometric values were consistenly decreased,
which is highly significant for all parameters. (p<0.005)
Pulmonary
function
test
Duration of DM group in years (Mean ± SD)
P
Value
Significance
5-6 (n=14) 7-8 (n=17) 9-10 (n=14) >10 (n=5)
FVC 2.85±0.63 2.68±0.38 2.28±0.34 2.02±0.42 0.001 Significant
FEV1 1.94±0.44 1.76±0.39 1.57±0.22 1.28±0.12 0.003 Significant
FEV1/FVC 78.86±5.75 73.83±4.92 74.69±5.36 71.86±4.71 0.003 Significant
PEF 484.99±121.91 417.41±93.8 326.36±84.9 314.4±107.86 0.001 Significant
55
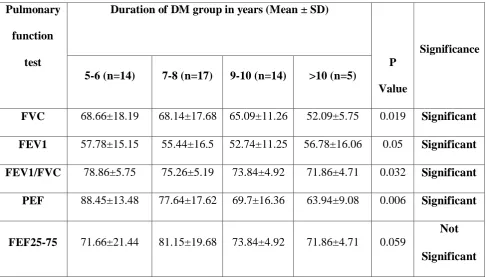
Table 9 : Duration and% Predicted values of PFT
There was a negative correlation between the spirometric parameters and the
duration of diabetes, which is statistically significant for all parameters except
FEF 25-75%.
Pulmonary
function
test
Duration of DM group in years (Mean ± SD)
P
Value
Significance
5-6 (n=14) 7-8 (n=17) 9-10 (n=14) >10 (n=5)
FVC 68.66±18.19 68.14±17.68 65.09±11.26 52.09±5.75 0.019 Significant
FEV1 57.78±15.15 55.44±16.5 52.74±11.25 56.78±16.06 0.05 Significant
FEV1/FVC 78.86±5.75 75.26±5.19 73.84±4.92 71.86±4.71 0.032 Significant
PEF 88.45±13.48 77.64±17.62 69.7±16.36 63.94±9.08 0.006 Significant
FEF25-75 71.66±21.44 81.15±19.68 73.84±4.92 71.86±4.71 0.059
Not
56
Fig 12 : Duration and% Predicted values of PFT
0 10 20 30 40 50 60 70 80 90 100
FVC
FEV1
57
Fig 13 : Comparison of %Predicted FEV1/FVC with duration of Diabetics
50 60 70 80 90 100 110
4 6 8 10 12
PPBS
FEV1/FVC %
58
PFT AND FASTING BLOOD SUGAR LEVEL
Table 10 : FBS Level and Observed Spirometric results
Pulmonary function test
FBS (mg/dl) in DM group (Mean ± SD)
P Value
Significance <130 (n=8)
131-200 (n=23)
201-300 (n=19)
FVC 3.24±0.84 2.64±0.66 2.22±0.58 0.011 Significant FEV1 2.53±1.29 1.81±0.44 1.68±0.29 0.012 Significant FEV1/FVC 84.85±1.76 76.11±5.75 73.8±4.59 0.001 Significant PEF 467.25±140.49 415.26±120.2 355±96.11 0.046 Significant
FEF25-75 2.94±1.42 2.43±0.62 2.33±0.51 0.25
Not Significant
Observed spirometric values were inversely related to the Fasting blood sugar
level of diabetes. as the blood sugar level increases the spirometric values were
59
Table 11 : FBS level and% Predicted values of PFT
Pulmonary function test
FBS (mg/dl) in DM group (Mean ± SD)
P Value
Significance <130 (n=8)
131-200 (n=23)
201-300 (n=19)
FVC 70.2±4.28 69±18.27 63.74±12.86 0.005 Significant
FEV1 57.29±2.7 56.11±15.22 55.81±13.56 0.009 Significant
FEV1/FVC 78.9±1.7 76.11±5.74 74.85±6.04 0.04 Significant
PEF 76.27±21.8 80.73±18.28 72.35±14.85 0.279
Not Significant
FEF25-75 61.7±19.9 76.53±19.79 82.54±18.91 0.148
Not Significant
Poor glycemic control were reflected in Pulmonary function test as fasting
blood sugar level increases the spirometric values were decreased with
significant p value for FVC,FEV1 and FEV1/FVC ratio.
60
Fig 14 : FBS level and% Predicted values of PFT
0 10 20 30 40 50 60 70 80 90 100
FVC
FEV1
FEV1/FVC <130 131-200 >200
61
Fig 15 : Comparison of FEV1/FVC ratio with FBS among Diabetics
50 60 70 80 90 100 110
100 150 200 250 300
FBS
FEV1/FVC %
62
PFT AND POSTPRANDIAL BLOOD SUGAR LEVEL
Table 12 : PPBS Level and Observed Spirometric results Pulmonary
function test
PPBS (mg/dl) in DM group (Mean ± SD)
P Value
Significance <200 (n=10)
201-300 (n=26)
>300 (n=14)
FVC 2.7±0.83 2.55±0.57 2.36±0.41 0.003 Significant
FEV1 2.23±0.59 1.77±0.39 1.57±0.36 0.002 Significant
FEV1/FVC 80.1±5.63 76.11±5.03 74.04±4.87 0.002 Significant
PEF 444.69±140.03 362.1±113.72 317.36±98.8 0.036 Significant
FEF25-75 2.63±0.55 2.21±0.43 2.11±0.34 0.014 Significant
High post prandial blood sugar levels were also associated with Low
spirometric values, which is highly significant for all parameters of spirometry
63
Table 13 : PPBS level and% Predicted values of PFT
Pulmonary function test
PPBS (mg/dl) in DM group (Mean ± SD)
P Value
Significance <200 (n=10)
201-300 (n=26)
>300 (n=14)
FVC 67.77±14.48 65.67±15.7 63.65±18.97 0.0180 Significant
FEV1 60.63±12.66 54.97±14.04 49.55±15.70 0.0178 Significant
FEV1/FVC 75.10±3.88 73.73±5.6 71.47±6.91 0.028 Significant
PEF 73.19±21.59 80.65±16.74 73.61±15.24 0.349
Not Significant
FEF25-75 67.39±13.85 74.45±17.9 90.84±21.16 0.006 Significant
The % predicted values of spirometry and postprandial blood sugar levels were
statistically significant for FVC,FEV1,FEV1/FVC with p<0.05, which indicate
poor glycemic control were reflected in pulmonary functions with the decline of
64
Fig 16 : PPBS level and% Predicted values of PFT
0 10 20 30 40 50 60 70 80 90 100
FVC
FEV1
65
Fig 17 : Comparison of %Predicted FEV1/FVC with PPBS among Diabetics
50 60 70 80 90 100 110
150 200 250 300 350 400
PPBS
FEV1/FVC %
66 PFT AND HbA1c LEVEL
Table 14 : HbA1c Level and Observed Spirometric results Pulmonary
function test
HbA1c (mg/dl) in DM group (Mean ± SD)
P Value
Significance 5-7(n=18) 7.1-9(n=24) >9(n=8)
FVC 2.75±0.60 2.49±0.48 1.81±0.66 0.001 Significant
FEV1 1.98±0.47 1.76±0.33 1.53±0.20 0.019 Significant
FEV1/FVC 64.35±5.28 61.08±5.54 58.67±3.4 0.028 Significant
PEF 458.83±140.81 371.54±92.43 356.25±94.28 0.029 Significant
FEF25-75 2.57±0.54 2.37±0.53 2.14±0.59 0.59
Not Significant
Observed spirometric results were negatively correlated with HbA1c levels with
significant p (<0.05) value for FVC, FEV1, FEV1/FVC,PEF. Which indicates