ECHOCARDIOGRAPHIC EVALUATION OF CARDIAC FUNCTION IN
PATIENTS WITH NEWLY DETECTED TYPE 2 DIABETESMELLITUS
Dissertation Submitted to
THE TAMILNADU DR. M.G.R. MEDICAL UNIVERSITY
In partial fulfillment of the regulations for the award of the degree of
M.D. (GENERAL MEDICINE) BRANCH – I
GOVT. STANLEY MEDICAL COLLEGE & HOSPITAL
CHENNAI-1
THE TAMILNADU DR. M.G.R. MEDICAL UNIVERSITY
CHENNAI
CERTIFICATE
This is to certify that this dissertation entitled ―ECHOCARDIOGRAPHIC EVALUATION OF
CARDIAC FUNCTION IN PATIENTS WITH NEWLY DETECTED TYPE 2 DIABETES
MELLITUS ‖ submitted by Dr. S. SAMUTHIRAVEL, to the Tamil Nadu Dr. M.G.R. Medical
University Chennai is in partial fulfillment of the requirement for the award of M.D. DEGREE
BRANCH –I (General Medicine) and is a bonafide research work carried out by him under direct
supervision and guidance.
Prof. Dr. MAGESH KUMAR, M.D.,
Professor and Head, Dept. of Medicine, Govt. Stanley Medical College and Hospital
Chennai-600001.
Prof. Dr. A GOWRISHANKAR M D.,
Chief UNIT III& Guide, Dept. of Medicine Govt. Stanley Medical College and Hospital
Chennai-600001.
Prof. Dr. C.VAMSADHARA, M.D., Ph.D The Dean
DECLARATION
I solemnly declare that the dissertation entitled ―ECHOCARDIOGRAPHIC EVALUATION OF
CARDIAC FUNCTION IN PATIENTS WITH NEWLY DETECTED TYPE 2 DIABETES
MELLITUS ‖ was done by me at Stanley Medical College and Hospital during 2009-2010 under
the guidance and supervision of Prof. Dr. A. GOWRISHANKAR, M.D.
The dissertation is submitted to the Tamil Nadu Dr. M.G.R. Medical University towards the
partial fulfillment of requirement for the award of M.D.DEGREE (BRANCH-I) in General
Medicine.
Place : Chennai
ACKNOWLEDGEMENT
I owe my thanks to the Dean, Stanley Medical College and Hospital
Prof. Dr. C.VAMSADHARA, M.D., Ph.D., for allowing me to avail the facilities needed for
my dissertation work.
I am grateful to Prof. Dr. S. MAGESH KUMAR, M.D., professor and Head of the Department
of Medicine, Stanley Medical College for permitting me to do the Study and for his
encouragement.
I have great pleasure in expressing my deep sense of gratitude and respect for
Prof. Dr. A. GOWRISHANKAR. M D, Professor, Department of Medicine and Chief of
Medical Unit III for approving this study and giving suggestions and guidance in preparing this
dissertation.
I am extremely thankful to our unit assistant professors Dr. NALINI KUMARAVELU,M.D.,
Dr. S.CHANDRASEKAR, MD., and Dr. G.VASUMATHI, M.D., Registrar Department of
Medicine for their valuable guidance and constant encouragement.
I sincerely thank Prof. Dr. G. KARTHIKEYAN, D.M., Professor and Head of the Department
of Cardiology, Prof. Dr. D. MUTHUKUMAR, D M, Unit II Chief and other faculties of Dept.
I am thankful to Prof. R. MADHAVAN, M.D., Professor of Diabetology, and
Dr. C. HARIHARAN, M.D., Assistant Professor, Department of Diabetology, Govt. Stanley
Medical College & Hospital for their permission and support in doing this study.
Last but not least, I sincerely thank all my colleagues who shared their knowledge and helped me
CONTENTS
S.NO TITLE PAGE NO.
1. INTRODUCTION 1
2. AIM OF STUDY 3
3. REVIEW OF LITERATURE 4
4. MATERIALS AND METHODS 32
5. OBSERVATION & RESULTS 37
6. DISCUSSION 51
7. CONCLUSIONS 57
ANNEXURE
I BIBLIOGRAPHY
II PROFORMA
III MASTER CHART
INTRODUCTION
Diabetes mellitus which is now being termed as an epidemic is spiraling upwards at an alarming
rate, raising worldwide concern about its devastating effects on health and healthcare systems. It
is estimated that presently there are 200 million diabetics and it is expected to reach 360 million
by 2030 as per World Health Organization projections, with the largest number of cases going to
be seen in China, India and USA. More than 90% of these are likely to be type 2 diabetes (DM)
individuals.
In recent years with the explosion of knowledge and the sound pathophysiological basis, the
distinction between the type2 diabetes and the cardiovascular disease has been blurred, and the
central importance of Cardio Vascular Disease (CVD) prevention is becoming an integral part of
DM management.
T2DM carries an equivalent cardio vascular risk to that of non diabetic individual who already
experienced a coronary event (1). DECODE study (2) has shown that even before diabetes is detected, the person may be predisposed to CVD and these prediabetic levels of blood sugar
predict mortality.
A substantial body of evidence supports the concept that the increase risk of morbidity and
mortality due to CVD is associated with abnormalities in glucose metabolism across the entire
continuum of glucose tolerance ranging from normal to clinical diabetes (1,3) Compared with patients without diabetes, patients with DM have a 2-4 fold greater risk of death from MI or
Diabetes mellitus is an established risk factor for congestive heart failure, but the knowledge of
the pathophysiology and treatment is limited. The Framingham Heart study has shown that the
incidence of congestive cardiac failure in diabetic patients occurs irrespective of coronary artery
disease or hypertension (3).
In overt heart failure, diastolic dysfunction often co-exists with systolic dysfunction as a
consequence of ischemic heart disease, but diastolic dysfunction is a frequent finding in type 2
diabetes mellitus without signs and symptoms of heart disease and is presumably due to diabetic
cardiomyopathy. Left ventricular diastolic function (LVDF) is affected earlier than systolic
function in the development of congestive cardiac failure (4).
Therefore left ventricular diastolic dysfunction may represent the first stage of diabetic
cardiomyopathy, thus an early examination of left ventricular diastolic function may help to
detect this condition in patients with diabetes, thereby allowing early intervention for a more
favorable outcome(5).
This study was done to understand the burden of left ventricular diastolic dysfunction (LVDD) in
patients with newly diagnosed type 2 diabetes and to assess the risk factors for the development
of diastolic dysfunction in such patients.
AIM OF THE STUDY
To assess the effect of isolated type 2 diabetes on left ventricular systolic and diastolic
functional reserve.
To assess the risk factor associated with heart failure in diabetic patients.
To compare this prevalence to that of age and sex matched asymptomatic control
REVIEW OF LITERATURE
Diabetes Mellitus refers to a group of common metabolic disorders that share the phenotype of
hyperglycemia. Several distinct types of DM exist and are caused by a complex interaction of
genetics and environmental factors
.
HISTORY
The first documented evidence of diabetes mellitus was reported in Egyptian papyrus, as a
polyuric state. In 1776 Mathew Dobson established the presence of sugar in blood and urine of
diabetic patients. Type 2 diabetes is the commonest form of diabetes in any country.
EPIDEMIOLOGY
The global evidence of diabetes is estimated to increase from 4% in 1995 to 5.4% by the year
2025. Considerable geographic variation is seen, with most of the cases from India, USA, and
Europe. India has the dubious distinction of having the highest number of diabetes in the
world.The prevalence in India varies from 1.7 to 9.6% in various studies. A multicenter study
done by India Council of Medical Research showed a prevalence rate of 1.73 percent in Indians
above 15 yrs of age. According to Prevalence Of Diabetes in India Study(PODIs) the prevalence
AETIOLOGY OF DIABETES MELLITUS
Type I diabetes mellitus
1. Genetics:
Genetic predisposition is possible permissive and not casual. Risk of diabetes is up to 5times
higher when the father is diabetic rather than mother. This risk is limited to father carrying an
HLA DR4 susceptibility gene.
Risks for identical twin is 33%. Genetic loci - Chromosome 6
2. Viruses
20% of persons with congenital rubella develop IDDM. Cytomegalovirus is present in genome of 20% patients. Others implicated are Coxsackie, Mumps and hepatitis.
3. Diet
Introduction of cow’s milk before the age of 2 – 3 months is associated with an increased risk.
4. Pancreatic pathology
Insulitis
TYPE II DIABETES MELLITUS
Genetics :
Probably polygenic
The role of genetic factors in the etiology of type 2 DM has been appreciated ever since the
recognition of the disease. There is almost 100% concordance in monozygotic twins. Maturity
Life style
Over eating; especially combined with obesity and under activity, leads todiabetes mellitus.
Age
It is principally a disease of middle aged and elderly
Pregnancy
80% of women with gestational diabetes develop permanent diabetes requiring treatment later in life.
Insulin resistance
There is increased hepatic glucose production and resistance to the action of insulin in muscle.
ETIOLOGIC CLASSIFICATION OF DIABETES MELLITUS
1. Type 1 diabetes(β-cell destruction, usually leading to absolute insulin deficiency)
A. Immune – mediated B. Idiopathic
2. Type 2 diabetes (may range from predominantly insulin resistance with relative insulin deficiency to a predominantly insulin secretory defect with insulin resistance)
3. Other specific types of diabetes
A. Genetic defects of β-cell function characterized by mutations in:
a. Hepatocyte nuclear transcription factor (HNF) 4 α (MODY 1)
b. Glucokinase (MODY 2)
d. Insulin promoter factor (IPF) 1 (MODY 4)
e. HNF – 1 β (MODY 5)
f. Mitochondrial DNA
g. Proinsulin or insulin conversion
B. Genetic defects in insulin action a. Type A insulin resistance b. Leprechaunism
c. Rabson – Mendenhall syndrome d. Lipoartrophic diabetes
C. Disease of the exocrine pancreas – pancreatitis, pancreatectomy, neoplasia, cystic fibrosis, hemochromatosis, fibrocalculous pancreatopathy.
D. Endocrinopathies – acromegaly, Cushing’s syndrome, glucagonoma, pheochromocytoma, hyperthyroidism, somatostatinoma, aldosteronoma.
E. Drug or chemical induced – Vacor, pentamidine,
F. Infections – congenital rubella, cytomegalovirus, Coxsackie
G. Uncommon forms of immune mediated diabetes – ―stiff-man‖ syndrome, antiinsulin receptor antibodies.
H. Other genetic syndromes sometimes associated with diabetes – Down’s syndrome, Klinefelter’s syndrome, Turner’s syndrome, Wolfram’s syndrome, Friedreich’s ataxia, Huntington chorea, Laurence – Moon –Biedl syndrome, myotonic dystrophy, porphyria, Prader-Willi syndrome.
4. Gestational diabetes mellitus (GDM).
RISK FACTORS FOR TYPE 2 DIABETES MELLITUS
a. Family history of diabetes (i.e. parent or sibling with type 2 diabetes)
b. Obesity (i.e. > 20% desired body weight or BMI > 25 kg/m2)
c. Age > 45 years
d. Race/ethnicity (e.g. African, American, Hispanic American, Native American, Asian
American, Pacific Islander)
e. Previously identified IFG or IGT
f. History of GDM or delivery of baby over 9 pounds.
g. Hypertension (blood pressure > 140/90 mm Hg)
h. HDL cholesterol level < 0.90 mmol/L (35 mg/dL) and / or a triglyceride level 2.82
mmol/L (250 mg/dL)
STAGES OF DIABETES
Stages of diabetes range from normal glucose tolerance, through IGT and IFG (impaired fasting
glucose), into frank diabetes mellitus, which may be non-insulin requiring, insulin requiring for
control and insulin requiring for survival.
Type 1 DM can be found across the whole spectrum. In the early stages of treatment there can be
a period of non-insulin requirement, but later followed by insulin requirement for survival. In
type 2 DM, insulin may be required during a period of ketoacidosis precipitated by severe stress
or infection.
Diabetes and heart
Patients with diabetes mellitus are at increased risk for cardiovascular diseases. Thus,
cardiovascular complications are the leading cause of diabetes-related morbidity and mortality(2). The American Heart Association recently designed DM as a major risk factor for cardiovascular
disease (same category as smoking hypertension and hyperlipidaemia). Type 2 diabetic patient
without a prior M1 have a similar risk for coronary artery related events as non-diabetic
individuals who have had a prior myocardial infarction(3).
The main factor that contribute to the increased incidence of cardiovascular disease in diabetic
patients are
1. The acceleration of atherosclerotic process leading to macrovascular disease.
2. Development of specific cardiomyopathy.
3. Progressive microvascular disease.
Heart failure
Heart failure is a complex clinical syndrome manifesting as the inability of the heart to fill with
or eject blood due to any structural or functional cardiac conditions. Heart failure can be broadly
classified into Systolic Heart Failure or Heart Failure With Reduced Ejection Fraction (HFREF)
and Heart Failure with Normal Ejection Fraction (HFNEF) also earlier known as Diastolic Heart
Failure. There can also be a combination of both.
Systolic heart failure
Heart failure caused by systolic dysfunction is more readily recognized. It can be described as
impaired contractile or pump function of the heart. It is characterized by a decreased ejection
fraction (less than 45%). The strength of ventricular contraction is attenuated and inadequate for
creating an adequate stroke volume, resulting in inadequate cardiac output. In general, this is
caused by dysfunction or destruction of cardiac myocytes or their molecular components.
Diastolic heart failure
Diastolic heart failure, is defined as symptoms of heart failure in a patient with preserved left
ventricular function. It is characterized by a stiff left ventricle with decreased compliance and
impaired relaxation, which leads to increased end diastolic pressure. Signs and symptoms are
similar to those of heart failure with systolic dysfunction.
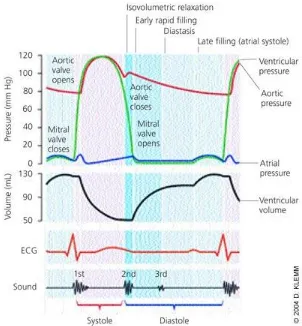
Pathophysiology of diastolic heart failure (7)
Diastole is the process by which the heart returns to its relaxed state; it is also the time for
cardiac perfusion. During diastole, drastic changes in cardiac pressure-volume relationships
occur. The relaxation process has four identifiable phases: isovolumetric relaxation from the time
diastasis, a period of low flow during mid-diastole; and late filling of the ventricles from atrial
[image:17.612.154.456.151.477.2]contraction ( Figure 1).
Figure 1.Cardiac cycle, showing changes in left atrial pressure, left ventricular pressure, aortic pressure, and ventricular volume; the electrocardiogram (ECG); and the phonocardiogram.
In patients with isolated diastolic heart failure, the heart often is able to meet the body's
metabolic needs, but at higher diastolic pressures. The left ventricle is stiff, with decreased
compliance and impaired relaxation. Transmission of the higher end-diastolic left ventricular
pressure to the pulmonary circulation may lead to pulmonary congestion, dyspnea, and other
Diastole is a complex process that is affected by a number of factors, including ischemia, heart
rate, velocity of relaxation, cardiac compliance (i.e., elastic recoil and stiffness), hypertrophy,
and segmental wall coordination of the heart muscle
Heart failure in diabetes
Diabetes accounted for a significant percentage of patients with a diagnosis of heart failure in
numerous epidemiologic studies. The Framingham Study,3 United Kingdom Prospective Diabetes Study,8Cardiovascular Health Study,and Euro Heart Failure Surveysall suggested that the presence of diabetes may independently increase the risk of developing incident heart failure.
The etiology of this abnormality is probably multi factorial and includes factors such as
myocardial ischaemia from atherosclerosis, hypertension and myocardial dysfunction secondary
to chronic hyperglycemia.
The mechanisms of HF in diabetic patients
Figure 3 illustrates the varies mechanism of heart failure in diabetes mellitus. DM may be
causally related to HF development by at least 3 mechanisms:
1. Due to associated comorbidities,
2. By favoring the development of coronary atherosclerosis,
3. Through a specific diabetic cardiomyopathy.
Figure. 2 Potential mechanisms linking diabetes mellitus to heart failure.
Potential mechanisms linking diabetes mellitus to heart failure: Diabetes mellitus is associated with multiple physiopathological changes in the cardiovascular system. Among these, endothelial dysfunction and hemostatic disorders may at least in part account for the higher risk of coronary artery disease (CAD) while microangiopathy, myocardial fibrosis, and abnormal myocardial metabolism have been implicated in the pathogenesis of a specific diabetic cardiomyopathy.
Diabetic cardiomyopathy
Diabetic cardiomyopathy has been defined as the presence of myocardial abnormalities in the
absence of coronary artery disease, hypertension or other significant etiology(3). Hyperglycemia seems to be central to the pathogenesis of diabetic cardiomyopathy and to trigger a series of
maladaptive stimuli that result in myocardial fibrosis and collagen deposition. These processes
are thought to be responsible for altered myocardial relaxation characteristics and manifest as
diastolic dysfunction on imaging (9).
Pathogenesis of Diabetic Cardiomyopathy:
Mechanisms
(10)The pathogenesis of diabetic cardiomyopathy is multifactorial. Several hypotheses have been
proposed, including autonomic dysfunction, metabolic derangements, abnormalities in ion
homeostasis, alteration in structural proteins, and interstitial fibrosis(11,12) Sustained hyperglycemia also may increase glycation of interstitial proteins such as collagen, Interstitial
accumulation of advanced-glycated end products (AGEs), which results in myocardial stiffness
and impaired contractility(13–15)
Several mechanisms that are involved in decreasing myocardial contractility in diabetes
mellitus. These are
(1) Impaired calcium homeostasis,
(2) Upregulation of the renin-angiotensin system,
(3) Increased oxidative stress,
(4) Altered substrate metabolism, and
Impaired calcium homeostasis
The mechanisms by which disturbed calcium homeostasis alters cardiac function in diabetes
include reduced activity of ATPases,(16) decreased ability of the SR to take up calcium, and reduced activities of other exchangers such as Na+-Ca2+ and the sarcolemmal Ca2+ATPase.(17,18). Furthermore, decreased cardiac expression of SERCA2a or the Na+Ca2+ - exchanger has been observed in type 1(10) and type 2 diabetes.(20). Trost et al( 21) observed that transgenic mice overexpressing SERCA2a were protected from streptozotocin-induced cardiac dysfunction,
suggesting that altered calcium handling contributes to impaired cardiac function in diabetes
mellitus.
Activation of the Renin-Angiotensin System
The role of activation of the renin-angiotensin system in the development of diabetic
cardiomyopathy is well recognized.(22) Angiotensin II receptor density and mRNA expression are elevated in the diabetic heart.(23–25) Activation of the renin-angiotensin system during diabetes mellitus has been shown to be associated with increased oxidative damage and cardiomyocyte
and endothelial cell apoptosis and necrosis in diabetic hearts, (26) which contributes to the increased interstitial fibrosis.
Increased Oxidative Stress
Increased reactive oxygen species (ROS) production in the diabetic heart is a contributing factor
in the development and the progression of diabetic cardiomyopathy(27,28) Several groups have shown that ROS is overproduced in both type 1 and type 2 diabetes.29,30 Increased ROS generation may activate maladaptive signaling pathways, which may lead to cell death, which
ROS-mediated cell death could promote abnormal cardiac remodeling, which ultimately may
contribute to the characteristic morphological and functional abnormalities that are associated
with diabetic cardiomyopathy.
In addition to causing cellular injury, increased ROS production might lead to cardiac
dysfunction via other mechanisms. For example, increased ROS has been proposed to amplify
hyperglycemia-induced activation of protein kinase C isoforms, increased formation of
glucose-derived advanced glycation end products, and increased glucose flux through the aldose
reductase pathways,32,33 which may all contribute in various ways to the development of cardiac complications in diabetes mellitus. Thus, strategies that either reduce ROS or augment
myocardial antioxidant defense mechanisms might have therapeutic efficacy in improving
myocardial function in diabetes mellitus.
Altered Substrate Metabolism
Altered myocardial substrate and energy metabolism has emerged as an important contributor to
the development of diabetic cardiomyopathy.34,35. Diabetes mellitus is characterized by reduced glucose and lactate metabolism and enhanced fatty acid (FA) metabolism.36,37 Despite an increase in FA use in diabetic hearts, it is likely that FA uptake exceeds oxidation rates in the
heart, thereby resulting in lipid accumulation in the myocardium that may promote
lipotoxicity(38-40). Lipid intermediates such as ceramide might promote apoptosis of cardiomyocytes, thus representing another mechanism that might lead to cardiac dysfunction.41
Free Fatty Acid Metabolism Disturbances
Figure 3 summarizes the role of altered free fatty acid metabolism and its contribution to the
inducing the ultimate downstream effects. In the absence of diabetes, approximately equivalent
proportions of energy required for cardiac contractility come from glucose metabolism and free
fatty acids; whereas in diabetes, myocardial glucose use is significantly reduced, with a shift in
energy production from beta-oxidation of free fatty acids.42 This reduction in glucose use in the diabetic myocardium results from depleted glucose transporter proteins, glucose transporter-1
and 4. In addition, free fatty acids inhibit pyruvate dehydrogenase, which impairs myocardial
energyproduction and leads to the accumulation of glycolytic intermediates and ceramide,
enhancing apoptosis.43,44 In addition to the effects of free fatty acids on glucose metabolism and oxidative phosphorylation, free fatty acid metabolism for adenosine triphosphate production
requires large amounts of oxygen. The toxic intermediates resulting from free fatty acid
[image:23.612.141.475.402.632.2]metabolism(42,45) (so-called lipotoxicity) can impair myocyte calcium handling, worsening myocardial mechanics.46-48
Figure 3 Overall schema for the pathogenesis of diabetic cardiomyopathy.
Figure 4 Effects of hyperglycemia on the diabetic myocardium.
Mitochondrial Dysfunction
Recent studies of mitochondria have reignited interest in a role for mitochondrial dysfunction in
the pathogenesis of diabetic cardiomyopathy.49-51 Diabetes mellitus causes functional and structural alterations in mitochondria.
Impaired mitochondrial function was initially reported almost 25 years ago when Kuo et al
showed depressed state 3 respiration in db/db heart mitochondria. This study was followed by
Boudina et al demonstrated decreased mitochondrial respiration and reduced protein expression
of the oxidative phosphorylation components in obese type 2 diabetic mice.49 These alterations contribute to cardiac dysfunction because they reduce ATP production, which we speculate will
diminish myocardial high-energy phosphate reserves, thereby contributing to impaired
myocardial contractility.
Autonomic Neuropathy
Diabetic autonomic neuropathy can lead to changes in sympathetic innervations and subsequent
disordered adrenergic receptor expression and altered catecholamine levels in the myocardium.
An increased expression of theβ1-receptor results in enhanced apoptosis, fibrosis, hypertrophy,
and impaired myocardial function.56
DIAGNOSING DIABETIC CARDIOMYOPATHY
There are 2 important components in the clinical diagnosis of diabetic cardiomyopathy: the
detection of myocardial abnormalities and the exclusion of other contributory causes of
cardiomyopathy.
An important challenge in the clinical diagnosis of diabetic cardiomyopathy has been the lack of
any pathognomonic histologic changes or imaging characteristics associated with the diagnosis.
Endomyocardial biopsies are not indicated because of their invasiveness, unless circumstances
to suspect other causes of cardiomyopathy in the differential diagnosis exist (eg, hypertrophic
cardiomyopathy and infiltrative heart diseases).Nevertheless, the presence of myocardial fibrosis
microscopic features, including mitochondrial abnormalities, fatty acid deposits, or even
myocyte hypertrophy, can be evident.
The diagnosis of diabetic cardiomyopathy currently rests on noninvasive imaging techniques that
can demonstrate myocardial dysfunction across the spectra of clinical presentation. There is still
no consensus in the precise imaging definition of diabetic cardiomyopathy, but evidence of
hypertrophy or diastolic dysfunction is likely crucial to support a diagnosis of diabetic
cardiomyopathy, but is not specific to it.
On the basis of the review of the literature, the imaging definition of diabetic cardiomyopathy
that includes either or both features listed as follows:
● Evidence of cardiac hypertrophy determined by conventional echocardiography or cardiac
magnetic resonance imaging;
● Evidence of LV diastolic dysfunction (with or without LV systolic dysfunction), either
clinically by transmitral Doppler or tissue Doppler imaging (TDI), or evidence of left atrial
enlargement; or subclinically by novel imaging techniques or provocative testing (eg, strain rate
Methods of diagnosing diastolic dysfunction
Cardiac catheterisation with simultaneous pressure and volume measurements is the ―gold
standard‖ for assessing LV diastolic function. The rate of LV relaxation, rate and timing of
diastolic filling as well as myocardial and chamber stiffness can be determined [57]. However, this
diagnostic method is invasive and cannot be performed in all patients with suspected diastolic
dysfunction.
During the last two decades, Doppler echocardiography has emerged as an important and easy to
perform noninvasive diagnostic tool providing reliable data on diastolic performance. The
trans-mitral flow across the trans-mitral valve demonstrates a biphasic pattern, in which an early peak flow
occurs during rapid early diastolic filling (peak E) and a late peak occurs during atrial
contraction (peak A).Based on Doppler trans mitral flow, a grading system for diastolic
dysfunction has been proposed.
Three characteristic abnormal LV diastolic filling patterns mainly based on the E/A ratio have
been proposed [58]
The first abnormal filling pattern, called ―delayed relaxation‖, results in a reversed E/A
ratio (E/A < 1) when relaxation impairs. It identifies patients with early stages of heart
disease.
The second pattern, representing abnormalities of both relaxation and compliance, has
been termed pseudo normalization, because of an apparently normal E/A ratio (E/A > 1).
The third abnormal filling pattern, termed ―restrictive filling‖, found in patients with
severe decrease in LV com pliance, causes an increased E/A ratio (often above 2). It
identifies advanced, usually symptomatic disease with poor prognosis.
Other Doppler derived indices have been proposed, of which deceleration time (the time interval
of peak E wave velocity to zero), and isovolumic relaxation time (time from the end of systolic
Normal trans–mitral-valve spectral Doppler flow pattern. The E-to-A-wave ratio is pproximately 1.4 to 1.0.
Trans–mitral-valve Doppler flow tracing in a patient with mild diastolic dysfunction (abnormal relaxation). The E-to-A-wave ratio is less than 1.0.
LEFT VENTRICULAR FUNCTION IN DIABETES MELLITUS
Numerous studies have shown that impairment of the LV diastolic function may be detected in
patients with diabetes The existence of a diabetic cardiomyopathy was first suggested by Rubler
et al (59) in 1972 on the basis of postmortem findings in four adult diabetic subjects with non-coronary congestive cardiac failure (CCF)
.
Subsequent observations by the Framingham workers about the most frequent occurrence of
CCF among the diabetics than could be explained by hypertension or ischemic heart disease
alone, interest was renewed in the field of cardiac involvement in long-standing diabetic patients.
Regan et al. [60] demonstrated in normotensive, diabetic patients without coronary artery disease
and without clinical evidence of heart failure, increased left-ventricular end-diastolic pressure,a
decreased left-ventricular end-diastolic volume with a normal ejection fraction
Hamby et al (61) Impaired left ventricular (LV) function may frequently be detected in
asymptomatic diabetic subjects and is related to the extent of diabetes and evidence of micro
vascular complications. Although systolic and diastolic functions of the heart are impaired in
diabetes, many studies have shown that the LV diastolic abnormalities are most common and
Thus, diastolic abnormalities present in diabetic patients without diabetic complications or
cardiovascular disease has been suggested as an earliest functional effect of a specific diabetic
cardiomyopathy [62, 63].
In the large majority of studies, abnormalities of LVdiastolic function have been demonstrated
in diabetic patients with intact systolic function Raev et al. [64].
It is now clear from the various studies that the primary functional abnormality in a diabetic heart
is the impairment of LV diastolic function reflecting the reduced LV filling and that even the
systolic functional alteration is the result of reduced LV filling.
EVALUATION OF LV FUNCTION IN DIABETIC SUBJECTS
There are two chief methods of evaluating the LV function
1. Utilizing the non-invasive techniques.
2. Invasive techniques
Non-invasive methods include the assessment by
a) Systolic time intervals (STI)
b) Apex cardio graphy (ACG)
c) Radio nucleotide ventriculography
d) Echocardiography and cardiac Doppler
Invasive method is by cardiac catheterization delineating the coronary artery anatomy and LV
angiography. This procedure is usually reserved for symptomatic diabetic subjects with overt or
ECHOCARDIOGRAPHY- M-MODE AND 2-D
Aerakisnen et al(65) utilizing the digitalized M-mode technique studied 36 female IDDM
patients with a mean duration of diabetes of 10 years or more and found that the most common
abnormality (19 pts) was prolonged rapid filling period while the systolic function was normal in
all. Another study recorded simultaneous echo and phonocardiogram in142diabetics. The LV
relaxation, the rate and duration of cavity dimension increase and wall thinning were determined.
Delayed mitral valve opening (MVO) relative to minimal LV cavity dimension and aortic valve
closure (AVC) was found in all but 12 subjects, especially in those with micro vascular
complications. Prolongation of isovolumic relaxation time (IVRT) i.e. measured as period
between AVC and MVO (abnormal, if more than 110 m sec), which can be demonstrated using
dual M-mode echo preferably at 100 min/sec speed showing simultaneous aortic and mitral valve
levels, is an important diastolic abnormality, as found by Sanderson et al(66) .
Others using quantitative cross-sectional echocardiography and stress myocardial perfusion
scintigraphy found that diabetic subjects had mildly reduced LV end diastolic volumes and
impaired diastolic filling as assessed by lower left atrial emptying index compared to controls.
The left atrial emptying index is defined on M-mode tracing of the aorta
DOPPLER TECHNIQUES
Pulsed Doppler ultrasound interrogation of mitral inflow velocities (Doppler cursor placed at the
tips of the mitral leaflets on apical 4-chamber view) gives a simple and reproducible method of
determining the LV filling that correlates well with radio nucleotide and invasive techniques.
peak velocity of rapid early ventricular filling ('E') and a relatively low peak velocity of late
inflow due to atrial contraction (A). Impaired diastolic filling of the left ventricle in both Type 1
and Type 2 asymptomatic diabetics without the evidence of cardiovascular disease and unrelated
to microangiopathic complications has been demonstrated using PW Doppler which showed
reduction in the early filling velocity (reduced 'E' peak) and compensatory increase in the late
flow (increased 'A' peak) and thus increased A/E ratio (i.e. A/E more than 1). Besides, the
deceleration of 'E' velocity is prolonged indicating a slow rapid-filling phase ('E' deceleration
more than 250 m/sec). Increased atrial contribution to LV filling can be assessed by the area
under the late diastolic filling envelope compared to the total diastolic area. Various studies have
demonstrated these above Doppler findings in young diabetic subjects without evidence of heart
failure.
A 3-year follow-up study by Charella et al of a group of asymptomatic diabetics with slow filling
and wall thinning demonstrable on echocardiography showed 31% developing heart failure and
19% that died. Measurement of LV diastolic function may therefore prove to be a useful
indicator of cardiovascular morbidity and mortality in diabetics.
Hence abnormal diastolic function suggestive of reduced LV compliance resulting in a 'Stiff'
myocardium appears to be the hall mark of the specific type of diabetic heart muscle disease.
The presence or addition of hypertension or coronary artery disease will certainly put a new
burden on the already 'non-compliant’ myocardium in long-standing diabetics with or without
PREVENTION AND THERAPY
Glycemic Control
The prevention and treatment of diabetic cardiomyopathy are clinically relevant because of its
role in the pathogenesis of heart failure. Although the effect of glycemic control on diabetic
cardiomyopathy has been studied in only a limited fashion, evidence suggests that good glycemic
control is beneficial, at least in the early stages of myocardial dysfunction (67-69). Evidence also suggests that diabetic cardiomyopathy does not develop in patients with tightly controlled type 1
diabetes, supporting an important role for hyperglycemia in the pathogenesis of diabetic
cardiomyopathy70. Hyperglycemia is responsible for microvascular complications in diabetes,
and because microvascular alterations are thought to contribute significantly to the pathogenesis
of diabetic cardiomyopathy, good glycemic control is perhaps the most important component in
the overall management of diabetic cardiomyopathy. Firm recommendations regarding the
choice of current glucose-lowering therapies in patients with diabetic cardiomyopathy cannot be
made because of a lack of evidence.
However, glucagon-like peptide-1 analogues have demonstrated improved hemodynamic
variables in diabetic patients without overt heart failure. Improved cardiac parameters also have
been noted with this agent class in post infarction and in populations with advanced heart
failure(71). On the other hand, the use of thiazolidinediones in the management of patients with diabetic cardiomyopathy is problematic because of a propensity for fluid overload. In general,
the choice of antidiabetic therapy in diabetic cardiomyopathy should be dictated by clinical
characteristics,such as the presence or absence renal dysfunction, risk of hypoglycemia, age,
Neurohormonal Antagonism
The important role of the renin-angiotensin-aldosterone system in the pathogenesis of
complications in diabetic patients is well described. Evidence supports the use of Angiotensin-
Converting Enzyme Inhibitors in preventing myocardial fibrosis, cardiac hypertrophy, and
myocardial mechanical dysfunction associated with diabetic cardiomyopathy.72-74
Angiotensin-converting enzyme inhibition and angiotensin-1 receptor blockade also have been shown to
prevent coronary perivascular fibrosis and collagen deposition.75 The Angiotensin Receptor
Blocker, candesartan, can improve echocardiographic parameters of diastolic dysfunction,
reduce collagen synthesis, and increase collagen degradation in asymptomatic diabetic subjects.76
Novel Therapies Targeting Diabetic Cardiomyopathy
Therapies directed toward the prevention and progression of diabetic cardiomyopathy are in the
early stages of clinical development and have targeted either enhanced fibrosis/collagen
deposition or alterations in cardiomyocyte metabolism.The majority of the agents listed below
are in experimental stages, and none of them have been approved for use in diabetic
cardiomyopathy. Notable among these novel agents are Advance Glycation End Product
Inhibitors (eg,aminoguanidine, alanine aminotransferase 946, and pyridoxamine);Advance
Glycation End Product Cross-Link Breakers (eg, alanine aminotransferase 711); and copper
chelation therapy (eg, trientine). Modulators of free fatty acid metabolism,such as
trimetazidine, have proven useful in the management of angina, but their efficacy on diabetic
cardiomyopathy is unknown. Exenatide (recombinant glucagon-like peptide-1, a Food and Drug
Administration-approved glucose-lowering agent) has yet to be studied specifically in patients
with diabetic cardiomyopathy patients despite promising cardiac effects with glucagon-like
MATERIALS AND METHODS
The Clinical materials were newly diagnosed Type-2 Diabetes Mellitus individuals selected
from Diabetic outpatient department and the department of internal medicine in the Stanley
hospital,Chennai-1
About 77 patients were subjected to initial assessment , it included through clinical examination,
routine blood investigation consisting of biochemistry investigation, ECG, estimation of HbA1c
and echo cardiography were done from which 50 patients were included in the study and
compared with 50 healthy age and sex matched controls.
Informed consent was obtained from all the subjects and the hospital ethical board committee
ethically approved the study.
The Period of study was from march 2009 to September 2010.
STUDY DESIGN – case control study
STUDY GROUPS
Group I - 50 newly diagnosed Type II Diabetes Mellitus patients.
Group II - 50 healthy controls
.
INCLUSION CRITERIA
Newly diagnosed Type II Diabetes Mellitus
Healthy controls
EXCLUSION CRITERIA
Patients with age above 70
Systemic Hypertension.
conduction disturbance on ECG.
Documented Ischaemic heart disease
History suggestive of previous angina, congestive cardiac failure.
Documented evidence of other cardiac disease like cardiomyopathy
Valvular heart disease
Congenital Heart Disease
primary myocardial diseases,
pericardial diseases,
Chronic obstructive pulmonary disease
sustained arrhythmias
CKD
liver diseases
thyroid diseases
pregnancy and seriously ill patients
CRITERIA FOR DIAGNOSIS
Revised criteria for diagnosing diabetes mellitus has been issued and taken from American Diabetes Association and the World Health Organization.
The criteria is based on the premises that
1. The spectrum of fasting plasma glucose (FPG) and the response to an oral glucose load varies in normal individuals.
2. Diabetes Mellitus defined as the level of glycemia at which diabetic specific complications are noted and not on the level of glucose tolerance from a population based viewpoint.
CRITERIA for Diagnosis of Diabetes(6)
1. HgbA1c of ≥ 6.5% is new diagnostic criterion. Needs to be done in a lab setting using
NGSP certified method and following DCCT standard (point of care tests are not
accepted)
2. HgbA1C can not be used to diagnose diabetes in pregnancy nor in patients with anemia
from iron deficiency or hemolysis Increased rate of red cell turnover
3. Fasting Plasma Glucose > or = 126 (no calories for 8 hours)
4. 2 hour plasma glucose > or = 200mg/dl using 75gm OGTT
5. Random plasma glucose > or = 200 with hyperglycemiaSymptoms
Note: In the absence of unequivocal hyperglycemia and acute metabolic decompensation, these
All of them were subjected to echocardiography done at the Department of Cardiology, Stanley
hospital, Chennai. Echocardiograms were done using the commercially available Esaote`S My
Lab50. which has the capabilities of performing two dimensional, M mode, Pulsed wave and
continuous wave Doppler and colour flow imaging was used to obtain echo cardiogram images.
Phased array transducers 2.5 - 3.5 MHz frequencies were used to obtain 2-D / M-mode echo
cardiography. Images were obtained with subjects in 30 degree lateral decubitus position. All
measurements were performed in the freezed images from all the patients, good quality images
suitable for the measurements and interpretations were obtained and recorded.
For assessment of LV systolic function the following parameters were calculated from the M-
mode echocardiogram obtained at the level of mitral valve chordae. LV dimension diastole
(LVId) systole (LVsd) and thickness of inter ventricular septum, left ventricular posterior wall
thickness in diastole.LV ejection fraction was calculated using the following formula,
EF= LVEDV-LDESV/ LVEDV x 100
For the assessment of LV diastolic dysfunction following parameters were calculated from
doppler transmitral flow velocities in the apical 4-chamber view by positioning the pulsed
doppler sample volume between the tips of the mitral leaflets.
1. LV filling during the early rapid phase(E wave m/s ),
2. LV filling during atrial contraction (A wave m/s)
3. Ratio of the filling velocity E/A ratio
4. Deceleration time ( from the peak of E wave to the point at which the deceleration velocity
reaches the base line)
STATISTICAL ANALYSIS
All data were expressed as mean ± SD. Statistical analysis was performed using Graph pad
Instat. Student`s T test were used between group comparison. Differences in variables between
patients with and without LV diastolic dysfunction were analyzed using Fisher’s Exact test and
a P value of less than 0.05 was considered as statistically significant.
OBSERVATIONS AND RESULTS
Table No 1.
SEX DISTRIBUTION
Category Sex Total
Female Male
Diabetic patients 32 18 50
Controls 30 20 50
Out of 50 patients in study group, 32 were female and 18 were male. In control
group 30 were female and 20 were male.
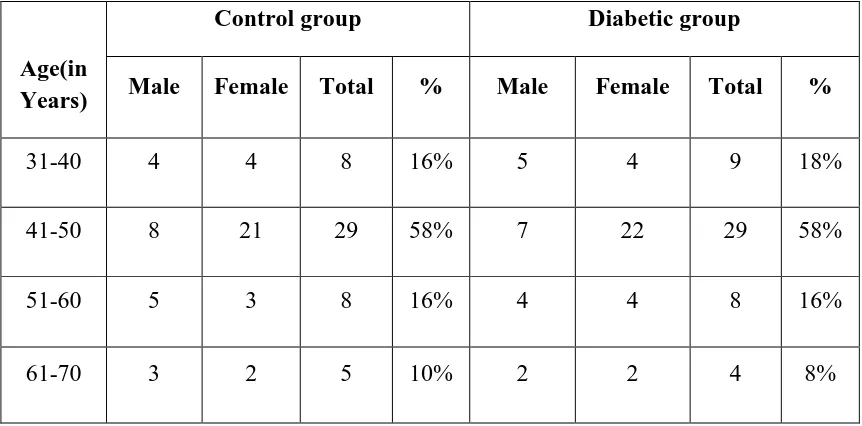
Table No. 2
AGE DISTRIBUTION
Age(in Years)
Control group Diabetic group
Male Female Total % Male Female Total %
31-40 4 4 8 16% 5 4 9 18%
41-50 8 21 29 58% 7 22 29 58%
51-60 5 3 8 16% 4 4 8 16%
61-70 3 2 5 10% 2 2 4 8%
More than half of the study population and control population belong to age group of 41-50 years (58%).
[image:43.612.189.422.74.184.2] [image:43.612.91.522.363.576.2]The Health Ministry has reduced the diagnostic cut-offs for body mass index (BMI) to 23 kg/m2
[image:45.612.83.522.205.423.2]and the standard waist circumference to assess obesity (77 )
Table No .3 DISTRIBUTION OF BMI IN DIABETIC GROUP
Body Mass Index 31-40
years
41-50 years
51-60 years
60-70 years
Total Percentage
<18.5 Low BMI 0 1 1 0 2 4%
18.6-23 healthy 6 7 2 1 16 32%
23.1-25 Over wt 4 7 2 1 14 28%
>25 obesity 0 13 3 2 18 36%
In study groups 4% were in low BMI
32% were in healthy state
28% were overweight and
36% were obese .
Body mass index
31-40 years
41-50 years
51-60 years
60-70 years
Total Percentag
e
<18.5 Low BMI
2 3 1 1 7 14%
18.6-23 healthy 9 8 3 3 23 46%
23.1-25 Over wt 4 8 1 2 15 30%
>25 obesity 1 2 2 0 5 10%
14% had low BMI, 46% had acceptable BMI, 30% had over weight and 10% had obesity
In this study, obesity is more in diabetic population than control groups (36% vs.10%)
Unfavorable BMI was found in 32 patients out of 50(64%) 18 were overweight and 14
were obese in diabetic group, where as in control group 20 people had un favorable BMI
[image:46.612.80.527.70.294.2](40%) 15 were overweight and 5 were obese.
In study group 52% were in high risk. Females (40%) are more in high risk than male(12%).
In control groups 20% were in high risk. Here also females (14%) are more in high risk than male(6%) .
Waist hip ratio
Male Female ≤0.95 low risk 0.96-1 moderate risk 1.0+ high risk ≤0.80 low risk 0.81-0.85 moderate risk 0.85+ high risk
No of diabetic patients
8 4
6 4 8 20
STATISTICAL ANALYSIS
STUDY GROUP BMI mean value T value P value
Total DM patients
Total control
25.396 ± 4.375
22.012 ± 3.441 4.298 <0.0001
Male patients
Male control
24.846 ± 4.949
22.669 ± 4.116 1.480 0.1477
Female patients
Female control
25.872 ± 4.089
23.187 ± 3.948 2.657 0.010
STUDY GROUP W/H ratio T value P value
DM patients
control
0.9226 ± 0.1252
0.8372 ± 0.0919 3.887 0.0002
Male patients
Male control
0.9389 ± 0.1369
0.8570 ± 0.1155 1.999 0.0532
Female patients
Female control
0.9134 ± 0.1148
0.8332 ± 0.0768 3.353 0.0013
Lipid analysis
The above statistical analysis showed significant correlation between groups regarding the Body
Mass Index, Waist/Hip Ratio, Triglycerides, total cholesterol, HDL, and LDL.
Study group
S.cholesterol T value P value
Patients 205.08 ± 31.04 4.190 <0.0001
control 178.90 ± 31.43
Study group TGL T value P value
patients 197.18±74.93 4.611 <0.0001
control 142 ± 38.46
Study group HDL T value P value
patients 42.4±8.827 2.349 0.0208
control 46.44 ± 8.367
Study group LDL T value P value
patients 124.26±32.47 4.289 <0.0001
Table .6 COMPARISON OF CHARACTERISTICS BETWEEN SUBJECTS WITH NORMAL AND THOSE WITH DIASTOLIC DYSFUNCTION IN DIABETIC POPULATION
Variables
Diabetic patients
T value P value
With Normal LV function(36) with diastolic dysfunction(14) Age years Male :female BMI W/H ratio FBS PPBS HBA1C T.CHOLESTEROL TGL HDL LDL Urea S.Creatinine
45.56 ± 7.16
14:25
24.48 ± 3.96
0.907 ± 0.13
163.28 ± 44.41
261.81 ± 61.74
8.13 ± 1.48
197.75 ± 25.52
179.17 ± 56.53
43.97 ±8.5
117.81 ± 26.9
30.87±7.7
0.74±3.8
53.07 ± 8.76
4:10
27.18 ± 3.64
0.963 ± 0.11
187.5 ± 56.49
316.86 ± 57.86
9.16 ± 1.4
223.93 ± 36.72
243.5 ± 97.03
38.36 ± 8.65
140.86 ± 40.20
33.77±9.6 0.79±4.3 3.129 2.205 1.437 1.603 2.879 2.250 2.868 2.927 2.088 2.356 0.9740 0.7645 0.003 0.0323 0.1585 0.1156 0.0059 0.0291 0.0061 0.0052 0.0422 0.0226 0.3350 0.2643 ECHO variables IVS thickness LVPW thickness EF%
10.36 ± 1.53
9.26 ± 1.18
57±8.2%
11.61 ± 0.99
10.75 ± 1.2
[image:50.612.82.562.169.700.2]Baseline characteristics and laboratory data shows significant differences within diabetic group
regarding the Body Mass Index, Waist/Hip Ratio, FBS, PPBS, Triglycerides, total cholesterol,
HDL, and LDL. No significant differences with respect to urea and creatinine concentrations
were observed.
Echocardiographic data are showed there were no significant differences within diabetic group
regarding left ventricle ejection fraction, but there were significant differences in thickness of
[image:51.612.70.545.317.643.2]interventricular septum, thickness of left ventricle posterior wall.
Table No .7 TRANSMITRAL DOPPLER FLOW VELOCITY RECORDING
Doppler parameter
Diabetic patients control
Subjects with normal cardiac function
Subject with diastolic dysfunction
Subjects with normal cardiac function
Subject with diastolic dysfunction
Number 36(72%) 14(28%) 45(90%) 5(10%)
E wave(cm/s) 71± 10 56 ±10 69± 11 58 ± 12
A wave(cm/s) 58 ±8 71 ±3 52 ±9 69 ± 4
E/A 1.26± 0.09 0.78 ±0.053 1.34± 0.17 0.81 ± 0.10
DT(ms) 218 ± 46 244 ±51 189 ± 42 238 ± 48
Transmitral velocity data showed the significant low E/A ratio (E<A), prolonged declaration
time (>240ms) and isovolumetric relaxation time (>110ms) in patients with diastolic dysfunction
[image:52.612.111.503.471.709.2]both in study group and control group.
Table .8 GRADING OF DIASTOLIC DYSFUNCTION IN STUDY GROUPS
Diastolic function category
New diabetic patients
Control group
1.Normal pattern 36 45
2.Impaired relaxation 14 5
3.Pseudo normal pattern 0 0
4.Restrictive pattern 0 0
All of them had Grade I Diastolic dysfunction only.
GRADING OF DIASTOLIC DYSFUNCTION IN STUDY GROUPS
0 5 10 15 20 25 30 35 40 45
RESULTS
Table No.9INCIDENCE OF DIASTOLIC DYSFUNCTION IN STUDY GROUPS
Study group With diastolic
dysfunction
Without diastolic dysfunction
Total
New diabetic patients
14 36 50
control 5 45 50
Fisher`s exact test showed, the two- sided P value is 0.0395, and the Relative risk is 2.80
considered statistically significant.
Of the 50 patients of diabetic group that were included in the study, diastolic dysfunction was
detected in 14 patients giving an incidence of 28% .Where as in control group, out of 50 people
5 had diastolic dysfunction giving an incidence of 10% , revealing a threefold risk in the
incidence of diastolic dysfunction in newly diagnosed diabetic patients.
Table No .10 DIASTOLIC DYSFUNCTION AND AGE DISTRIBUTION IN STUDY GROUPS
Age Diastolic dysfunction
New diabetic patients Control group
40-50 7 0
51-60 4 2
61-70 3 3
Diastolic dysfunction occurs more earlier in new diabetic patients than control population 50% in
[image:53.612.176.437.544.643.2]INCIDENCE OF DIASTOLIC DYSFUNCTION IN STUDY GROUPS
DIASTOLIC DYSFUNCTION AND AGE DISTRIBUTION IN STUDY GROUPS
0% 10% 20% 30% 40% 50% 60% 70% 80% 90% 100%
diabetes group control
without Diastolic dysfunction with diastoli dysfunction
Table No. 11 GENDER DISTRIBUTION OF DIASTOLIC DYSFUNCTION
In study groups, of the 32 females 10 patients(31.25%) had LVDD while of the 18 males 4
patients had LVDD(22%).In control groups, of the 30 females 3 person(10%) had LVDD while
of the 20 males 2 person had LVDD(10%)
GENDER DISTRIBUTION OF DD IN STUDY GROUPS
MALE FEMALE 0 5 10 15 20 25 NORMAL DIASTOLIC DYSFUNCTION MALE FEMALE study group
diabetic patients control group
normal function with diastolic dysfunction normal function with diastolic dysfunction
male 14 4 18 2
Table .12 ANALYSIS OF ASSOCIATED RISK FACTORS IN NEW DIABETIC PATIENTS WITH DIASTOLIC DYSFUNCTION
Total BMI>25 WHR
>1/>.85 FBS>200 PPBS>300
HbA1C
> 9
T. chol > 240
TGL >200
HDL <40
LDL >30
14 8 7 5 9 6 4 8 8 5
Out of 14 patients, 4 were male and 10 of them were female. 73% were obese, 64 % had higher
waist-hip ratio, 45.46% had FBS >200, 82% had post prandial glucose >300 mg%, 57% had
HbA1C > 9% and >50% had dyslipidemia.
Table .13 ANALYSIS OF ASSOCIATED RISK FACTORS IN CONTROL GROUP WITH DIASTOLIC DYSFUNCTION
Total BMI>25 WHR
>1/>.85 T. Chol> 240
TGL
>200 HDL <40 LDL >30
5 1 3 0 1 2 1
Out of 5 patients, 2 were male and 3 of them were female.
Compared to the patients with diastolic dysfunction in control group, new diabetic patients with
diastolic dysfunction had significantly higher BMI and dyslipidemia.
In new diabetic patient, those who are having high PPBS at the time of diagnosis had significant
[image:56.612.68.565.369.431.2]DISCUSSION
Epidemiological data indicate a greater risk of cardiovascular morbidity and mortality,
particularly congestive cardiac failure, in diabetic subjects as compared with those without
diabetes (78). The prevalence of diastolic dysfunction in diabetic population ranges from 30% to
70%.
Left ventricular diastolic dysfunction may represent the first stage of diabetic cardiomyopathy
reinforcing the importance of early examination of diastolic function in individuals with
diabetes.
Our study showed that the prevalence of diastolic dysfunction in newly diagnosed type 2
diabetic patients was 28% and those in control population it was 10% .
Similar findings have been reported with Doppler echocardiography (E/A ratio), in newly
diagnosed type 2 diabetic patients free of microvascular complications, without evidence of
hypertension and coronary artery disease [79-81].
In the study of Gough et al. [79]LVdiastolic function was assessed with pulsed wave Doppler
mitral flow velocities in20 normotensive patients with a new diagnosis of type 2 diabetes
mellitus. The E/A ratio was significantly reduced in the diabetic group but despite improvements
in glycemic control over 3 months (HbA1c 9.9% to 7.4%), maintained at 6 months (HbA1c
7.0%), there were no changes in the E/A ratio.
In the study of Beljic et al. [80] LV diastolic function was evaluated at the onset of disease and
after 6 and 12 months of adequate glycemic control. A significantly reduced value of peak E/A
ratio was found in the diabetic patients before treatment, but did not significantly change after 1
Vanninen et al. [81] also demonstrated in a population of newly diagnosed diabetics,
an improvement of diastolic function concomitantly with declining blood glucose levels
evaluated after a 15-month period. Of note, this was demonstrated with a complex
echocardiographic indices but not with the conventional mitral E/A ratio.
Di Bonito et al. [82] reached to the same conclusions in a case-control study using Doppler
echocardiography (E/A ratio). They observed diastolic dysfunction in 16 normotensive type 2
diabetic patients, free of microvascular complications with a disease duration of less than 1 year.
These observations of an impaired diastolic function in patients with newly diagnosed diabetes
or with a short duration of the disease and with no microangiopathic complications suggest that
this alteration may occur early in the history of type 2 diabetes and would not be related to
microvascular complications.
Celentano et al. [83] studied 64 subjects with normal glucose tolerance (n = 25), with impaired
glucose tolerance (n = 15) and with type 2 diabetes mellitus (n = 24) diagnosed by an oral
glucose tolerance test according to the recommendations of the World Health Organization. They
found early signs of diastolic dysfunction (assessed by E/A mitral flow ratio), not only in patients
with diabetes but also in those with impaired glucose tolerance, independent of the confounding
role of ischemia, body weight, and blood pressure.
Poirier et al(84) in 2001 in Canada attempted to determine the prevalence of left ventricular
which included 46 men who has no evidence of diabetic complications, hypertension, coronary
artery disease, congestive cardiac failure, thyroid or renal disease. Left ventricular diastolic
dysfunction was found in 28 (60%) subjects impaired relaxation.
Bajraktari et al (85) in 2004 in Kosovo demonstrated that left ventricular diastolic dysfunction
was present in 68.8% of asymptomatic type 2 diabetic patients as compared to 34.9% in the
control group without diabetes which was due to the presence of asymptomatic diabetic
cardiomyopathy which was present in the diabetic population.
It was also noted that diastolic dysfunction is more common among diabetic women and they
also had a more advanced form of diastolic dysfunction as compared to men
In our study, 0f the 32 female patients 10 patients(31.25%) had LVDD while of the18 male 4 patients(22%) had LVDD
In Framingham study also females out numbered the males.The Strong Heart study by Devereuex and colleagues in 2000 also
demonstrated that diastolic dysfunction is more prevalent in women than in men. (86)
This could be due to hormonal changes that accompany after menopause.
Hypertension and IHD are recognized as important risk factors for left ventricular (LV) diastolic
dysfunction. Some studies have shown that diabetes itself may also be an independent risk factor
for LV diastolic dysfunction.
In our study post prandial blood sugar (PPBS) and HbA1c significantly correlated with diastolic
dysfunction
Poirier and colleagues 84 also did not find any difference in the glycemic indices and concluded that fasting blood glucose levels did not correlate with the presence of diastolic dysfunction in
type 2 diabetes.However, Holzmann and colleagues demonstrated that the presence of diastolic
dysfunction is related to the concentrations of fasting blood glucose, post prandial blood glucose
and HbA1c (89).
BMI was higher in patients with DD (27.18 ± 3.64 vs. 24.48 ± 3.96 kg/m2; P value of 0.0323) , it has direct correlation with LVDD. But WHR (waist hip ratio) not significantly correlate with
diastolic dysfunction
Diabetic patients who had abnormal lipid values had increased incidence of LVDD than who had
The potential risk factors for the development of diastolic dysfunction in type 2 diabetics that
were determined were; (a) age ≥45 years was associated with an almost three times higher risk
for the development of diastolic dysfunction, (b) females had almost two times a higher risk for
the development of diastolic dysfunction as compared with men, and (c) diabetic patients with
high PPBS and high HbAIc were higher risk of developing diastolic dysfunction (d)diabetic
patients with high BMI and dyslipidemia was associated with higher risk for the development of
diastolic dysfunction
STUDY LIMITATION
The limitation of our study was that TMT was not performed thus the possibility of coronary
artery disease could not be completely excluded however the absence of clinical,
Electrocardiographic and Echocardiographic evidence makes it unlikely, and this study was done
SUMMARY
Incidence of diabetes is more common in the age group of 41-50years
Incidence of diastolic dysfunction is higher in new type 2 diabetic patients than control
group, (28% vs 10%) with significant p value 0.039, they are in three fold risk in
developing DD than general population.
Systolic dysfunction was not found in any newly detected type 2 diabetic patients.
Patients with LV diastolic dysfunction were older than patients without LV diastolic
dysfunction in new diabetic patients.(53.07 ± 8.76 vs. 45.56 ± 7.16 years; P 0.003).
Diastolic dysfunction occur more earlier in diabetic patients (40-50years), compared to
control group where diastolic dysfunction commonly occur in elderly people (60-70).
Diastolic dysfunction in new type 2 diabetic patients showed a higher incidence in female
population compared to male (28% vs 22%). Interestingly diastolic dysfunction occurs in
later age group in female than male (>50years vs >40 years).
Analysis clearly showed that new diabetic patient with diastolic dysfunction had
CONCLUSIONS
The incidence of diastolic dysfunction was found significantly high in newly
diagnosed type 2 diabetes mellitus patients as compared with non diabetic subjects.
Prevalence of diastolic diastolic dysfunction in new diabetic population has female
preponderance in the ratio of 2:1 .
Among the type 2 diabetes patients, Advancing Age, abnormal BMI, PPBS, raised
HbA1c, elevated Total Cholesterol and Triglyceride were significantly associated
with diastolic dysfunction.
Hence all newly detected diabetes with these risk factors should be evaluated for
cardiac function with echocardiography.
When definite therapeutic and prevention strategies have evolved, then it may
become necessary and useful to screen all new diabetic patients for LV diastolic
BIBLIOGRAPHY
1.Haffner SM, Lehto S, Ronnemma T, Pyorala K, Laakso M. Mortality from coronary heart
disease in subjects with type 2 diabetes and in non diabetic subjects with and without prior
myocardial infarction. N Engl J Med 1998;339:229-34.
2.The DECODE study group ,on behalf of European Diabetes Epidemiology Study
roup;glucose tolerance CV mortality:Arch.intern.med 2001 161:397-405
3. Kannel WB, Hjortland M, Castelli WP. Role of diabetes in congestive heart failure; The
Framingham heart study. Am J Cardiol 1974;34: 29-34.
4. Zarich SW, Arbuckle BE, Cohen LR, Roberts M, Nesto RW. Diastolic abnormalities in young
asymptomatic diabetic patients assessed by pulsed Doppler echocardiography. J Am Coll Cardiol
1988; 12: 114-20.
5. Raev DC. Which left ventricular function is impaired earlier in the evolution of diabetic
cardiomyopathy? An echocardiographic study of young type 1 diabetic patients. Diabetes Care
1994: 17; 633-639.
6. Diabetes Care, Volume 33, Supplement 1, January 2010, p. S4
7. Cecilia Gutierrez, M.D, and Daniel G. Blanchard, M.D., University of California, San Diego,
School of Medicine, La Jolla, California- Diastolic Heart Failure: Challenges of Diagnosis and
TreatmentAm Fam Physician. 2004 Jun 1;69(11):2609-2617.
8. Stratton IM, Adler AI, Neil HA, et al. Association of glyce